Introduction
Tilapia is a tropical fish which belong to genus of Tilapia, Perciformes. It is also one of the fish varieties promoted by the Food and Agriculture Organization (FAO) of the United Nations due to its versatile feeding habits, rapid growth rate, strong disease resistance and the ability withstand stress.1 GIFT tilapia (Oreochromis nilotcus) is a tilapia with improved genetic traits. Since 2015, the large-scale factory running-water farming of GIFT tilapia has been established and a set of comprehensive and reliable aquaculture models and processes has been formed in China. Manganese (Mn) belongs to the group of transition metals, which ranks fifth in abundance among all metals on Earth. Manganese ions are active components of the natural immune system. It plays crucial roles in almost all life processes including gene expression regulation, cell signaling, and ontogeny; about one-third of known proteases required manganese ions for physiological functions, the latter for structural, catalytic or regulatory functions as cofactors.2,3 However, there is currently a limited body of research on the accumulation and distribution of Mn ions and its toxicological effects in run-water farming at present.4,5 In the past, the toxicology on tilapia was mainly studied in still-water culture.6,7 At present, there is a lack of research on the physiological parameters of flow speed and exposure to Mn ion on GIFT tilapia in laboratory conditions. This study could elucidate toxicological influence of manganese ions on fish at varying flowing speeds, aiming to provide fundamental data for understanding the ecotoxicological effects of heavy metal stress on fish in flowing water environment and for supporting the artificial farming of GIFT tilapia in such conditions.
Materials and Methods
Experimental fish
The experiment was conducted at the Fish Physiology Laboratory, Bohai Campus, Agricultural University of Hebei from March to August in 2018. A total of 612 fish were used for the experiment sourced from the Huanghua Tilapia National Breeding Farm in Cangzhou, Hebei Province, China, with an average body weight of 95.2±4.3g and an average body length of 15.1±0.21cm. They were healthy, and without obvious injury. The experimental fish were reared in indoors for more than 7 days before the experiment with 24 plastic culture tanks (90cm×75cm×60cm). During the acclimation, sufficient O2 (≥6.5mg/L), relatively constant pH (7.11-7.32) and water temperature (21.0±1.0℃) were maintained by the air pump and temperature controller. The fish were fed twice a day at 8:00 AM and 6:00 PM with expanded compound feed (Tangshan Sanfu Feed Co., LTD., protein ≥33%, fiber ≤8%, fat ≥5%, moisture ≤13%, calcium 0.5-1.5%, total phosphorus ≥1%, lysine ≥1.6%, ash ratio ≤14%). Natural light was provided in the laboratory room.
Experimental design
Effects of Mn2+ on blood and physiological indexes of juvenile GIFT tilapia
The 240 fish were placed in 12 plastic culture tanks (90cm×75cm ×60cm) with different levels of Mn2+ solution and the solution of original Mn2+ concentration in 1.0 mg/mL was prepared using analytical reagent MnCl2. The test concentration was determined based on the preliminary experiment’s 96h LC50 value for MnCl2. Four experimental groups, consisting of MnCl2 of 0mg/l, 0.1mg/l, 0.5mg/l and 1mg/l, respectively, were set up with each group having twelve parallel replicates. Fish samples from each Mn2+ level group were randomly collected at 24h, 48h, and 96h intervals.
Effects of different flow speeds on blood and physiological indexes of juvenile GIFT tilapia
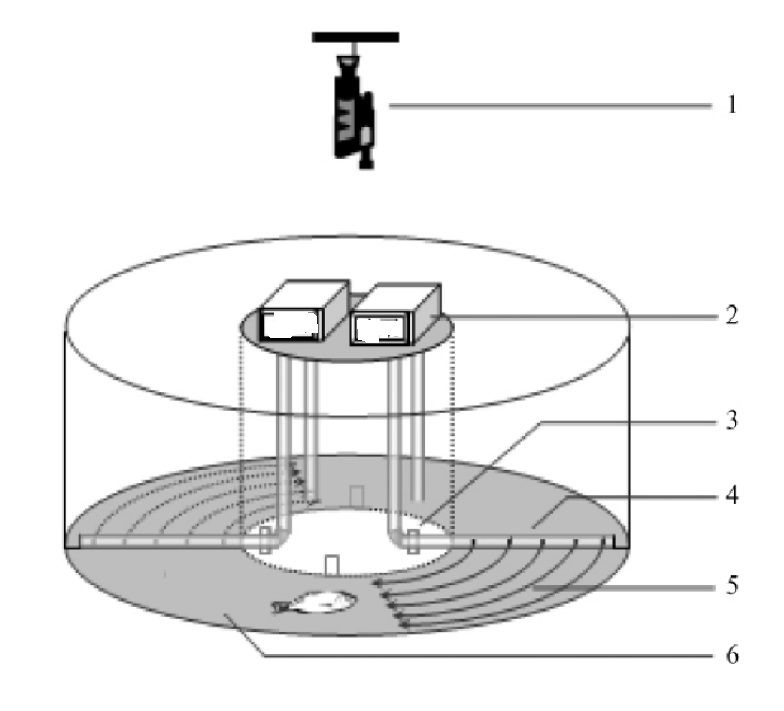
Nine self-circulating fish-locomotion testing tanks were used for this experiment (Figure 1,inner diameter 110cm, outer diameter 150cm). Each tank was symmetrically equipped with two submersible pumps featuring adjustable speeds, which was connected with a spray head on both the left and right sides of the annular channel. The flow speed could be regulated by the frequency changer and it could be measured by the current meter (Australian Unidata M6526c). The water spray of opposite direction in the annular channel, creating a circulation channel. The two flow speed groups (0.15m/s, 0.30m/s) were converted into body length/second (1BL/s, 2BL/s), and the control group (0 BL/s, static water). For each flow speed condition, three replicate groups were set up, with 18 fish allocated to each group. The water source was adequately provided and 1/3 of which was replaced daily to maintain a sufficient level of dissolved oxygen (≧6 mgO2/L). During the experiment, the fish were fed the same diet (expanded compound pelleted feed , Tangshan Sanfu Feed Co., LTD)at 8 AM and 6 PM daily until satiety was achieved, followed by removal of any remaining expanded compound pelleted feed after 0.5 hour. The water pump was halted for 0.5h before and after feeding. The experiment duration was set to 30d, and the fish were sampled at 8:00 AM on the first day of flow speed treatment (1d), 7d , and the end of the experiment (30d). Three samples were randomly selected from each parallel group. Other experimental conditions were maintained including sufficient O2 (≥6.5mg/L), pH (7.11-7.32) and water temperature (21.01.0℃).

Blood indexes
The fish blood was collected from the caudal artery of the fish using a syringe impregnated with heparin sodium, and the red blood cells (RBC)and white blood cells (WBC) were quantified by staining dilution method. The hemoglobin content was measured with the hemoglobin colorimeter by colorimetry.8 Each blood sample was analyzed in triplicate and the results were averaged. The number of blood cells was determined rapidly through manual counting, with corrections made for instrument error. The procedure is as follows: Red blood cell counting: the blood was diluted with a cell dilution and then counted by blood cell count box and the microscope. White blood cell count: 20 μL of blood was added to a centrifuge tube containing 380 μL white blood cell dilution. After all the red blood cells were dissolved, the white blood cell suspension was absorbed, and the total white blood cells were counted using a blood cell count box under a microscope. The number of white blood cell of ten visual fields were counted per fish sample.
Antioxidant enzymes and the lipid oxidation products indicator
The fish were dissected following blood collection, and their liver tissue were subsequently removed and stored at 4℃. 0.5g of the liver tissue was placed into a 20ml grinder and homogenized with 5ml of distilled water to obtain 10% homogenate at 4℃. The samples were then centrifuged at a speed of 3000r/min for 10-15min, and the resulting supernatant were collected in a the measuring tube for subsequent index measurement. Two antioxidant enzymes including superoxide dismutase (SOD), catalase (CAT) and a lipid oxidation products index such as malondialdehyde (MDA), were determined with the kit (Jiengcheng Bioengineering Institute in Nanjing). The TBA method was employed for MDA determination. The ammonium molybdate color determination was used for CAT analysis, and the hydroxylamine method was applied for SOD measurement.9
Determination of protein content
The Bradford method (Coomassie Blue Staining method) was used to determine the protein content of fish liver tissue using a kit obtained from Jiancheng Bioengineering Institute in Nanjing). The specific determination procedure followed the instructions provided by the manufacturer.
Data Processing
The data were calculated using EXCEL and statistically analyzed using SPSS 19.0. The experimental data were presented as mean±SD, and differences among the experimental groups were analyzed using ONE-WAY ANOVA. The significance level for this experiment was set at P<0.05, and Duncan’s multiple comparison test was conducted on the data from each group.
Results
As presented in Table 1, the alteration trend of tilapia hemoglobin and RBC following Mn2+ treatment exhibits similarity. The control group (0mg/L) manifested the highest value of hemoglobin and RBC at three sampling periods. The levels of the two parameters, hemoglobin and RBC, significantly decreased as the concentration of Mn2+ increased (P<0.05). A similar significant decrease in the two indices above was observed at 0.1mg/L, 0.5mg/L, and 1mg/L concentrations of Mn2+ over time(P<0.05). The changes in WBC of juvenile tilapia after Mn2+ treatment differed from the aforementioned indices at the same Mn2+ concentration except for the control group (0mg/L). The control group (0mg/L) exhibited the lowest number of WBC, which showed a significant increase with rising Mn2+ concentration (P<0.05). Moreover, all groups exhibited peak levels of WBC at 0.5mg/L. At the same concentration, the number of WBCs in tilapia reached its highest point at 48 hours and subsequently declined.
Table 2 illustrated the changes in tilapia’s liver catalase (CAT) activity following Mn2+ treatment. The CAT activity initially increased and then decreased with increasing Mn2+ level. Within the same treatment duration, the CAT activity exhibited its highest levels in the 0.5mg/L group at both 24h and 48h samplings, while reaching its peak in the 1mg/L treatment group at 96h other groups at 24h(P<0.05). The data from the 0mg/L group showed a non-significant increase over exposure time (P>0.05), all three Mn2+ treatment groups all showed a significant decline in CAT enzyme activity over time(P<0.05), reaching its peak at 24h and showing no significant difference between 48h and 96h.
The 0.1mg/L group exhibited the highest SOD activities at both 24h-sampling and 48h-sampling ,while the 0.5mg/L group demonstrated maximum SOD activity at the 96h sampling within the same Mn2+ level treatment duration. The SOD activity of the 1mg/L group was significantly lower than that of other Mn2 level groups (P<0.05) during the 24h sampling period. No significant difference was observed between the 0.1mg/L group and control group at the 48-hour sampling duration. However, the two groups was significantly higher than the other two groups (0.5,1 mg/L) (P<0.05). At the 96h-sampling period, no significant difference was observed between the control group and the 0.1mg/L group (P>0.05). However, the two groups exhibited significantly lower values compared to those treated with higher concentrations of Mn2+ (0.5 ,1mg/L). Notably, while the control group and those treated with 0.1mg/L and 0.5mg/L showed a decrease over time under similar treatment conditions, the group exposed to 1mg/L demonstrated a significant increase as time progressed. During the Mn2+ level treatment period, the fish samples collected at 24hs, 48hs and 96hs showed an initial increase followed by a subsequent decline in MDA levels as Mn2+ level increased (P<0.05), with the highest value observed in the group treated with 0.5mg/L. After receiving the same Mn2+ concentrations treatment, both the control and experimental groups initially exhibited an elevation in MDA levels before gradually declining over time. The peak levels were observed at 48 hour of sampling, followed by a subsequent decrease in levels.
As shown in Table 3,The changes in blood parameters of tilapia at different flow speeds were presented. Compared to the control group in static water (0 BL/s group), the hemoglobin and RBC levels of tilapia at flow speeds for 1d and 7d showed an non-significant increasing trend during the experimental period(P>0.05). However, both hemoglobin and RBC levels of fish were significantly elevated (P<0.05) in fish exposed to two different flow speeds compared with 0 BL/s group in 30d. Notably, the highest values were observed at 2.0BL /s group(8.8±0.37g/100ml). Except for the control group(0 BL/s group), both hemoglobin and RBC levels in tilapia increased significantly with exposure time in the two flow speed groups. Meanwhile, there were no significant changes in WBC levels observed in tilapia with increasing flow speed at 1d, 7d, and 30d.Furthermore, there were no significant differences among all the groups categorized by flow speed (P>0.05).Additionally, there were no significant differences observed in WBC level of three sampling-duration (1,7,30d) in all flow speed groups (P>0.05). As shown in Table 4, the results showed that the activity of CAT, SOD and the level of MDA exhibited a positive correlation with flow speed, reaching their maximum levels at 2 BL/s. Both the 1 BL/s and 2 BL/s groups showed significantly higher antioxidant indexes than the 0 BL/s group (P<0.05). Furthermore, these three parameters remained stable over time (P>0.05).
Discussion
Effects of Mn2+ on blood and physiological indexes of GIFT tilapia
The utilization of blood tests was prevalent in medical diagnoses for human and aquatic animals. The biochemical indicators in fish blood systems could be influenced by a variety of biological and abiotic factors.10 For example, red blood cell(RBC) number and hemoglobin content in fish were closely linked to the supply and demand of oxygen within their bodies.11 White blood cell (WBC) served as immune cells in the bloodstream of fish, capable of consuming external pathogens and producing antibodies.12 Mn2+ were essential metal ions in numerous biological physiological processes. They regulated a series of manganese ion catalytic enzymes and play a crucial regulatory role in various life processes, including hematopoiesis, enzyme components, promotion of fat oxidation and so on.2,3,13–15The findings of the current study indicated that low levels of manganese ions (0.1-0.5mg/kg) could stimulate WBC production in tilapia, whereas higher levels (≧1mg/kg) might potentially reduce the WBC number, suggesting that an optimal concentration of Mn2+ was advantageous for enhancing immune function. Moreover, prolonged exposure to Mn2+ could result in heightened impairment of fish immune function. The observed data for RBC and hemoglobin were consistent not with those reported for copper and lead ion in hybrid sturgeon8 and goldfish.16 The aforementioned study demonstrated that heavy metal ions at concentrations of 0.1 and 0.5 mg/kg can significantly enhance RBC number in fish. One possible explanation for this phenomenon might be attributed to variations in the tolerance of experimental fish towards heavy metals, the other reason was that the longer the Mn2+ treatment time, the higher the concentration, resulting in an increased accumulation of heavy metals in tilapia bodies, thereby impeding normal physiological and ecological processes in fish. The aforementioned phenomenon led to a more pronounced elevation in toxicity levels , which impaired the behavior ability and oxygen consumption of fish, Consequently, there was a continuously lower red blood cell count and hemoglobin content.16
The heavy metals had a significant impact on the antioxidant enzyme and the lipid oxidation products index in aquatic animals.17 The excessive production of reactive oxygen species was the primary cause of manganese ion toxicity in aquatic animals, resulting in oxidative damage. However, living organisms possess an antioxidant enzyme system that can effectively eliminate such damage. CAT and SOD are widely distributed antioxidant enzymes with defensive functions in organisms. MDA is one of the final products of polyunsaturated fatty acids peroxidation in the cells and also an oxidative stress indicator which serves as one of the main secondary products of lipid oxidation and could affect the protein structure and function by covalent cross-linking with proteins.9 The activity of CAT, SOD and the level of MDA in fish serum were significantly influenced by external environmental factors, such as temperature, salinity, bait, heavy metal concentration, and other factors.6,12,17–20 This study demonstrated that manganese ions have a remarkable impact on the activity of CAT, SOD and the level of MDA in tilapia serum. Specifically, the activity of CAT and SOD exhibited a positive correlation with increasing concentrations of manganese ions, but declined once the concentration surpassed a certain threshold. However, prolonged exposure to manganese ions at the same concentration level leads to altered effects, indicating an escalating degree of harm inflicted upon fish.Previous studies on copper stress in Cyprinus Carpio18and GIFT tilapia6 had shown that these species exhibited a pattern of inducing at low concentrations and inhibiting enzyme activity at high concentrations, commonly referred to as hormesis in most toxicology researches.4,5,21 The observed phenomenon exhibited an adaptive response characterized by a biphasic dose-response curve, with low doses demonstrating a stimulatory effect and high doses exhibiting an inhibitory effect. In this study, the same phenomenon for manganese ion treatment was observed in the number of WBC , the activity of SOD,CAT and level of MDA of tilapia. These findings suggested that low concentrations of manganese ions may enhance the immune potential of tilapia, while high concentrations could impede its immune and antioxidant functions, thereby exerting a significant toxicity stimulation effect.
Effects of flow speed on blood and physiological indexes of Tilapia
Water flow speed, as a critical environmental factor for fish survival, could induce various movement modes and corresponding physiological mechanisms. It mainly affected the fish swimming movement on culture conditions.12,22 The blood index of swimming fish could be utilized to explain the physiological conditions of swimming fish, and its change was closely associated with the intensity of swimming behaviour.23,24 After high intensity exercise, adrenaline of fish blood enhances nerve activity, leading to an increase in catecholamine levels and a more pronounced muscle vasodilation. The vigorous activity of fish required more oxygen intake, and prolonged exercise would further enhance the oxygen carrying of blood system. The study revealed a positive correlation between water flow speed and the levels of red blood cells and hemoglobin content in tilapia. Moreover, as the stimulus time increased, both indexes exhibited a gradual rise. The increase of its index levels at high flow speed indicated that a significant enhancement in the oxygenation capacity and metabolic level of fish blood, leading to vigorous respiratory metabolism in fish. To ensure sufficient oxygen supply, the blood composition of the fish body changed accordingly, leading to a significant increase in the blood cell indicators related to oxygen transport, such as hemoglobin and RBC.22 The impact of flow speed on WBCs was not noticeable and it suggested that the hydrodynamic stimulation was insufficient to induce significant alterations in immune system parameters such as the number of WBCs. The activity of SOD, CAT and the level of MDA played a crucial role as protective antioxidants by eliminating oxygen-free radicals from the body.25,26 The study of the results indicated that different flow speeds depended on the levels of these three physiological indexes in fish. As water flow speed increases, so do the activity of CAT, SOD, and the level of MDA in serum. The optimal flow speed and additional exercise could be considered as contributing factors to the promotion of fish metabolism, inducing the fish body to produce excessive reactive oxygen species and the corresponding activation of antioxidant enzyme system in organisms, thereby eliminating reactive oxygen species damage.9,12,23 However, the above three physiological indexes did not change significantly over time, indicating that the fish had adapted to the influence of the corresponding water flow.
Acknowledgments
This work was supported by the Natural Science Foundation of Hunan Province (Grant No.2020JJ4446)
The authors declare no conflict of interest.
Author Contribution per CRediT
Conceptualization: Bolan Song (Lead). Methodology: Bolan Song (Lead). Writing – original draft: Bolan Song (Equal), Luqi Zhao (Equal). Writing – review & editing: Bolan Song (Lead). Funding acquisition: Bolan Song (Lead). Supervision: Bolan Song (Lead). Formal Analysis: Luqi Zhao (Lead). Investigation: Luqi Zhao (Lead). Resources: Luqi Zhao (Lead).