Introduction
The black rockfish Sebastes schlegelii is a viviparous marine teleost species with significant economic value. It is considered a tasty seafood with high market value and additional recreational value.1 This fish is distributed along the Northwestern Pacific Ocean, especially in the Yellow Sea, Bohai Sea, the South Sea of Korea, and the coastal areas of Japan.2 Overfishing has decimated the natural resources of S. schlegelii in recent years, and programs aimed at enhancing fish stock have been initiated. However, fish used for stock enhancement are generally artificially bred. Artificially bred fish reduce the pressure of natural selection and produce individuals better suited to artificial conditions than the natural environment.3
Moreover, the number of parents in cultured fish is generally small, and inbreeding and genetic drift can lead to a decrease in genetic diversity, so fish proliferation tends to produce juveniles with lower levels of genetic diversity.4,5 In addition, interbreeding of domestic fish with wild populations also occurs,6 which may compromise the evolutionary integrity of wild populations.7 For example, non-native gene introgression has been detected in Spanish Atlantic salmon due to restocking.8 Therefore, it is necessary to study the genetic characteristics of S. schlegelii in northern China to preserve and utilize germplasm resources.
Population genetic diversity is the basis of biodiversity and a measure of species’ evolutionary potential. Understanding the genetic structure of populations is conducive to developing targeted conservation measures and the realization of the recovery potential of species.9 Previous studies have explored the genetic diversity of the black rockfish from a total of 21 populations in China, Japan, and Korea using mitochondrial DNA and AFLP techniques, and the results showed that no genetic divergence among different geographic populations.2,10 Some studies have reported no significant decrease in the number of hatchery-released stock, low but significant differentiation between the hatchery-released and wild stocks, as well as the wild stock before enhancement and the mixed stock after enhancement in Lidao Bay, Shandong peninsula been no release of S. schlegelii in the Liaodong peninsula before 2019.11 Someone reported that the genetic patterns of S. schlegelii stocks from the same habitat were evaluated before and after artificial stocking. The S. schlegelii population maintained high genetic diversity and showed weak genetic differentiation, but potential genetic introgression derived from stock enhancement should be considered.1 However, no studies assessing the genetic diversity of black rockfish populations are based on genome-wide variation information.
As one of the most effective methods for single-nucleotide polymorphism (SNP) identification, restriction-site associated DNA (RAD) sequencing has been widely used in population genetic studies of aquatic animals.9 2b-RAD has the simplicity and flexibility to provide genome-wide genotyping information.12 Previous studies have analyzed the genetic structure, genetic diversity, and genetic relationships of populations using the 2b-RAD technique, such as Chlamys farreri, Thunnus albacares and macaques, and the results showed that it can obtain more markers quickly and comprehensively and has higher typing accuracy so that the technique can be better applied in the genetic diversity analysis of populations.12–15 Meanwhile, 2b-RAD technology is more suitable for species sequencing without a reference genome. It is one of the most effective and low-cost methods for developing SNP in non-model organisms, especially aquatic ones.16 Therefore, 2b-RAD sequencing technology can be applied to improve the study of the genetic diversity of aquatic biological resources.
Therefore, this study analyzed the genetic diversity and assessed the status of germplasm resources in six wild and one cultured populations of S. schlegelii based on genome-wide SNP discovery using 2b-RAD sequencing technology. The results of this study are of great significance for the protection and scientific utilization of the S. schlegelii germplasm and breeding program.
Materials and Methods
Fish
Six wild populations of S. schlegelii were sampled from Yingkou (YK) in Liaoning Province (43°33′20″N, 122°2′23″E, 30 individuals), Beidaihe (BDH) in Hebei Province (39°50′52″N, 119°32′42″E, 29 individuals), Changdao (CDYS) in Shandong Province (38°1′48″N, 120°43′23″E, 12 individuals), Weihai (WH) in Shandong Province (37°38′36″N, 122°8′38″E, 30 individuals), Qingdao (QD) in Shandong Province (36°18′2″N, 120°43′6″E, 30 individuals) and Lianyungang (LYG) in Jiangsu Province (34°50′4″N, 119°37′2″E, 30 individuals), and the cultured population was sampled from Changdao Enhancement and Experiment Station, Chinese Academy of Fishery Science (CDYZ) in Shandong Province (37°57′28″N, 120°44′25″E, 30 individuals), respectively. Particularly, the cultured population CDYZ is the third generation of wild parents collected from Changdao in 2018. The fins of all 191 individuals were excised into one piece, preserved in anhydrous ethanol, and stored at -80 °C. Genomic DNA was extracted using the ammonium acetate method,17 and the concentration and quality of DNA were analyzed using NanoDrop spectrophotometric and agarose gel electrophoresis. The high-quality DNA samples were then stored at −80 ℃ for further use.
2b-RAD Library Preparation and Sequencing
According to the previous studies,18 the sequencing libraries were constructed using 2b-RAD five-label tandem technology. Briefly, the genomic DNAs were digested by the type IIB restriction enzyme BsaXI, and five different sets of adaptors and T4 DNA ligase were added to the cleavage products. The ligation reaction was amplified via PCR, in which the five tags were sequentially linked in series. Then, the barcode sequences were added to the ligated product. Products with different barcode numbers were purified using a MinElute PCR Purification Kit and pooled for sequencing using the Illumina NovaSeq PE150 sequencing platform from Qingdao OE Biotech Co., Ltd (Qingdao, China).
SNP Discovery and Genotyping
Raw reads were spliced using Pear software,19 and the raw sequencing data were filtered. Specifically, reads containing more than 8% of N bases and bases with quality values lower than Q30 were filtered for more than 15% of the total bases in the reads. And the sequenced reads without enzyme recognition sites were then removed to generate high-quality sequences. Clean Reads were compared to the reference genome sequence using SOAP20 software, and finally all SNP markers were typed by the maximum likelihood method (ML). Then, the SNPs obtained from the seven populations were further filtered for high-quality SNPs, which excluded mutant alleles, loci with N genomic bases, loci with more than two SNPs in one tag, loci with two typing loci at the same position, loci with less than 80% of individuals being typable in all samples, loci with an MAF less than 0.01, and loci with alleles greater than 2 were excluded.
Calculation of Genetic Parameters
Hardy–Weinberg equilibrium p-value (HW-P), expected heterozygosity (He), observed heterozygosity (Ho), the effective number of alleles (Ne), inbreeding coefficient (Fis), and nucleotide diversity (Pi) were calculated using VCFtools software.21 The polymorphism information content (PIC) was calculated according to the formula from previous research.22 The fixation index (Fst) between populations was calculated with R package StAMPP. The Reynolds’ genetic distance (DR) and gene flow (Nm) between populations were estimated based on Fst between populations with the formulas DR = -ln (l-Fst) and Nm = (l-Fst)/4Fst.
Analysis of Population Genetic Structure
The neighbor-joining method was used to construct the evolutionary tree, and the distance matrix (p-distance) was calculated using TreeBest software.23 The reliability of the evolutionary tree was checked by Bootstrap (1000 repetitions). Principal component analysis (PCA) was performed using GCTA software to obtain the two most influential eigenvectors.24
Data Availability
All sequencing data was deposited in the SRA database under the BioProject ID: PRJNA1042875. Relevant supporting data can be found within the article and additional files.
Results
Sequencing Data
191 S. schlegelii individuals from seven populations were sequenced using 2b-RAD method. 1,304,176,496 raw reads were obtained, and the average number of sequences per sample was 6,828,149. After the screening, 1,186,018,785 high-quality reads were obtained, with the percentage of high-quality reads greater than 91%, indicating that the sequencing quality of the library was good. A total of 47,677,335 unique tags were obtained, with an average number of 249,620 per sample, and the average sequencing depth of tags was 17.90 (Table S1).
SNP Mutation Type Analysis
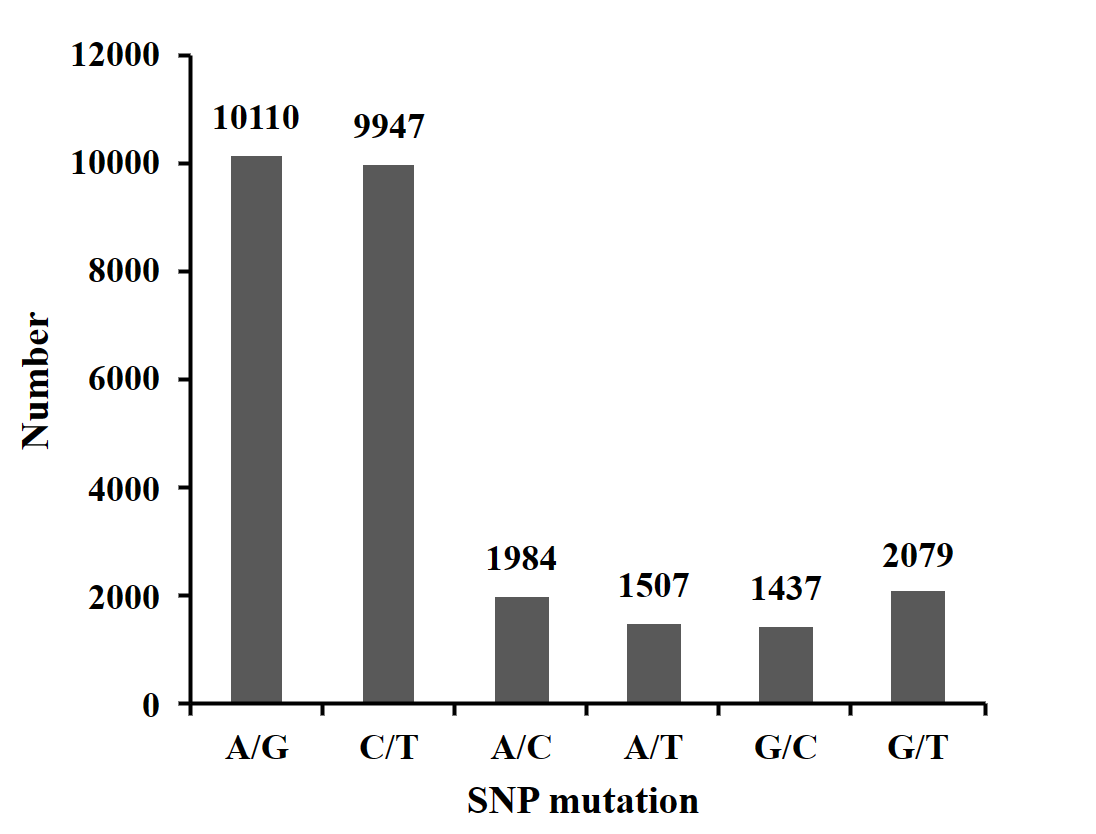
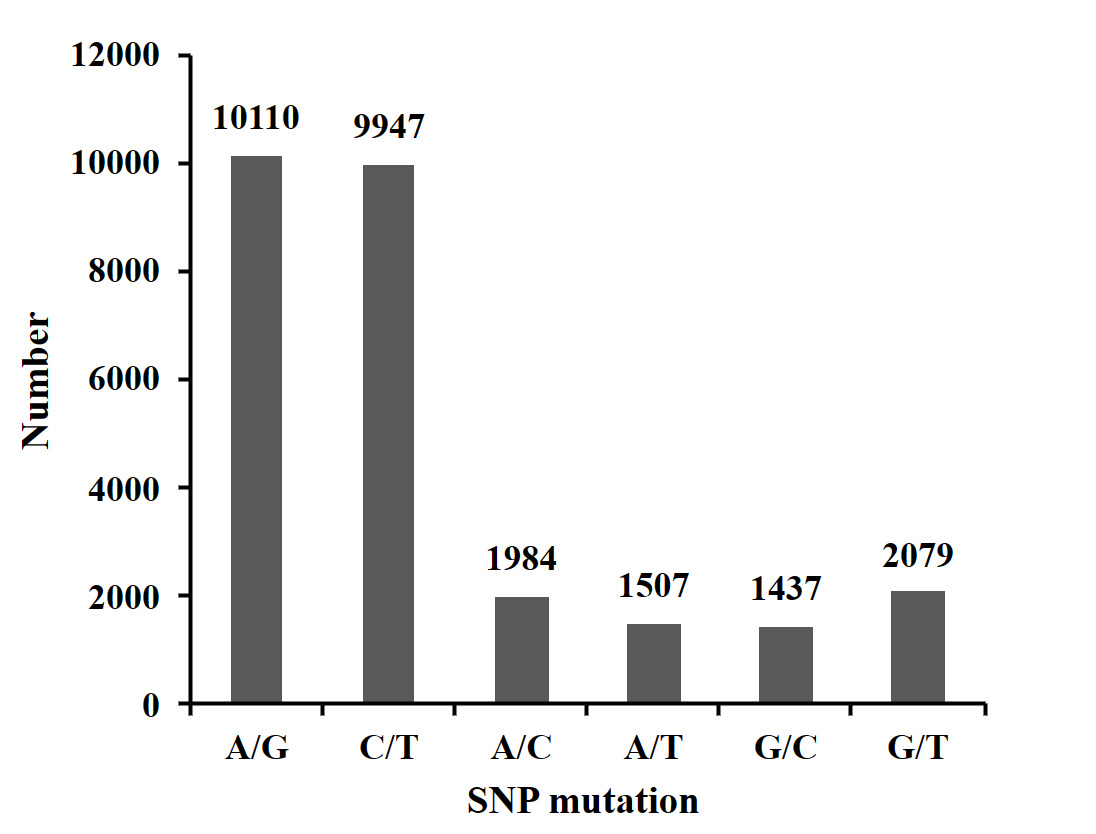
The clean reads obtained from each sample were sequenced and aligned with the reference genome using SOAP software. A total of 27,064 SNPs were generated after quality filtering. The SNP base substitution was divided into transition (TS) and transversion (TV). The transition occurs between A and G (A/G) or C and T (C/T), and the transversion occurs between A and C (A/C), A and T (A/T), G and C (G/C), and G and T (G/T). The most numerous transformation type, accounting for 74.11% (37.36% A/G and 36.75% C/T) of all base mutation types. The inversion type was the least numerous, accounting for 25.89% (7.33% A/C, 5.57% A/T, 5.31% G/C, and 7.68% G/T)) of all base mutation types. The ratio of transition to transversion (TS/TV) in SNPs was 2.86 (Figure 1).
Genetic Diversity Analysis
The 27,064 generated SNPs were used for genetic diversity analysis. The HW-P values of the seven populations ranged from 0.674 (CDYZ) to 0.841 (CDYS). The Hardy–Weinberg equilibrium test showed that all the HW-P values were greater than 0.05, indicating that all sampled populations of S. schlegelii conform to the genetic balance theorem (Table 1). The Ho ranged from 0.174 (BDH) to 0.273 (CDYZ), the He ranged from 0.173 (WH) to 0.234 (CDYZ), and the Pi ranged from 0.176 (WH) to 0.239 (CDYS). The PIC values of all groups were less than 0.25, indicating that all populations had a low level of polymorphism. The Ne ranged from 1.260 (WH) to 1.373 (CDYZ). The average Fis was -0.069, -0.007, 0.024, 0.004, 0.017, 0.018 and 0.024 in CDYZ, QD, CDYS, YK, LYG, WH and BDH, respectively. The lower genetic diversity of seven populations indicated that they all exhibited varying degrees of germplasm degradation.
Genetic Differentiation Analysis
The Fst of the seven populations ranged from 0.0009 to 0.1053, and the DR ranged from 0.0341 to 0.1053 (Table 2). The genetic differentiation was moderate between CDYZ and the six wild populations (0.05 < Fst < 0.25). However, the genetic differentiation was low among other populations (Fst < 0.05). Similarly, in terms of DR, it was highest between QD and CDYZ populations at 0.1113 and lowest between WH and LYG populations at 0.0009.
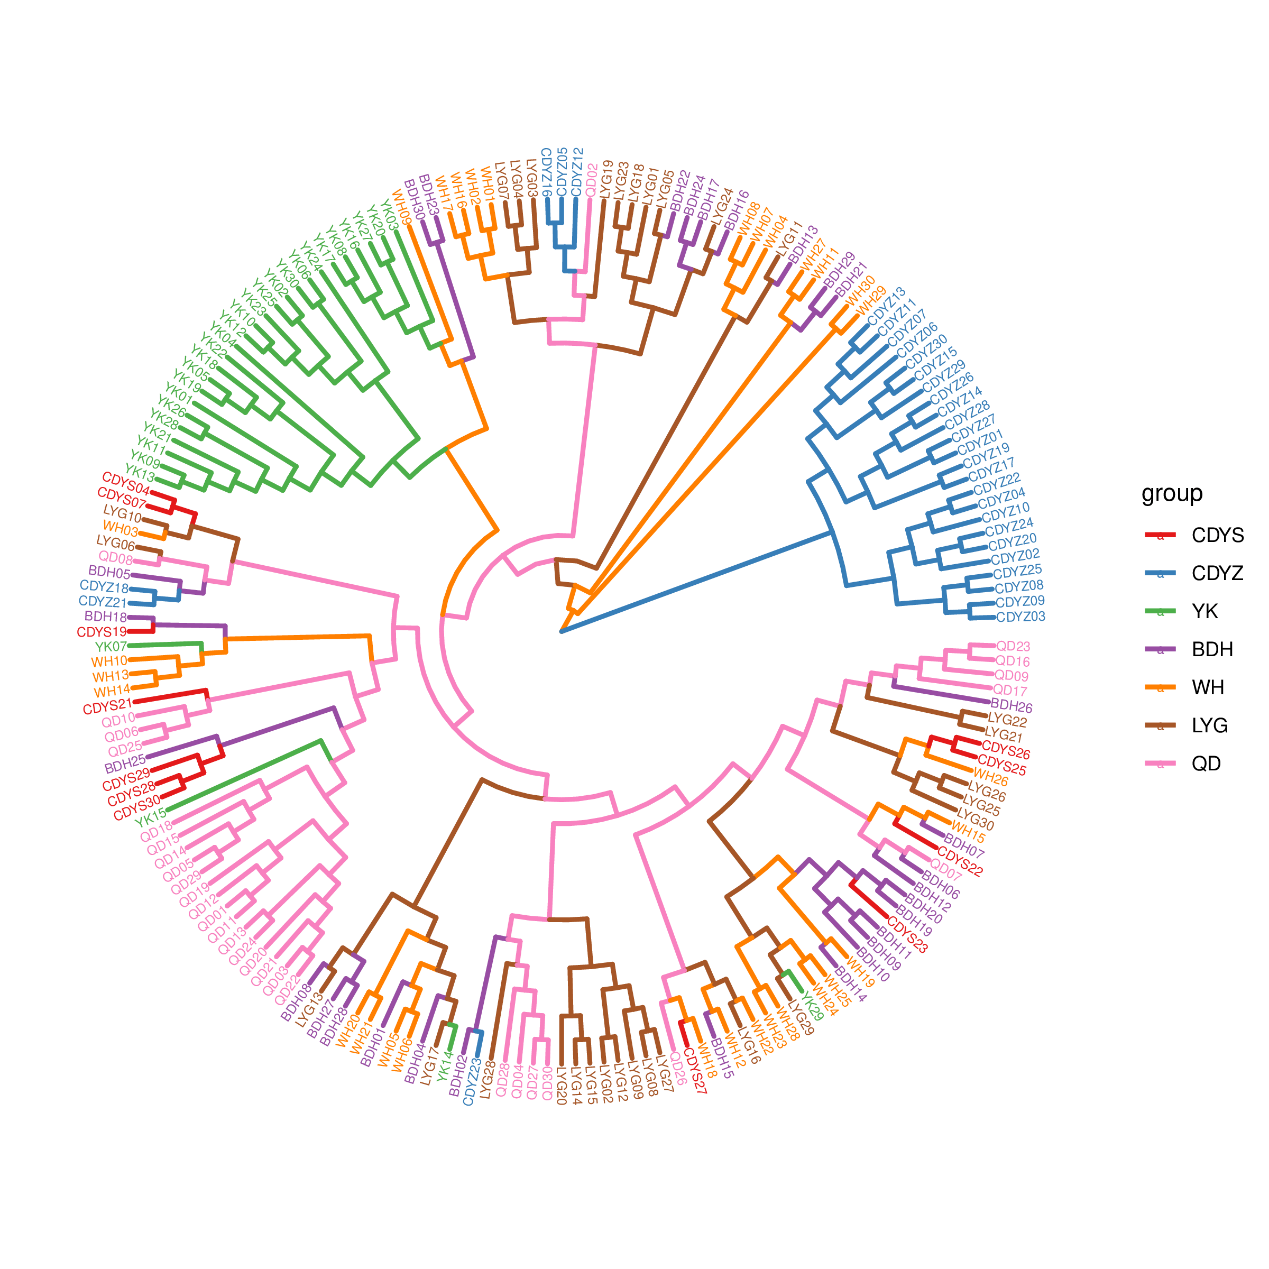
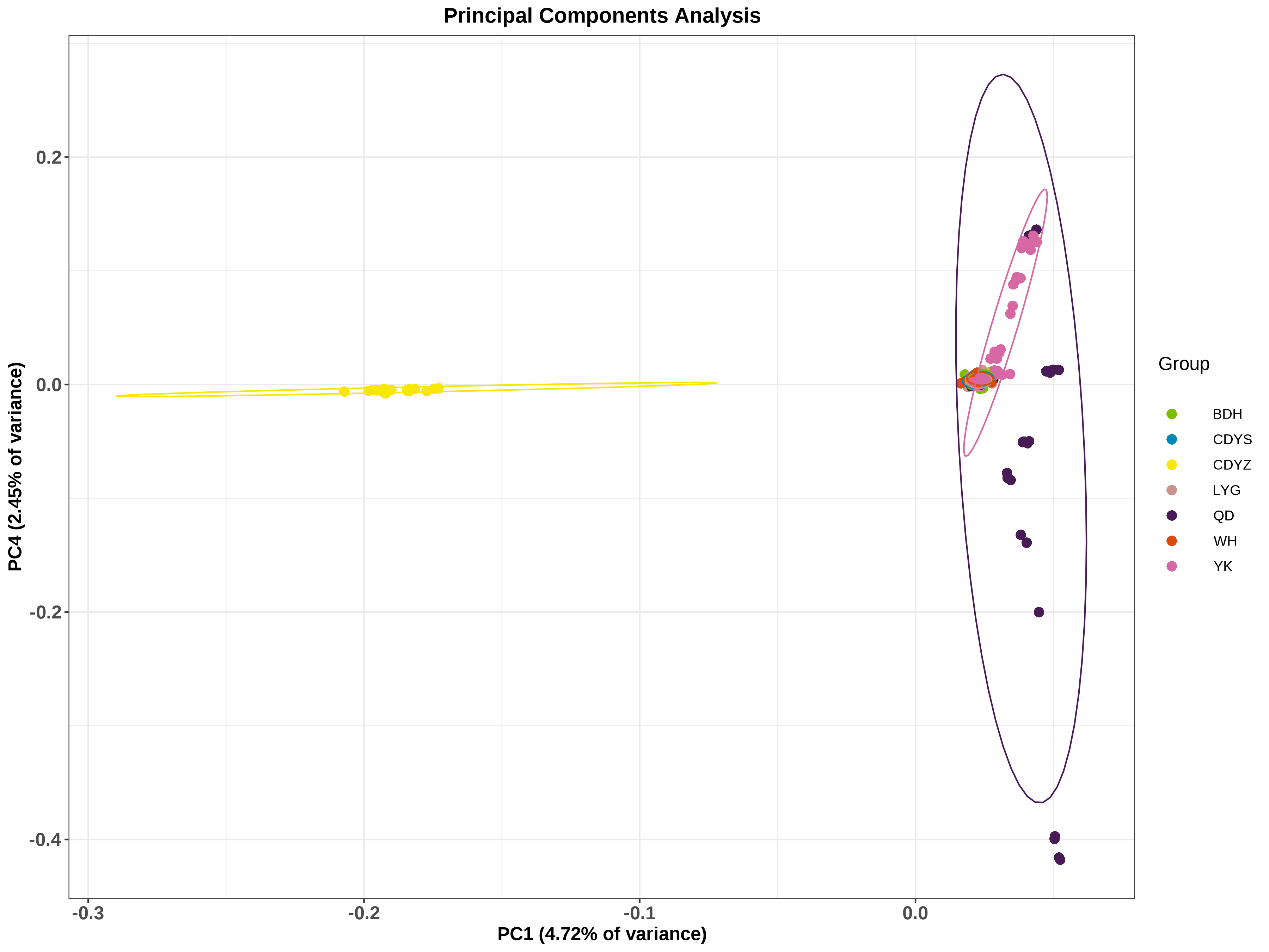
The neighbor-joining tree of all individuals was constructed based on SNPs obtained from 2b-RAD sequencing. As seen in Figure 2, those wild populations clustered together first and finally with the cultured population CDYZ, which clustered separately except for one individual. The wild populations YK and QD were clustered separately and finally dramatized on a single branch with the other four wild populations. The results of the PCA (Figure 3) indicate that the wild populations QD, CDYS, BDH, YK, WH, and LYG were clustered into an area, indicating that they most likely came from a common ancestor. In contrast, the cultured population CDYZ was distributed in a separate area, indicating that it is relatively distantly related to the six wild populations.


Population Gene Flow Analysis
The Nm among the populations ranged from 2.1242 to 249.7500 (Table 3). The Nm between the wild populations BDH and WH was 249.7500, the highest level among the populations. Gene flow between the cultured and wild populations ranged from 2.1242 to 2.5974. The Nm between the wild populations was greater than 4, which is infinite.
Discussion
Animal populations of large mammals, reptiles, and fish living in the ocean have been threatened with serious losses over the past 50 years.25 The release of hatchery-reared juveniles could increase the biomass of marine fisheries, contributing to the recovery of fish stocks, and has been conducted in many countries. However, numerous studies have shown that large-scale releases of hatchery individuals into the wild can negatively affect the genetic diversity of wild populations.26 Studies on genetic diversity can provide a useful basis for developing strategies related to the conservation and rational use of natural resources.27 The analysis of genetic diversity among cultured and wild populations in this study provides important information for the conservation of the germplasm resources of S. schlegelii and the development of farming.
In this study, the ratio of transitions and transversions (Ts/Tv) is 2.86, which is much larger than the theoretical probability ratio of Ts/Tv of 0.5, which is called “transition bias”.28 Previous studies show great differences in the ratio of transitions and transversion between different species. The ratio of transition to transversion of 2b-RAD in C. nasus and Fenneropenaeus chinensis was 1.237 and 1.402, respectively.11,16 The ratio of transition to transversion in the sequencing of Pinctada fucata and abalone was 0.5 and 2.33, respectively.29,30 In summary, the transition bias was due to the differences in the habitats of the populations as well as the differences in evolutionary and selective pressures.31
Important indicators of genetic diversity, including the He, Ho, PIC, Ne, Pi, and Fis, are used to assess genetic diversity in populations. In this study, based on Ho and He, the genetic diversity level of the seven populations was low, and based on the PIC value (less than 0.25), the seven populations showed low polymorphism. The Ho (0.174-0.273) was higher than He (0.173-0.234) in seven populations, indicating that the seven populations may be mixed with others and need further purification. Additionally, previous studies have reported the genetic diversity of S. schlegelii used to microsatellite DNA loci,1,32 that the Ho, He, and PIC was much higher than this study. Recent studies have explored the genetic diversity of the black rockfish from a total of three populations in northern China using mtDNA loop analysis, and the results showed no significant genetic differentiation and low genetic differentiation.33 These results indicate that the wild and cultured populations in this study may have been degraded to varying degrees, and effective protection of wild germplasm and supplementation of cultured populations are urgently needed. The Fis of five wild populations (0.004-0.024) were all positive, and the other two populations (-0.007, -0.069) were all minus, suggesting that the degree of inbreeding was low levels. Previous research reported the presence of multiple paternity in this species in the wild, which may explain the lower degree of inbreeding.34 This is considered an adaptive mechanism to alleviate the constraints of limited individual exchange caused by short-distance migrations, which suggests that hatchery-reared fish can maintain a high level of genetic diversity.1
The Fst and DR are essential parameters to measure the degree of genetic differentiation among populations.35 In this study, the cultured population CDYZ showed moderate differentiation from the six wild populations, while the six wild populations showed low differentiation. Combined with the results of the phylogenetic tree and PCA analysis, we believed that the wild populations QD, CDYS, YK, LYG, WH, and BDH were from the same ancestral population. In contrast, the cultured population CDYZ was a separate lineage. YK and QD populations were clustered separately and finally dramatized on a single branch with the other four populations. YK is located in Liaodong Bay of the Bohai Sea, far from other sampling points. The black rockfish do not have long-distance migrations in their life history.2
The stock enhancement program for the black rockfish did not begin until after 2019 in Liaoning Province.1 Qingdao (QD), as a tourist city, has relatively little aquaculture and fishing. The above may be the reason why QD and YK are clustered separately. The cultured population CDYZ is the third generation of wild parents collected from Changdao in 2018. The CDYZ population is a selection of individuals with superior traits based on the breeding program and represents the genetic diversity of the next generation of the population. This result further indicates that the breeding programs and germplasm conservation is scientific. The gene flow coefficient Nm reflects the communication between populations.
Nm greater than 4 indicates that each population is a large random unit, and Nm greater than 1 indicates some gene flow between populations. Nm less than 1 indicates that populations are isolated.36 In this study, all values of Nm are greater than 1, indicating some gene exchange between all the populations. Gene flow between the cultured and wild populations ranged from 2.1242 to 2.5974. The results indicate that there was some gene exchange. The Nm between the wild populations was greater than 4, which is infinite, indicating that the wild populations form a random unit. In recent years, juvenile fish have sometimes been purchased from other areas for regional stock enhancement programs, which undoubtedly leads to gene flow between populations. Therefore, S. schlegelii can be released through proper breeding. The germplasm source should be strictly controlled for artificial breeding and breeding, and the original species should be introduced instead of indirect introduction.
In summary, compared to the data from five years ago,1,32 the genetic diversity of the black rockfish is considerably lower. Accordingly, this study puts forward some suggestions to help the protection and utilization of the germplasm resources of the black rockfish, specifically measures to enhance effective protection of aquatic organisms’ habitats such as spawning grounds, bait grounds, and wintering grounds; reduction of fishing and efforts to rehabilitate offshore fishery resources; scientifically carry out stock enhancement programs of the black rockfish; developing scientific breeding programs.
Conclusions
In conclusion, 2b-RAD sequencing technology was applied to evaluate the genetic diversity of S. schlegelii. Genetic diversity reduction and germplasm resource degradation of wild and cultured S. schlegelii were revealed, and even the genetic diversity of the cultured population was higher than that of the wild populations, suggesting that its resource conservation is urgent. This study provides a reference for the conservation of germplasm resources and the restoration of natural resources of the black rockfish.
Acknowledgments
We want to thank the financial support from Agro-ecological Resource Conservation Funding Program (102125231620130000003) and 2022 Yantai Aquatic Seed Industry Enhancement Project-Changdao the black rockfish Germplasm Resources Preservation and Protection Project for their financial support.
Ethics Statement
The animal study was reviewed and approved by the animal care and use committee of Changdao Enhancement and Experiment Station, Chinese Academy of Fishery Science. All animal treatment protocols were performed in accordance with Chinese laws, regulations, and ethics.
Authors’ Contribution
Data curation: Wei Cao (Equal), Mingyi Zhang (Equal), Yanxin Zheng (Equal). Formal Analysis: Wei Cao (Equal), Mingyi Zhang (Equal). Investigation: Wei Cao (Equal), Mingyi Zhang (Equal), Nan Wu (Equal), Haiying Han (Equal), Rujie Zhong (Equal), Tao Yu (Equal). Methodology: Wei Cao (Equal), Mingyi Zhang (Equal), Yanxin Zheng (Equal). Software: Wei Cao (Equal), Mingyi Zhang (Equal), Yanxin Zheng (Equal). Visualization: Wei Cao (Equal), Mingyi Zhang (Equal), Yanxin Zheng (Equal). Writing – original draft: Wei Cao (Equal), Mingyi Zhang (Equal). Writing – review & editing: Wei Cao (Equal), Mingyi Zhang (Equal), Nan Wu (Equal), Haiying Han (Equal), Rujie Zhong (Equal), Tao Yu (Equal), Xiaomei Wang (Equal), Liqun Ren (Equal), Chunnuan Zhao (Equal), Bo Li (Equal), Yanxin Zheng (Equal). Resources: Mingyi Zhang (Equal), Nan Wu (Equal), Xiaomei Wang (Equal), Liqun Ren (Equal), Chunnuan Zhao (Equal). Supervision: Haiying Han (Equal), Rujie Zhong (Equal), Tao Yu (Equal), Bo Li (Equal), Yanxin Zheng (Equal). Conceptualization: Bo Li (Equal), Yanxin Zheng (Equal). Funding acquisition: Bo Li (Equal), Yanxin Zheng (Equal). Project administration: Bo Li (Equal), Yanxin Zheng (Equal). Validation: Bo Li (Equal), Yanxin Zheng (Equal).