1. Introduction
The large yellow croaker (Larimichthys crocea) is one of the most important economic marine fish species in China.1 In the 1960s, large yellow croakers were abundant and one of the country’s four most important catches. The 1970s saw a rapid decline in the huge yellow croaker fishery due to stick-knocking fishing and extensive human exploitation. The government started promoting the growth of a significant yellow croaker sector in the 1980s. The distribution of the farmed population has far outstripped that of the wild population due to the expansion of the yellow croaker’s culture scale and the increased exchange of fry between different geographic areas, and releasing activities have improved the yellow croaker’s resource base, but have also caused the problems of mixed populations and low genetic diversity.2,3
The population structure of the large yellow croaker has been a hot research topic, and there is still ongoing debate regarding its classification. Different studies using various methods and data analysis may result in different conclusions. In the past, the large yellow croaker was initially categorized into the Daiqu stock (DQ, distributed in the East China Sea), Min-Yuedong stock (MYD, distributed in the eastern South China Sea and Taiwan Strait), and Naozhou stock (NZ, distributed in the west South China Sea) based on morphological and ecological characteristics.4,5 However, more recent research has thrown new perspectives on the population structure of the large yellow croaker. For instance, some scholars have proposed that the large yellow croaker’s entire South China Sea population belongs to a single group based on morphological analysis.6
Furthermore, studies using molecular markers such as SSR and mtDNA have not found significant genetic differences among different geographical populations of the large yellow croaker.7,8 Understanding the population structure of the large yellow croaker is still a matter of contention, primarily due to the use of different analytical approaches and the limitations of the various research methods. While some studies suggest a lack of genetic differentiation and support the idea of a single population in the South China Sea, others have observed certain genetic variations at regional scales, supporting the existence of geographical groups.9 Environmental influences, migration patterns, and population history may contribute to these genetic differences.10In conclusion, the classification of the population structure of the large yellow croaker remains a subject of ongoing debate, and further research is needed to resolve this issue. Understanding the population structure has significant implications for scientific research and conservation efforts, guiding the conservation and sustainable utilization of the large yellow croaker.
Ecological adaptations shaped by natural selection may play an important role in generating new biodiversity, with different habitat environments causing populations to evolve in different patterns.11 Morphological traits are the product of the interaction between genetic and environmental factors and are essential for taxonomy.12 Classification of aquatic animals based on morphological features is the most basic and primitive method, and its external manifestations are mainly morphological proportions and external features.13 The multivariate analysis method has many applications in analyzing and studying morphological differences in fishes.14 Some researchers proposed using discriminant analysis to examine 22 morphological characteristics of adult male blue crabs from three Southeast Asian countries and categorized them into different populations.15 Yang et al. explored whether morphological differences between these geographic populations reached the level of subspecies or species by examining differences in 10 external morphological traits in four Garra orientalis (Cyprinidae) populations.16 He et al. investigated the variation in male and female morphology among wild populations by discriminant analysis.17
In this study, the morphological differences of three wild large yellow croaker populations and four farmed large yellow croaker populations in coastal China were comprehensively compared through four multivariate analysis methods, including one-way analysis of variance, cluster analysis, principal component analysis, and discriminant analysis. The genetic diversity among different populations of large yellow croaker in China was studied on the morphological level to provide a theoretical basis and reference for identifying geographical populations, protecting germplasm resources, and breeding improved varieties.
2. Materials and Methods
2.1. Sample collection
300 individuals of L. crocea were collected from three wild populations (ZJW, ZSW, and XMW) and two farmed populations (WZF and NDF). The specific sampling times, locations, and body length information are listed in Table 1.
2.2. Data measurement
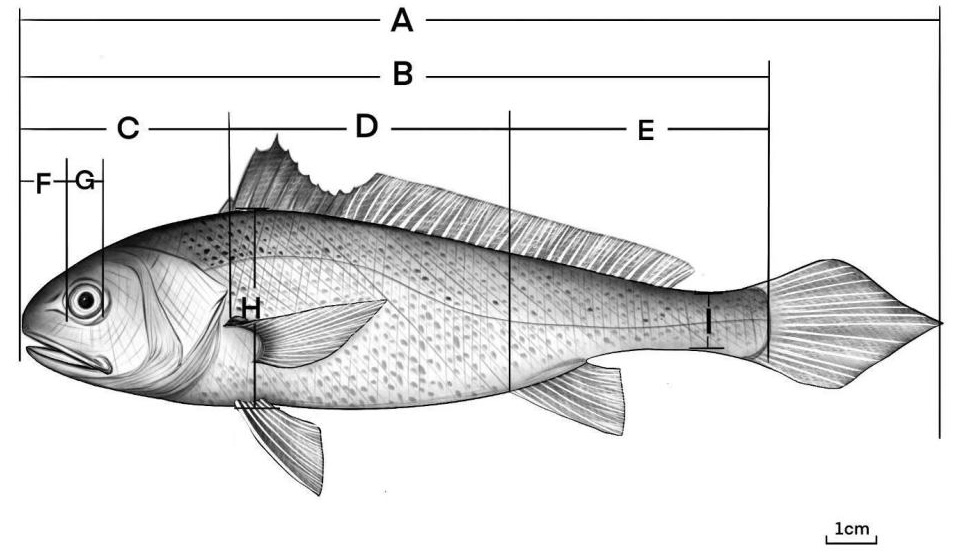
The measurement methods of morphological data mainly come from the literature. The shape indicators of each morphological measurement include overall high (OL), body length (BL), head length (HL), body high(BH), snout length (SL), eye diameter (ED), caudal peduncle length (CPL), caudal peduncle height (CPH), were measured by vernier caliper, and the data accuracy was 0.1mm. Weight was measured with an electronic balance to an accuracy of 0.1g. Seven standardized character indexes were counted, including OL/BL, BL/BH, BL/HL, BL/CPL, HL/SL, HL/ED, CPL/CPH. A schematic diagram of the morphological measurements is shown in Figure 1.

2.3. Statistical Analysis
Microsoft Excel software was used to process the data to eliminate the influence of fish body size on character parameters during data analysis and improve data accuracy. The data of these seven proportional traits were imported into SPSS 24.0 software for multivariate statistical analysis, including one-way analysis of variance (One-way ANOVA), principal component analysis, cluster analysis, and discriminant analysis.
One-way ANOVA was performed using SPSS 24.0. Multivariate comparison was performed by the Tukey s-b(K) method in one-way ANOVA, and a similar subset was divided, 0.05 was selected as the significance level.18
In SPSS software, “analysis-dimension reduction-factor” was used to conduct principal component analysis, and extract seven principal components and their eigenvalues, the contribution rate of each principal component, and the cumulative contribution rate according to the order of size. Scatter plots were drawn based on the scores of the first and second principal components to compare the variability and similarity of the five large yellow croaker populations and to determine their morphological differentiation.19
Using the mean value of each parameter correction, SPSS 19.0 software was used to perform cluster analysis by using the shortest distance system clustering method of Euclidean distance. The species clustering tree was constructed to compare the distance between populations.20
P1=O/M
P2=O/N
P=k∑i=1Ai/k∑i=1Bi
In formula: P1 and P2 are the discriminant accuracy rate (%), P is the comprehensive discriminant rate (%), O is the number of correctly discriminated large yellow croaker (tail), M is the number of measured large yellow croaker (tail). N is the number of large yellow croaker (tail); Ai is the number of large yellow croaker (tail) correctly judged by the i group, Bi is the number of large yellow croaker (tail) actually judged by the i group, and k is the number of groups (number).
3. Results
3.1. One-way analysis of variance
Seven morphological characteristics of five large yellow croaker populations in coastal China were analyzed by one-way ANOVA, and the proportional traits of each population were compared (Table 2). The results of variance analysis showed that there were significant differences in BL/BH and CPL/CPH ratio traits among the five populations. Among them, the three wild populations showed significant differences in OL/BL、BL/BH and CPL/CPH, while the two farmed populations showed significant differences in OL/BL、BL/BH、BL/HL、HL/SL、HL/ED and CPL/CPH, indicating that the morphological differences between these two populations were significant.
3.2. Principal component analysis
In SPSS, through principal component analysis of seven proportional traits of large yellow croaker, seven principal components were extracted, and the cumulative contribution rate was 100%. The characteristic values, contribution rates, and cumulative contribution rates of each principal component are listed in Table 3. After sorting by the contribution rate of each principal component, the contribution rates of the first five principal components were 29.984%, 18.462%, 17.234%, 12.167%, and 9.904%, respectively. The contribution rates of principal components 4 and 5 were relatively small, indicating that the two principal components explain the morphological differences between different populations at low rates. The cumulative contribution rate of the first five principal components was 87.751%, which meets the requirement that the cumulative contribution rate is greater than or equal to 85%, indicating that the first five principal components can better explain 87.751% of the morphological differences between different populations. The first principal component is mainly explains the three proportional traits of OL/BL、BL/HL、CPL/CPH; The second principal component mainly explains the two proportional traits of BL/CPL、CPL/CPH; The third principal component mainly explains the three proportional traits of OL/BL、BL/BH、HL/SL. The first three principal components mainly reflected the body size, tail, and head morphological characteristics.
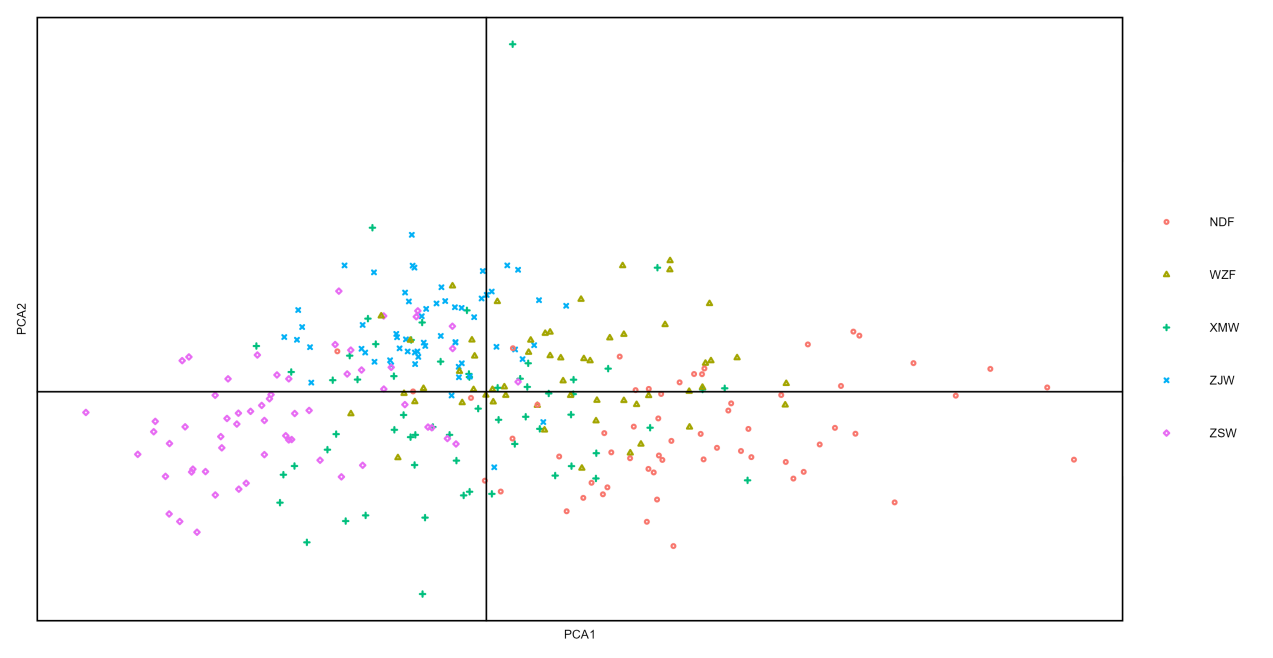
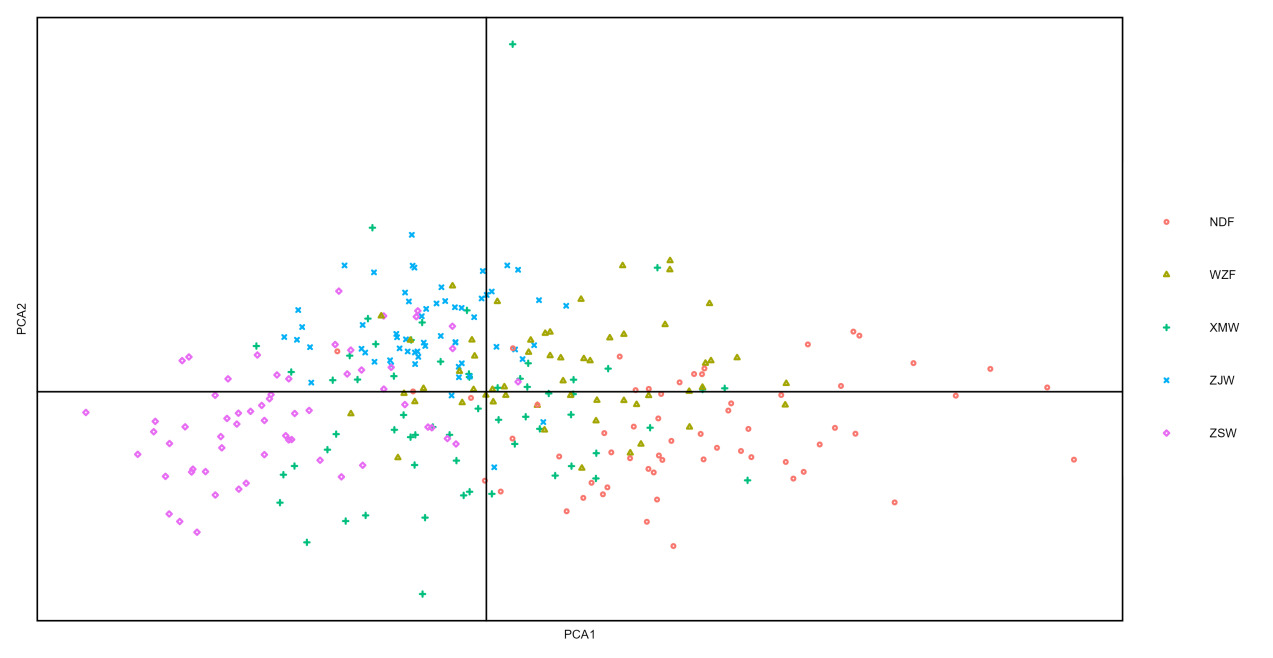
The principal component analysis diagram was drawn with the principal components 1 and 2 of five different geographic populations of large yellow croaker (Fig.2). The results can be intuitively seen from the principal component diagram that there are different degrees of overlap among the five populations. The boundary between populations was not obvious, indicating certain similarities and differences in the morphology of different populations. NDF and WZF overlap partly, and there is almost no overlap with other wild populations. Farmed populations and wild populations can be well differentiated.
3.3. Cluster analysis
Cluster analysis can intuitively show the distance of morphological relationship between populations. In this study, seven proportional traits of five large yellow croaker populations were cluster analyzed, and Euclidean distances between populations were obtained (Table 4).
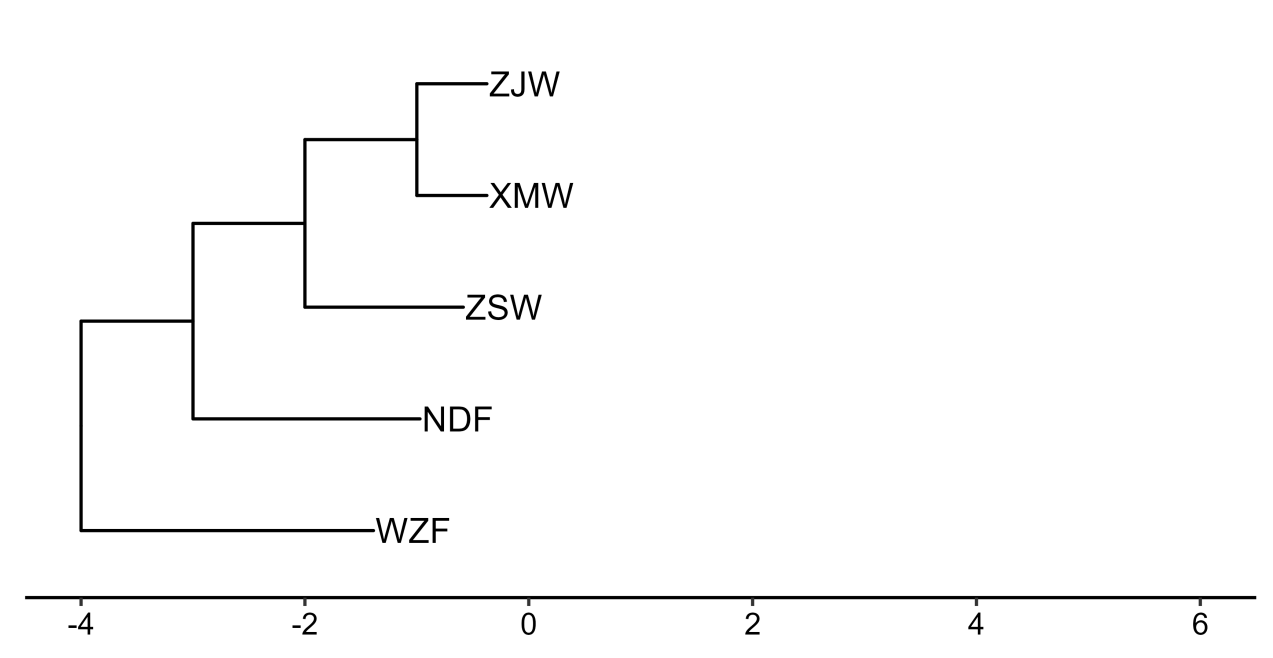
A tree diagram of the clustering relationship was drawn based on Euclidean distance (Fig. 3). As can be seen from Figure 3, the distance between ZJW and XMW is the closest, and they are clustered into one group at first, and then clustered separately with the three populations. Among which the distance between the three wild populations is the closest, while the farmed populations were further apart.

3.4. Discriminant analysis
The discriminant analysis of five large yellow croaker populations was carried out based on seven morphological proportional characters, and the step-to-step discriminant method was adopted (Table 5 and Table 6).
The results showed that the seven proportional characters had significant significance for discriminant classification. Therefore, all the seven proportional traits entered the discriminant function, and the discriminant classification function of large yellow croaker population was constructed. According to these functions, the original samples are distinguished and grouped. The discriminant function is expressed as:
YXMW=4246.716X1+121.907X2+141.621X3+396.002X4-7.499X5+37.786X6+145.117X7-3908.421
YZJW=4268.598X1+129.829X2+140.463X3+384.413X4-6.986X5+35.760X6+143.591X7-3912.708
YZSW=4327.993X1+138.588X2+142.871X3+392.895X4-7.482X5+34.805X6+142.434X7-4036.913
YWZF=4278.361X1+119.619X2+141.393X3+415.092X4-5.242X5+34.344X6+153.867X7-4032.883
YNDF=4237.545X1+122.385X2+147.931X3+423.013X4-7.743X5+42.790X6+157.901X7-4086.854
Where X1 = OL/BL, X2 = BL/BH, X3 = BL/HL, X4 = BL/CPL, X5 = HL/SL, X6 = HL/ED, X7 = CPL/CPH.
All the data collected from five large yellow croaker populations were put into the equation to test the discrimination accuracy, and the results showed that the discrimination accuracy P1 was 78.3%~92.7%, the discrimination accuracy P2 was 76.4%~96.5%, and the comprehensive discrimination rate was 99.3%. The discriminant accuracy P1 and P2 of five large yellow croaker populations are above 75%. The discrimination accuracy rate of the ZSW population is the highest, indicating that this population has obvious characteristics and is easy to discriminate. After discriminant analysis, the number of tails classified into each population was as follows: XMW had 57 tails, accounting for 19.3% of the total; ZJW had 72 tails, accounting for 24.4% of the total; ZSW had 52 tails, accounting for 17.6% of the total; WZF had 57 tails, accounting for 19.3% of the total; NDF had 57 tails, accounting for 19.3% of the total.
4. Discussion
The partitioning of the large yellow croaker population in offshore China has long been a source of debate.21 From north to south, the traditional large yellow croaker geographic populations are the stocks from Daiqu, Min-Yuedong, and Naozhou.4,5,22 Later research revealed that the large yellow croaker living in the Yellow and East China Sea is a member of the same population.6,9,23 Our findings do not line up with the conventional division. Before they clustered with ZSW in this study’s cluster analysis, the wild populations XMW and ZJW were more closely connected. In the principal component analysis diagram, the overlap between the XMW and ZJW populations is also wider than between the ZSW populations. According to recent research findings, Chen assessed wild large yellow croaker populations in the Zhoushan, Fuding, and Zhanjiang regions using SNP markers and discovered that the South China Sea population appeared to have more of an infiltration into the Ming-Yuedong Stock than the Daiqu Stock. Additionally, they hypothesized that the population border had moved northward from the Pearl River Estuary and that the Naozhou Stock and Min-Yuedong Stock geographic populations may have undergone habitat alterations due to climate change.24
The foundation of the comparative difference analysis method is a one-way analysis of variance, which compares three or more categorical groups to see if there are differences between them.14 This study showed the three wild populations’ OL/BL、BL/BH, and CPH/CPL ratios were significant. The traits of these populations were primarily reflected in their body size and caudal stalk. In contrast, the characteristics of the farmed population were mainly reflected in the morphological characteristics of the head, trunk, and caudal stalk. There were significant differences in trunk and caudal stalk among the five populations. The principal component analysis and one-way variance analysis results are consistent, and the characteristics of the first three principal components are mostly reflected in the trunk and caudal stalk. Additionally, Winans et al. effectively exploited the tail frame structure in various basins as early as 1984 to distinguish between the two ages of western salmon, suggesting that the fishtail may be a rather quick component of variation.25 Studies have also shown that due to the limited food caught in the Marine environment, farmed large yellow croaker is better fed with soybean feed provided by breeders, making the body of marine-caught large yellow croaker more slender than farmed large yellow croaker, which also causes more phenotypic differences.21,26
It can be seen from the principal component analysis diagram that there are different degrees of differences among the populations, among which XMW and ZJW populations have the highest degree of coincidence, that is, the highest morphological similarity and the least difference. From the scatter-point distribution of a single population, the span of five populations on the horizontal axis is large, indicating that there is likely to be differentiation within the population. The relatively close distribution of the ZJW population indicates that the population form is uniform, and the differences within the population are small. It is speculated that it is related to the geographical environment, which makes the individuals in this region almost unaffected by external populations. Cheng et al. research on Coilia spp. found that in terms of morphology, populations of different species that are geographically close together are more similar than populations of the same species that are geographically far apart.27The XMW population is the most dispersed, indicating that the differences within the population are the largest and the morphological differences are uneven. The XMW population is located at the estuary of the Jiulong River, adjacent to Zhoushan fishing ground in the East China Sea to the north, and adjacent to the South China Sea to the Pearl River Estuary and Dongnan Ao Island in Guangdong. The special geographical environment makes its morphology evolve in a special and independent direction, and the internal differences become greater.28,29
The gradual judgment method establishes the judgment function, the comprehensive judgment rate is 99.3%, and the population of large yellow croakers can be distinguished by morphology. Among them, the Zhoushan population has the highest accuracy. It is speculated that the temperature in the northernmost part is low. To cope with this phenomenon, a large yellow croaker develops in the direction of rapid growth, which significantly differs in body shape.30,31 The accuracy of the farmed population is higher than that of the wild population, and the impact of environmental factors on fish growth and development must be addressed. Morphological variation is influenced by environment and heredity, and the living environment may exert different selection pressures on different populations.32,33 Franssen et al. The similarity of external morphological characteristics may be due to the insufficient choice pressure of the fish living environment, making the genetic impact more obvious.10 In this study, the results of the four analysis methods are the same. The distance between the three wild populations is closer. ZJW and XMW cluster with ZSW, NDF, and WZF, respectively. In the main component analysis, the overlap of ZJW and XMW is also high. There is a lower overlap between wild and farmed populations. However, there is no obvious boundary line between the five populations, possibly related to the lower genetic diversity of large yellow croakers.34,35 Compared with wild populations in the analysis of the single factor variance, the differences between the farmed populations are more significant, mainly reflected in the morphological characteristics of the head length, long trunk, tail length, and high tail handle. In summary, the reason may be that after generations of breeding, reproductive isolation, and differences in living environment, the morphology of different populations has changed, which needs further molecular analysis to prove.28,36 In addition, although the long-term, large-scale artificial release of farmed large yellow croaker enriched the resources of large yellow croaker, it also led to serious gene pollution and population mixing of wild large yellow croaker, resulting in lower genetic diversity among populations.26,34
5. Conclusions
Morphological analysis is an intuitive and traditional method in comparing and dividing aquatic species. Based on the results of the above research, the four morphological analysis methods confirmed from different angles that there were significant differences between the five populations of large yellow croakers, and differences between farmed and wild populations were easy to distinguish. The discriminant function obtained in this study can be used as a relatively quick method to identify different large yellow croaker populations and provide convenience for identifying large yellow croaker populations in farming. However, it should be pointed out that the population of wild large yellow croaker collected in this study is single and cannot fully represent a particular population, which has certain limitations. Therefore, to make a more comprehensive and accurate evaluation of the germplasm resources of a large yellow croaker, it is necessary to combine molecular biological means.
Declaration of Competing Interest
None.
Acknowledgments
We acknowledge financial support from the Central Public interest Scientific Institution Basal Research Fund, CAFS (2020XT1002), the Seed Industry Revitalization Project of Special Fund for Rural Revitalization Strategy in Guangdong Province (2022-SPY-00-011, 2022-SJS-00-002), the Central Public-Interest Scientific Institution Basal Research Fund, South China Sea Fisheries Research Institute, CAFS (2022XK01); Thanks providing samples of large yellow croaker aquaculture populations from Miao Liang of Dongtou Marine Aquaculture Research Institute, Dongtou District, Wenzhou and Fang Ming of Ningde Aquatic Technology Promotion Station.
Authors’ Contribution
Formal Analysis: Yu-Qing Zhang (Lead). Investigation: Yu-Qing Zhang (Lead). Software: Yu-Qing Zhang (Lead). Project administration: Hua-Yang Guo (Lead). Writing – review & editing: Hua-Yang Guo (Lead). Methodology: Bao-Suo Liu (Lead). Visualization: Bao-Suo Liu (Lead). Data curation: Nan Zhang (Lead). Validation: Nan Zhang. Conceptualization: Ke-Cheng Zhu (Lead). Supervision: Ke-Cheng Zhu (Lead). Funding acquisition: Dian-chang Zhang (Lead). Resources: Dian-chang Zhang (Lead).