
Introduction
Otolith is formed in Osteichthyes with glial and calcium secreted by sensory hair cells, and the free ends of the cilia of the hair cells are buried in the glial membrane of the otolith, so the otolith plays a role in hearing and balance perception in fishes.1,2 When the fish is subjected to environmental stress, the otolith morphology is affected by changes in the physiological conditions of the fish.3–5 Therefore, the morphology of the otoliths will change with the change in the living environment. Moreover, the strong correlation between otolith morphology and fish size is common in fishes because both follow the same metabolic processes.6 Younger fishes have a stronger linear relationship between fish length and otolith dimensions compared to older age groups.7 Once the fish has stabilized in size, the otolith morphology will not change much; thereafter, the otolith increases in thickness only.8 Therefore, it is important to clarify the size of the fish when the otoliths are stabilized to utilize them better. Chanthran et al. found that fish length can be inferred using otolith lengths in Malaysian waters.9 Bose found that the otolith morphology of Neogobius melanostomus was significantly correlated with the body length of the fish.10 Wiecasezek finds that body length influences the sagittal otolith outer shape variation of round goby N. melanostomus.11 The above research indicated that the strong correlation between otolith morphology and fish size is common in marine fishes, but it has been poorly studied in freshwater fishes. In particular, there are few reports on plateau fish.
Schizothorax grahami (S. grahami) belongs to the Cyprinidae, Schizothoracinae, the genus Schizothorax Heckel, and is one of the more primitive species in the order Cyprinidae.12 S. grahami is an endemic plateau fish to China and is only found in the upper reaches of the Yangtze River.13 It often lives at the bottom of small rivers with clear water in mountainous areas.14 The reproduction rate is low, and the deformation rate is high.15 The age of male first sexual maturity is 3 years, and the age of female first is 4 years. The first successful artificial breeding was in 2007, and the full artificial breeding trial was completed in 2013.16 Previous studies on S. grahami have focused on growth and development, physiology, biochemistry, and disease control. The study of its otolith morphology has not been reported.17 In this experiment, S. grahami were selected from the source section of the headwater section of the Chishui River. It (27.42°-27.86°104.77°-105.31°E) belongs to the Yunnan section of the National Nature Reserve for Rare and Endemic Fishes in the upper reaches of the Yangtze River (Northeastern Yunnan Province). The source section of the Chishui River has been a national nature reserve in China since 2005 and has been under continuous resource protection for 17 years. Sampling in this area provides data with minimal anthropogenic disturbance and, as the dominant species in the basin, harvesting the S. grahami minimizes damage to natural resources from research fishing.
The study compared the otolith morphology of S. grahami from different total-length stocks. The otoliths were dissected from different perspectives for stock discrimination. It can provide basic data for conserving S. grahami resources in the Chishui River’s source section and identifying populations based on otolith microcharacteristics.
Material and Methods
Study Area and Field Sampling
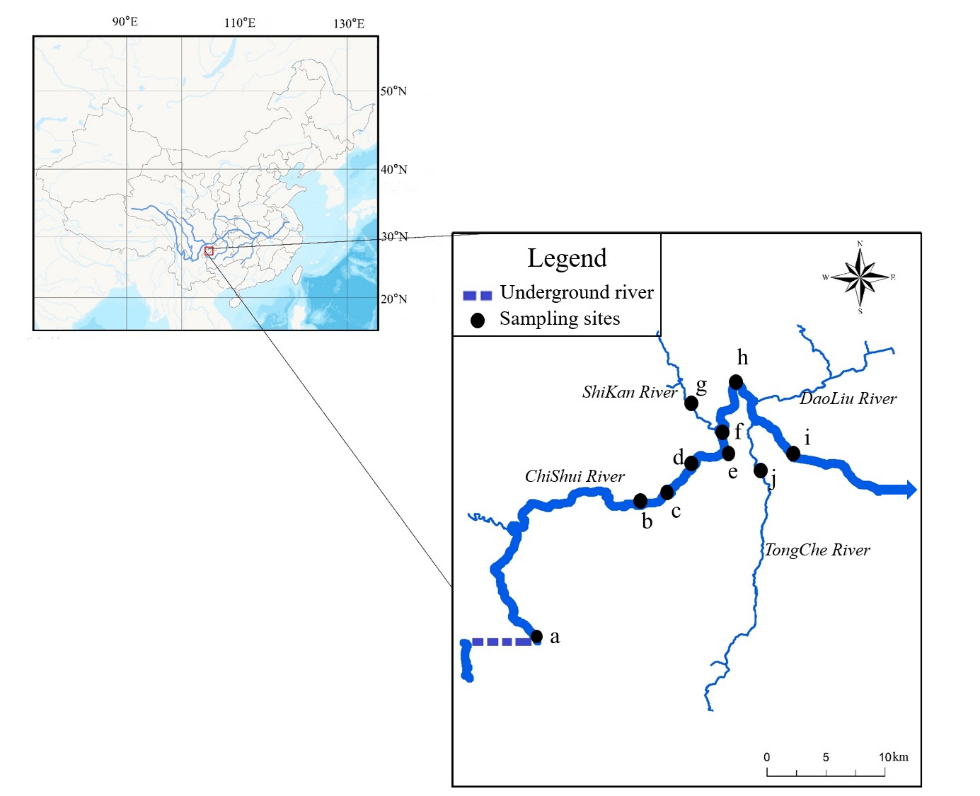
Sampling was carried out in March 2020 using different fishing gear (gill and cast nets) in the source section of the Chuishui River (Figure 1). 119 samples were captured, and the total length (TL, 0.1mm) and weight (W, 0.1g) of each specimen in the field were measured (Table 1). Asteriscus otoliths (left and right)18 were extracted from the inner ear of all specimens with the help of fine forceps and cleaned using an ultrasonic cleaning machine (YM-008S) in the laboratory. All state and institutional guidelines for the care and use of animals were followed in this research.
_in_chishui_river._blue_arrows_represent_the_d.png)
Total Length-Based Group Divisions
All samples were divided into four TL classes. Since the minimum TL for the appearance of pearl organs was 102 mm and the maximum TL was 247 mm in this fishing, all sampling was divided into four groups according to the TL growth, as shown in Table 2.
Otolith Morphometry
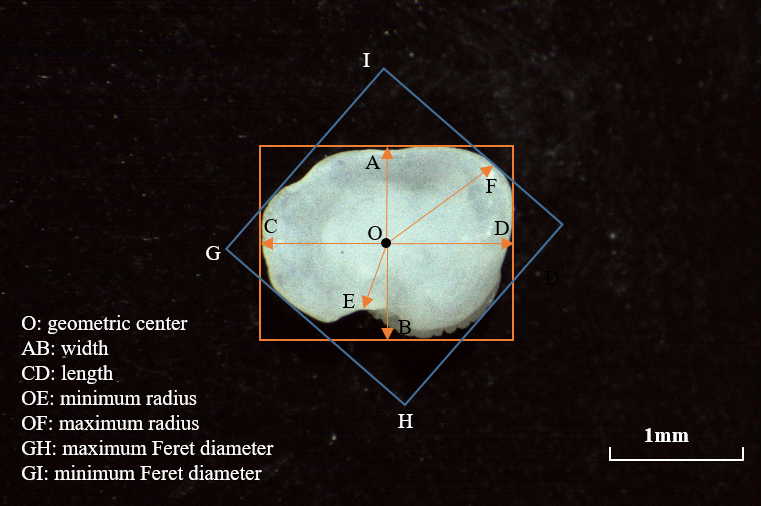
Before photographing the otoliths, they were placed consistently on a microscope stage covered with a black light-absorbing cloth to reduce light reflection and ensure true measurements of otolith morphology, where the sulcus side was perpendicular to the microscope stage and the anterior (rostral) region was facing up. Using an anatomical microscope (Motic SM171, Motic, China) with a digital camera (Moticam S6, Motic, China) photographing the otoliths. When taking otolith images, the same focal length and magnification are maintained while the lighting conditions are adjusted to produce clearer images. The image should be stored in full color to ensure good focus and high resolution in JPEG format. The otolith must be positioned so its top is left, as shown in Figure 2.

The morphological parameters such as otolith area (A), perimeter (P), feret length (FL), feret width (FW), maximum feret length (Fmax), minimum feret length (Fmin), maximum radius (Rmax) and minimum radius (Rmin) of otoliths were measured by using the micro image analysis software Image-Pro Plus 6.0. The calculation formula of the index is as follows table (Table 3). The measurement method is shown in Figure 2.19 By comparing and analyzing the otolith shapes of samples with different body lengths, each group’s otolith shapes are considered stable. They could be used for morphological comparative analysis. Import the processed image into the shapeR package in R20 and after step analysis.
Statistical Analysis
Microsoft Excel 2021 is used for data statistics, and SPSS 26.0 statistical software is used for One-way ANOVA, principal component analysis, and discriminant function analysis. Package Vegan in R is used for The Canonical Analysis of Principal coordinates. The results are recorded as Mean ± SD. There was no significant difference when p > 0.05, p < 0.05 is significant, and p < 0.01 is very significant.
Results
Analysis of otolith morphology based on river section with TL and Shape index analysis ANOVA
The collected samples were divided into four groups according to the TL frequency distribution of TL (Table 2). One-way ANOVA was performed on the shape indices of the four groups. The results showed that all shape indices had no significant difference between Group B and Group C except for roundness. They had significant differences with Group A and Group D. In terms of roundness, there was no significant difference between Group A and Group B. They were significantly different from Group C and Group D each other (Table 4).
Principal Components Analysis
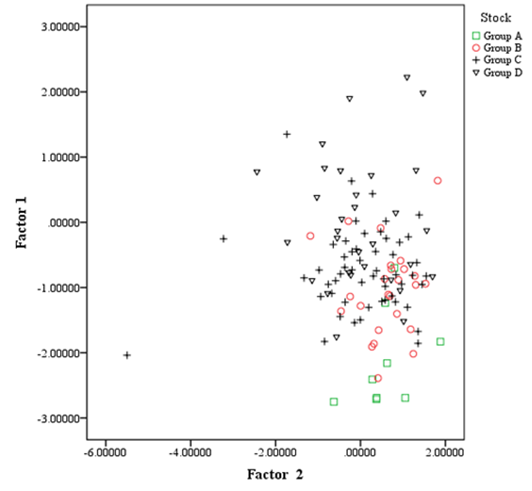
A principal component analysis of the otolith shape indices showed that 2 indices had eigenvalues greater than 1 and were used as the first 2 principal components, respectively (Table 5). The table shows that the cumulative contribution of the first 2 principal components was 80.696%, indicating that a small number of indices can summarize the differences in otolith shape in S. grahami. In the first principal component, all morphological indicators are greater than the second principal component, except for the rectangularity of the shape indices, which mainly reflects the degree of difference between the long and short axes of the otolith and the irregularity of the outline. Similarly, the principal component analysis of different TLs is shown in Table 5. The table shows that the cumulative contribution of the first 2 principal components was 79.406%, indicating that a small number of indices can summarize the differences in otolith shape in S. grahami. In the first principal component, all morphological indicators are larger than the second principal component except for the roundness and rectangularity of shape indices, which mainly reflect the degree of difference between the long and short axes of otoliths.
Figure 3 shows the scatter plots of the first two principal components, and Group B and Group C are mixed and can be distinguished from Group A and Group D.

Discriminant Analysis
The general discriminant analysis procedure in SPSS was used to derive the discriminant equations with eight otolith shape indices as independent variables, and the coefficients of the classification functions of the eight groups are shown in Table 6.
The otolith shape indices of each sample were substituted into the above 8 discriminant equations, and 8 function values were obtained for each sample. The group with the largest discriminant function was the group to which the sample belonged. The combined discriminant rate is 62.2%, except for two groups, Group A and Group D, which have a slightly higher discriminant rate, while the rest have a lower discriminant rate (Table 7).
Figure 4 is a scatter plot based on the values of the first two discriminant functions, from which it can be seen that Group A is separated from Group D, while a part of Group B and a part of Group C are mixed.

Fourier coefficients and Wavelet coefficients analysis ANOVA
An ANOVA was performed on the Fourier coefficients and wavelet coefficients extracted from the three groups (S1), and the analysis results showed that the four groups had highly significant differences.
Mean otolith shape
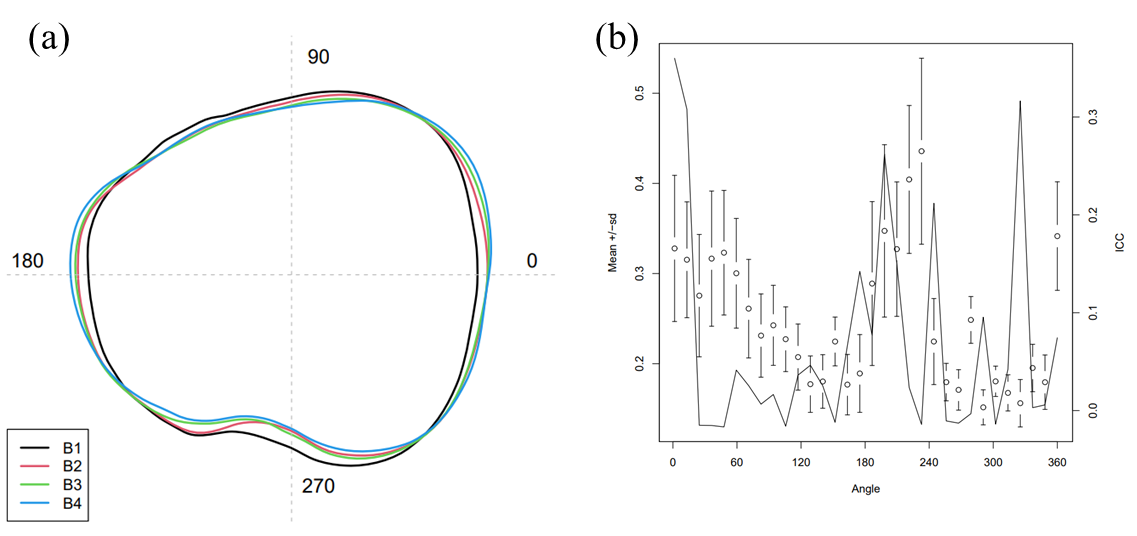
The mean shape used in the Wavelet Coefficients is plotted in Figure 5a. Otolith contours of the fish from the different studied localities presented differences in mean shape. The morphometry of the otoliths presented modifications in the rostrum-antirostrum (Figure 5b). These modifications were displayed in the wavelet coefficients (ICC) for these regions on the otolith outline at 180°-220°, 320°-340° and 350°-20°. In most cases, the mean shape of the three groups, Group B, Group C, and Group D, will overlap or have similar slopes, distinguishing them from Group A. This indicates that the contours are stabilizing.
_black__red_green_and_blue_contours_indicate_mean_otolith_shapes__based_on_wavelet_reco.png)
Canonical analysis of Principal Coordinates
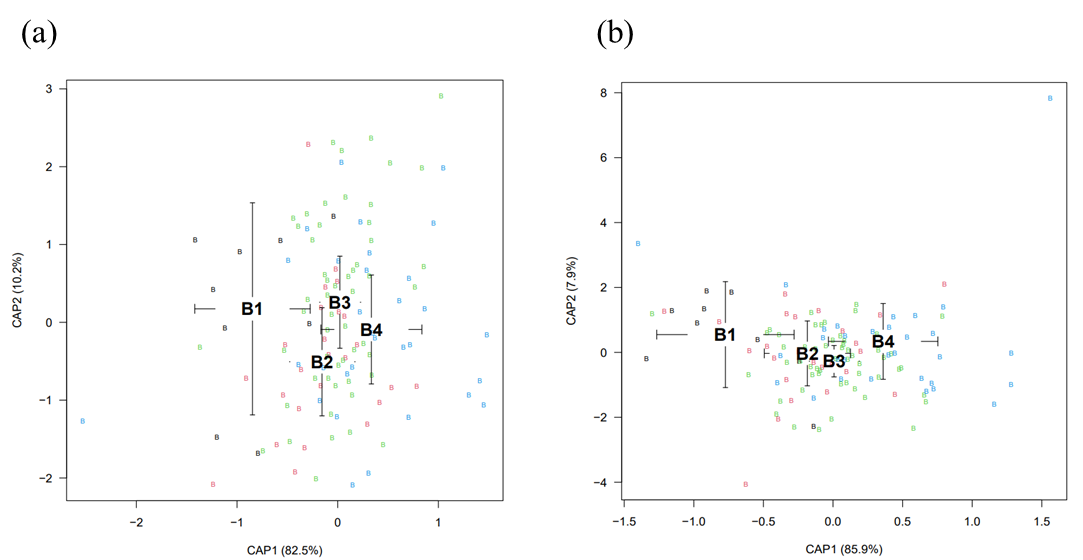
Figure 6a and Figure 6b show the Canonical analysis of Principal Coordinates for wavelet and Fourier coefficients, respectively. The first discriminating axis (CAP1) explained 82.5% of the variation among locations, while the second axis (CAP2) explained 10.2% in Figure 6a. Groups B, C, and D are mixed and cannot be separated but can be clearly distinguished from Group A. Similarly, the first discriminating axis (CAP1) explains 85.9% of the inter-position variation, while the second discriminating axis (CAP2) explains 7.9% of the variation in Figure 6b. Group B and Group C are mixed, cannot be distinguished, and are closer to Group D. In contrast, they can be clearly distinguished from Group A.

Discussion
Otolith morphology changes as fish grow in length is unstable early in fish life history, requires a process of form, growth, and stabilization,21,22 and is usually influenced by genetic information and geographic and physiological characteristics.23 It has been suggested that in most cases, otolith stabilizes after the fish reach their first sexual maturity, and therefore, sexually mature adult fish otolith should be used as much as possible when using otolith shape for population identification.24 However, from the results of the present study, this statement was not reflected in S. grahami. The results of the shape index showed that the seven morphological indices of Group A, except for rectangularity, were significantly different from the other groups. Principal component analysis and linear discriminant analysis also obtained the same results. It indicates that the otoliths are unstable in the early stage and continue growing. The larger individuals of Group B, Group C & Group D also presented a similar situation. The results of the three analysis methods results showed no significant difference between Group B and Group C when the otolith morphology had stabilized. However, these two groups differed significantly from Group D, and linear discriminant analysis did not consider a high degree of similarity between these three groups. The otolith morphology was still changing. Otolith morphology is closely related to the total length of the fish, in line with the results of other fish studies.25,26
Contour extraction was also performed using R to obtain elliptical Fourier Coefficients and discrete wavelet coefficients. From the mean shape of the contour reconstruction, Group B, Group C, and Group D overlap more, only between 230°-250°, and Group D is different from the other two groups. From the canonical analysis of principal coordinates (Figure 6), Group A is indeed separated from the other three groups, which can be separated from each other. The canonical analysis of principal coordinates on the Fourier Coefficients shows that Group D is also separated from Group B and Group C. The results are consistent with the results of the Shape Index. The above results show that the morphology of otolith is not completely stable at this time (TL < 25 cm), and the change is fast in the early stage (5-10 cm) and slow in the late stage (10 < TL < 25 cm), but still changing with the growth of body length. However, the pearl organs, a marker of fish sexual maturity, appeared early, indicating that the S. grahami in this catch was in the first sexual maturity or had already experienced the first sexual maturity. This early maturity could be due to the early sexual maturity of the fish as a result of the high number of extreme weather occurrences in recent years or a particularly rich environment for bait organisms, where the accumulated energy of the fish has met the reproductive demand.27 It is also possible that due to the fishing and environmental pressures on the S. grahami, the reproductive characteristics of the fish responded accordingly to the smooth reproduction of the population by early sexual maturation.28 Therefore, attainment of initial sexual maturity cannot be taken as a stable marker of otolith morphology in fish, and full length (or fish size) can be considered as a basis for differentiation.29,30 For the S. grahami, the otolith morphology tends to stabilize after the full length exceeds 10 cm, but the specific delimitation limits need to be followed to obtain more accurate results. During this experiment, the gonads of S. grahami were not observed, and only its apparent characteristics (pearl organ) were used to determine whether it was sexually mature. It is recommended that the gonads be included in future studies.
Conclusions
In conclusion, this study showed that the otolith morphology changes after reaching initial sexual maturity. The otolith morphology was strongly correlated with fish size, and the otolith tended to stabilize only when the fish reached a certain threshold of total length (or fish size). When the otolith morphology stabilizes, and what is the body length of the fish at this time? This all needs to be subsequently studied.
Acknowledgments
The authors thank the Yunnan Management and Conservation Bureau of the National Nature Reserve of Rare and Endemic Fishes in the Upper Reaches of the Yangtze River for the technical support.
Author contribution per CRediT
Conceptualization: Yang Zhou (Supporting), Qun Lu (Equal), Tao He (Lead). Data curation: Yang Zhou (Equal), Zhongtang He (Equal), Li Xu (Equal), Feng Yang (Equal). Formal Analysis: Yang Zhou (Equal), Weijie Cui (Equal), Tao He (Equal). Investigation: Yang Zhou (Equal), Tao He (Equal). Software: Yang Zhou (Equal), Weijie Cui (Equal), Zhongtang He (Equal). Writing – original draft: Yang Zhou (Equal). Supervision: Jianhu Liu (Equal), Tao He (Equal). Writing – review & editing: Tao He (Equal).
Funding
This research was sponsored by the Biodiversity Survey in the Yunnan Management and Conservation Bureau of the National Nature Reserve of Rare and Endemic Fishes in the Upper Reaches of the Yangtze River (No. 2023001017)
Declaration of Competing Interest
The authors declare that they have no known competing financial interests or personal relationships that could have appeared to influence the work reported in this paper.
Data Availability Statement
The data for the present study are available from the authors upon reasonable request.
Conflicts of Interest Statement
The authors declare no conflict of interest.