Introduction
China’s fisheries industry has developed rapidly after becoming the world’s largest fishing country. From 2000 to 2020, China’s fishery output value increased by an average of 8% annually, and the proportion of aquatic products globally reached 31 % in 2020.1 However, the fisheries industry in China is experiencing rapid growth, but it is also encountering the challenge of frequent fluctuations in aquatic product prices.2 The volatility in prices of aquatic products can reflect the supply and demand of the aquatic products market and the functioning of market mechanisms.3 However, frequent and significant price volatility not only impacts people’s consumption but also affects fishery production. Therefore, ensuring reasonable price volatility and maintaining stability in the aquatic products market are crucial factors in achieving sustainable development in China’s fisheries industry.
From the composition of aquatic products, 81 % of China’s aquatic products in 2022 come from aquaculture, of which freshwater aquaculture accounts for 59 % of the total aquaculture production, freshwater fish aquaculture production accounts for 82 % of the total freshwater aquaculture production, and accounts for nearly 40 % of China’s total aquatic products.4 It can be seen that freshwater fish farming plays a very important role in the development of China’s fishery. Therefore, it is necessary to systematically analyze the price fluctuation characteristics of freshwater fish in China and grasp the law of price fluctuation. On this basis, effective price warnings and regulations are of great significance for stabilizing the operation of the aquatic products market, ensuring the effective supply of aquatic products, and realizing the sustainable development of fishery.
Following the spider web theory of dynamic equilibrium proposal by Schultz, Tinbergen, and Ricci in the 1930s, there has been a growing interest in the volatility of agricultural product prices.5 The academic community has extensively researched the cyclical volatility characteristics in agricultural product prices. For example, Schroeter6 and Piot-Lepetit et al.7 analyzed the price volatility of agricultural products worldwide and concluded that these volatilities exhibit cyclical characteristics. Agricultural product prices also exhibit cyclical volatility characteristics within a country or region. For example, Fliessbach et al.8 and Lu et al.9 studied the cyclical characteristics of price volatility in South American cattle, hog, and Chinese potatoes, respectively. However, the cyclical characteristics cannot fully reflect the volatility of agricultural product prices. Academics have also studied other characteristics of agricultural product price volatility. Utnik-Banaś et al.,10 Shrinivas et al.,11 and Azaiez et al.12 found that agricultural price volatility in European Union pork, Indian cotton, and African countries is characterized by seasonality, randomness, and clustering. Li,13 Yu,14 and Guo et al.15 have all suggested that the price volatility of vegetables, fruits, and rice in China exhibits seasonal, random, and clustering characteristics. Scholars generally agree that agricultural product price volatility exhibits periodic, seasonal, random, and clustering characteristics. Still, there are varying opinions on whether they also demonstrate high-risk, high return, and asymmetry characteristics. From the perspective of different varieties, Zhou et al.16 discovered that, apart from wheat, the price volatility of corn, early indica rice, late indica rice, japonica rice, and soybean exhibited significant asymmetry characteristics between 2002 and 2017. From the perspective of different regions, Kuiper et al.17 suggested that pig prices in the United States exhibit high-risk and high-return characteristics across various regions. However, Wang et al.18 argued that pig prices in China did not display such characteristics. From the perspective of different times, Fu et al.19 found that hog prices did not exhibit high-risk and high return or asymmetry characteristics before April 2007 but did so after that date.
Currently, there is a lack of research on the price volatility characteristics of aquatic products compared to other agricultural commodities. Like other agricultural products, scholars have reached a consensus regarding the cyclical, seasonal, random, and clustering characteristics of price volatility in aquatic products.2,20,21 However, there are divergent views on whether the price volatility of aquatic products possesses high-risk, high return, and asymmetric characteristics. Del Hoyo Kehar et al.22 found that the price fluctuation of Spanish anchovies has asymmetric characteristics. Wang et al.23 discovered that the price volatility of hairtail fish was characterized by high-risk and high return. Conversely. Wang et al.24 contend that the price volatility of aquatic products in China does not exhibit high-risk and high-return characteristics but rather displays asymmetry. Zhang et al.25 studied 11 fish species in China and found that their price volatility did not exhibit high-risk and high-return characteristics. Only the price volatility of Turbot did not display asymmetry.
Through a comprehensive review of literature from both domestic and international sources, it has been observed that: (1) Currently, scholars are primarily focused on the price volatility of agricultural products. Aquatic products have not received significant policy support for stable production and supply compared to other agricultural products. At the same time, the origin of aquatic products is relatively concentrated, and the development of industrial information is low. This makes it prone to frequent and violent price volatility.26 Therefore, the price volatility characteristics of aquatic products need more in-depth analysis. (2) While scholars have studied the price volatility characteristics of agricultural products, including aquatic products, by analyzing certain price volatility or several price volatility characteristics, there is a lack of comprehensive and systematic analysis. (3) There are differing opinions on whether price volatility in aquatic products exhibits high-risk, high-return, and asymmetric characteristics. Therefore, on the one hand, based on previous studies, this paper will start with the analysis of the dominant characteristics based on the price decomposition method and the analysis of the recessive characteristics based on the ARCH model and comprehensively and systematically study the price volatility characteristics of Chinese freshwater fish from 2006 to 2022. On the other hand, this paper uses the GARCH-M and TARCH models to analyze the high-risk, high-yield, and asymmetric characteristics of China’s freshwater fish price volatility, respectively, to verify whether there are high-risk, high-return, and asymmetric characteristics.
Materials and Methods
Data sources
In view of the availability of data, this paper selects grass carp, crucian carp, silver carp, and carp as objects to study the price volatility characteristics of freshwater fish in China. These species are among the most significant freshwater aquaculture fish in China, and the total output of aquaculture in 2021 accounts for 58% of the total output of freshwater aquaculture fish.4 In this paper, the weekly wholesale market prices (CNY/kg) of four freshwater fish varieties from July 2006 to April 2022 were obtained through the Ministry of Commerce Business Forecast Network (https://cif.mofcom.gov.cn/cif/html/), and the price volatility characteristics of fresh-water fish were studied by EVIEWS 10 software. In the price decomposition method analysis, the arithmetic mean method is utilized to convert weekly data into monthly data.
Research Methods
Price decomposition Method
In this study, we utilized the price decomposition method to illustrate the dominant characteristics of volatility in the prices of freshwater fish. The price decomposition method entails dividing the price time series into four components: a long-term trend series, a cyclic volatility series, a seasonal factor series, and a random factor series. The long-term trend series represents the general direction of volatility in freshwater fish prices over time, while the cyclic volatility series reflects the cyclical characteristics of freshwater fish prices over the long term. The seasonal factor series captures the cyclical characteristics of prices for freshwater fish, and the random factor series represents the stochastic, or unpredictable, volatility characteristics in freshwater fish prices. There are two decomposition methods for price time series, namely, the addition and multiplication models. The multiplication model does not require factors to be independent of each other, and it allows for the comparison of different variables. In light of these advantages, the multiplication model is utilized in this paper to break down the price series of freshwater fish. The Census X-12 seasonal adjustment model, developed by the United States Department of Commerce, is one of the most well-known and widely used methods for analyzing the characteristics of seasonal and random volatility.27
ARCH model
This study utilized an ARCH model to characterize the recessive characteristics of price volatility in freshwater fish. Firstly, a white noise test was conducted to determine the non-random time series of price variables for four freshwater fish species. Therefore, this paper establishes the mean equation (1) for fitting the ARMA model, better suited for linear structured data.28 Optimal fitting models were constructed for each of the four aquatic products based on the autocorrelation graph and the AIC minimum criterion, represented by equations (2), (3), (4), and (5) for grass carp, crucian carp, silver carp, and carp, respectively. The residual terms of the mean value equation were subjected to a white noise test using EVIEWS software, which revealed no sequence correlation.
Yt=X′tθ+εt,
GrassRt=θ1Grasst−1+θ3εt−1+θ5εt−8+εt,
CrucianRt=θ1CrucianRt−1+θ2CrucianRt−4+θ3εt−1+θ4εt−4+εt,
Silvert=θ1Silvert−1+θ3εt−1+εt,
CrapRt=θ1CrapRt−1+θ3εt−1+εt,
In this paper, represents the price volatility of four freshwater fish species, while represents the lag term for each order of is the coefficient of the lag term, is the random disturbance term of the time series, and represents the number of periods in the series.
Secondly, in the ARCH model, the order of the variance equation’s differencing is too high. This will increase the number of parameters that need to be estimated and reduce the accuracy of the estimation. To address this problem, Bollerslev proposed the GARCH model,29 represented by equation (6). In this equation, and respectively denote the constant term, the ARCH term’s coefficient, and the GARCH term’s coefficient. And represents the conditional variance of the disturbance term in period represents the external impact of the lag phase, and represents the price volatility of the lag phase when the explanatory variable’s influence on price will disappear. When there is an influence of explanatory variables on price spreads.20 The GARCH-M model is created by adding the term for standard deviation, denoted as to the mean equation of the GARCH (1,1) model as an explanatory variable. represents the expected risk of price volatility, and if is significantly greater than 0 , it indicates that price volatility is characterized by high-risk and high return. If is insignificant, it suggests that the relationship between risk and return is uncertain.
σ2t=ω1+α1ε2t−1+β1σ2t−1,
Furthermore, this study proposes the TARCH model to account for the symmetrical impact of both positive and negative news on price volatility. The variance equation for this model is represented by equation (7), where is a dummy variable. If otherwise, it is equal to represents the impact of positive news on conditional variance, while represents the impact of negative news on conditional variance. If it indicates an asymmetry in price volatility. When positive news has a greater impact on the severity of price volatility, while decreasing prices have a greater impact on price volatility when 0.
σ2t=ω3+α3ε2t−1+β3σ2t−1+γIt−1ε2t−1
Results
Empirical analysis of dominant characteristics
Trend cycles characteristics
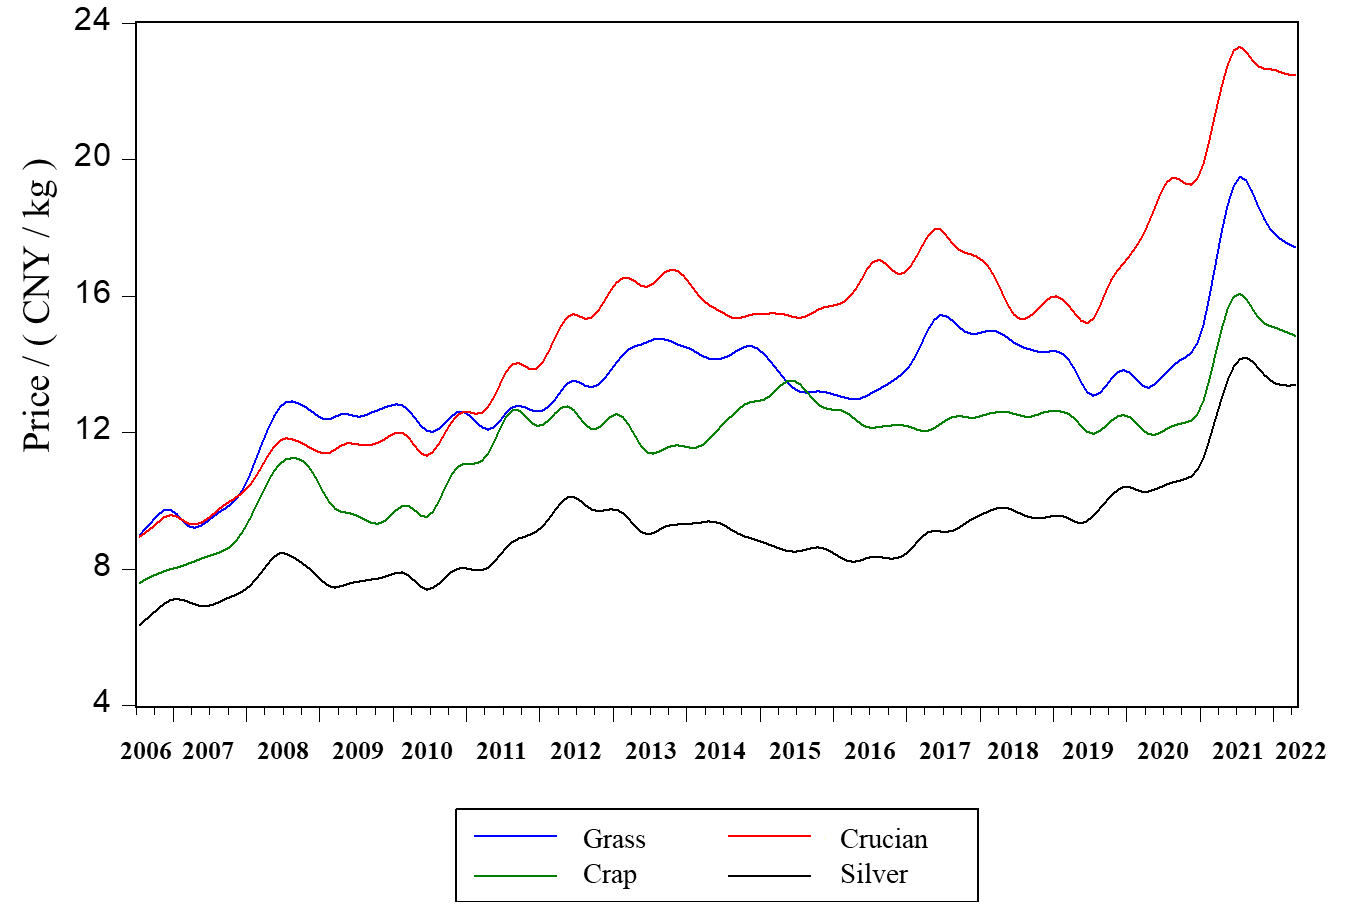
The long-term trend cycle graph of freshwater fish prices indicates a cyclical upward price trend from 2006 to 2022 (Figure 1). This trend can be attributed to three primary factors: production and circulation costs, residents’ income levels, and money supply. Firstly, production and circulation costs. In terms of production, volatility in the prices of means of production during aquaculture can result in corresponding changes in the prices of aquatic products. For instance, an increase in the cost of seedlings, feed, and labor can lead to higher prices for aquatic products. In terms of circulation, the perishable nature of aquatic products, combined with their regional production and national consumption, makes their circulation challenging, resulting in significant storage, transportation, and transaction costs. These costs contribute to an increase in the price of aquatic products.30 Secondly, the level of residents’ income. With the improvement of residents’ income levels and the transformation of consumption characteristics, the demand for aquatic products is increasing daily, leading to a rise in prices.31 Thirdly, the money supply. China’s money supply M1 has increased by 526% from 2006 to 2022, leading to a rise in the price level and an overall increase in the cost of aquatic products.32

From 2006 to 2012, the price volatility of freshwater fish increased, but the rising speed was relatively gradual. From 2012 to 2018, the price of freshwater fish was severely volatile in the horizontal plate. From 2019 to 2022, the price volatility of freshwater fish is on the rise and rising fast. From the perspective of specific varieties, on the one hand, the growth cycle of crucian carp breeding is longer. On the other hand, some consumers prefer crucian carp, so the price of crucian carp has been at the highest level since 2010. From 2006 to 2022, the price of silver carp will always be at the lowest level. The reason is that silver carp is a large economic fish with a fast growth rate, and its supply is relatively large, resulting in its lower price. The price of grass carp and carp have been between crucian carp and silver carp.
Seasonal characteristics
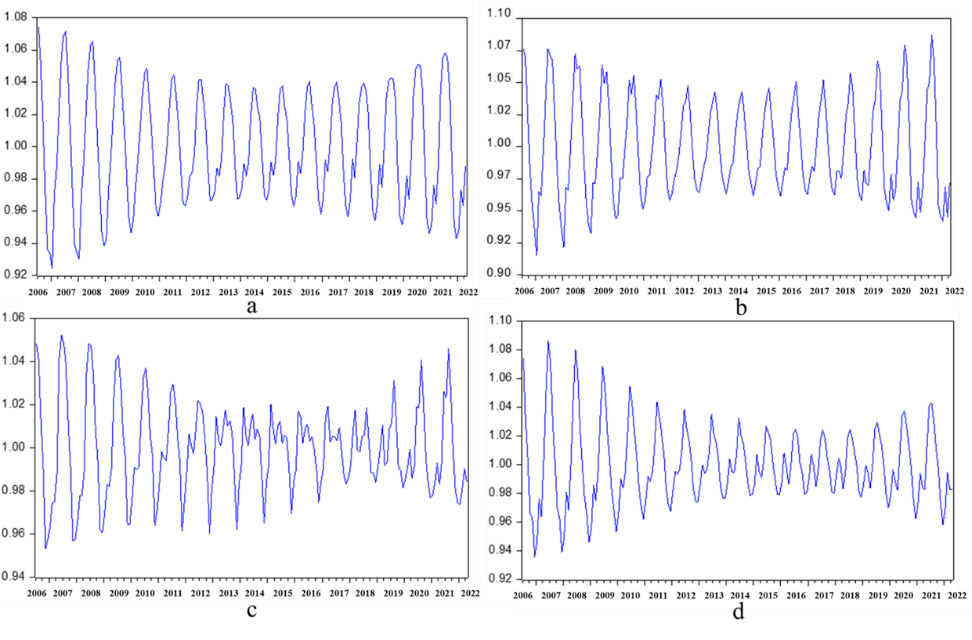
Based on the seasonal factor sequence graph of freshwater fish price volatility, it can be seen that grass carp, crucian carp, silver carp, and carp price volatility exhibit significant seasonal characteristics (Figure 2). The highest price of grass carp is typically observed at the end of June and the beginning of July, while the lowest price is usually at the end of November and the beginning of December (Figure 2-a). The highest price of crucian carp is consistently observed in May every year, while the lowest is typically in December (Figure 2-b). The price of silver carp exhibited clear seasonal characteristics from 2006 to 2011, with the lowest price observed in December and the highest price in May. However, between 2011 and 2022, the seasonal trend characteristics of silver carp prices have slowed down. This is particularly evident from 2013 to 2016, during which the seasonal factors of price volatility were not significant (Figure 2-c). The highest price of crap was observed towards the end of June, and the lowest prices in December and January each year. From 2016 to 2022, the seasonal price volatility of carp exhibited a W-shaped trend (Figure 2-d). The seasonal price volatility of freshwater fish is mainly caused by changes in the supply of freshwater fish due to their growth cycle. The seedling period for these four species of freshwater fish is mostly from April to June each year, and they are typically available in the market from November to December annually. Therefore, the supply of fresh-water fish increases significantly when introduced to the market in November and December, resulting in a decrease in market price.

Random characteristics
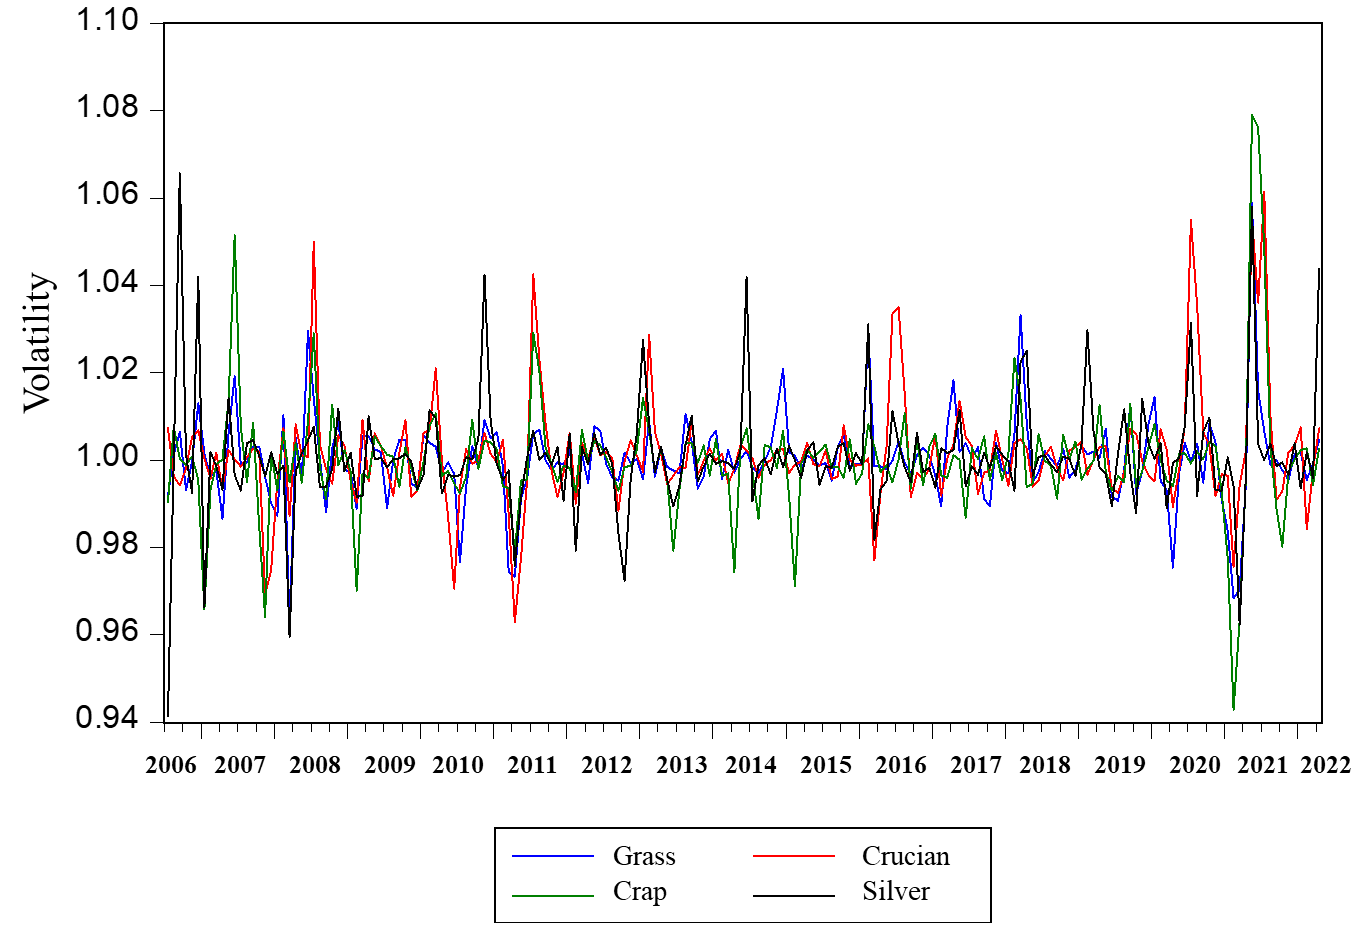
Based on the random factor sequence graph of freshwater fish price volatility, it can be seen that the random volatility of freshwater fish prices was more intense from 2006 to 2014. From 2014 to 2019, the irregular factors contributing to freshwater fish price volatility gradually stabilized. Between 2019 and 2022, the price of freshwater fish experienced two instances of violent and irregular volatility (Figure 3). Specifically, the frequency of irregular volatility in freshwater fish prices gradually decreased from 2006 to 2019. Throughout this period, consumer demand for freshwater fish remained relatively stable, and the irregular volatility in supply was the primary factor contributing to price fluctuations. The change in supply is mainly caused by a decrease in freshwater fish production caused by disastrous weather such as high temperatures and rainstorms. The main reason for the irregular volatility of freshwater fish prices in 2020-2022 is the impact of the new coronavirus epidemic.33 Measures such as the closure of the city during the new coronavirus epidemic have greatly hindered the logistics and transportation of aquatic products. In addition, the demand for aquatic products in the catering industry has also decreased sharply, so the supply and demand balance in the aquatic product market has been completely broken. With the advent of the post-epidemic era, the irregular changes in the price volatility of aquatic products will gradually decrease.

Empirical analysis of recessive characteristics
Descriptive Statistics
In the empirical analysis of ARCH models, in view of the favorable statistical characteristics of price volatility [34], this paper constructs a time series of price volatility. The time series is expressed as where and represent the current and previous price levels of freshwater fish, respectively. The descriptive statistics for prices and volatility of freshwater fish indicate that grass carp and crucian carp prices have a relatively large range of volatility from the mean value. All variables exhibit significant deviation from a normal distribution and display statistical characteristics of “peak and thick tail” (Table 1). Based on these findings, it has been preliminarily determined that this paper is suitable for establishing an ARCH model.
Stationarity test
To avoid the issue of pseudo-regression and ensure unbiased parameter estimation, and given the large sample size this study utilizes the ADF test to assess the stationarity of variables.34 According to the results of the stationary test for price volatility of freshwater fish, all variables are stationary series without a drift or trend term at the 1% significance level (Table 2). This implies that the mean, variance, and covariance of the price series for the four freshwater fish species remain consistent over time. Therefore, the prerequisite for establishing the econometric model is met as follows.
Testing for ARCH Effect
Based on the Arch-LM test of the residual term of the mean equation, it is evident that the ARCH effect is significantly present in the price volatility of the four freshwater fish species with a 99% confidence level. This is indicated by the distinct clustering characteristics (Table 3). Additionally, the variance is not constant, which satisfies the necessary conditions for establishing the ARCH model. This allows for further analysis to be conducted.
Results of Estimating ARCH Model
Based on the estimation results of the GARCH (1,1) model for price volatility, the ARCH and GARCH coefficients and for all models are significantly different from 0 at a 95% confidence level (Table 4). This indicates that there are significant clustering characteristics in the price volatility of freshwater fish. In other words, in addition to the impact of external information in the previous period, the current price of freshwater fish is also influenced by the conditional variance of the residual term from the earlier period. This indicates that there is a degree of transitivity in the range of price volatility for freshwater fish, and that price volatility in the early period will be transmitted to those in the later period. Furthermore, the estimated coefficients of for grass carp was significantly less than 1, indicating that the impact of previous price volatility on later price volatility will diminish quickly. The clustering characteristics of price volatility among the four freshwater fish species is largely attributed to market imperfections and variations in farmers’ understanding of market prices.25 The distribution of market price information among farmers, wholesalers, retailers, and consumers is not symmetrical, with wholesalers exerting market power that enables them to influence the terminal price level. Although there are a large number of farmers at the front end of the industrial chain, their farming operations are small and scattered, their organizational structure is weak, and they have limited access to information channels. Farmers tend to expand their aquaculture operations when the price of aquatic products increases, which can result in a subsequent decrease in market prices.
Based on the estimation results of the GARCH-M model for price volatility, the risk-reward coefficients of crucian carp is 0.073787 with a 95% confidence level. The price volatility of crucian carp is characterized by high risk and high return, which is consistent with the coexistence of sharp volatility and slow price increases.
Based on the estimation results of the TARCH model, the TARCH model parameters for grass carp, crucian carp, silver carp, and carp are all statistically significant at the 1% level. The asymmetric coefficients are less than 0, the impact of positive news (rising prices) on the volatility of freshwater fish prices is much greater than that of negative news (falling prices). The main reason for this phenomenon is that the entry threshold for freshwater fish aquaculture is relatively low. When there is positive news in the market, it attracts producers to raise grass carp, carp, and other fish, resulting in an increase in the expected supply. However, since the market demand remains relatively stable, this leads to an increase in the range of price volatility. On the other hand, when negative news hits the market, farmers tend to reduce the supply by extending the ponding time. They sell their products after the price rises to prevent a decline in prices.
Discussion and Conclusion
Throughout the process of reforming China’s economic system, the price of agricultural products has always been an unavoidable topic. This is also one of the major issues that affects people’s lives. One of the policy objectives of China’s macroeconomic control is to maintain the relative stability of agricultural product prices.35 In this paper, we have chosen four freshwater fish species as the subject of our research and analyzed price data from 2006 to 2022 to examine the price volatility characteristics of freshwater fish in China. The results indicate that the price of freshwater fish exhibits an upward trend with periodic volatility, which is characterized by seasonality, randomness, clustering, and asymmetry. Among the four freshwater fish species, only the price volatility of crucian carp exhibits high-risk and high-return characteristics. So why does the price of freshwater fish fluctuate, and the volatility has the above characteristics? The reasons include: (1) From the perspective of the dominant characteristics of price volatility, the seasonal characteristics of price volatility in freshwater fish are primarily due to changes in supply quantity, influenced by the growth cycle of aquatic products. And the volatility in the supply and demand of aquatic products, caused by natural disasters, public emergencies, and other external factors, results in random price volatility characteristics of aquatic products. The cyclical upward trend in freshwater fish prices is due to rising production and circulation costs, increasing income levels, and growth in the money supply. (2) From the perspective of the hidden characteristics of price volatility, the clustering characteristics of price volatility is mainly due to the lack of transparency in the aquatic product market and the asymmetric distribution of market price information among the main players. This leads to trading bodies easily forming current price expectations based on previous prices, causing price volatility. The non-existence of high-risk and high-return is mainly caused by the weak nature of fishery production. Even if the anticipated risk level increases, farmers are compelled to accept the established market price passively. The asymmetrical volatility characteristics in freshwater fish prices are due to the relatively low entry barrier for freshwater fish farming.
Combined with the above research results, in the future, the government should pay attention to the following points when stabilizing the price fluctuation of aquatic products and promoting the smooth operation of the aquatic product market: (1) In view of the rising cost of fishery production and circulation, the price of freshwater fish shows a cyclical upward trend as a whole. Therefore, on the one hand, relevant departments can promote the modernization of China’s fishery industry through farmers’ cooperation or leading enterprises, the establishment of modern breeding bases, and the development of fishery socialized service organizations, so as to improve the level of fishery technology and reduce the cost of fishery production. On the other hand, relevant departments can improve the construction of aquatic products circulation mechanism to reduce the cost of fishery circulation. Actively use exhibitions, promotions, trade fairs and other means to build aquatic products production and marketing docking platform, in order to achieve production and marketing docking to provide an effective way. At the same time, we should fully rely on the power of cooperatives to effectively organize scattered farmers to ensure the stable supply of aquatic products. On this basis, explore the long-term mechanism of production and marketing such as agricultural super docking, agricultural school docking, and agricultural enterprise docking. (2) The relevant departments should improve the emergency mechanism of fishery production emergencies such as natural disasters and aquatic product safety, so as to reduce the adverse effects of the randomness of aquatic product prices on fishery development. On the one hand, relevant departments should strengthen the construction of climate disaster early warning and response capabilities, predict extreme climate in advance, and use mobile phones, television and other channels to inform farmers (enterprises). Timely start the emergency mechanism to provide the necessary guidance to minimize the impact of extreme weather on aquaculture. On the other hand, relevant departments should increase their attention, attention and support for fishery insurance. Due to the high risk of aquaculture, in the large system of agricultural insurance, fishery insurance has been slow in progress and small in coverage. Therefore, different types of fishery insurance should be developed to meet the interests of different groups, reduce the unnecessary losses of farmers (enterprises), enhance their ability to resist risks, and then provide impetus for stabilizing the price fluctuation of China 's aquatic products market. (3) Relevant departments should improve the aquatic product price early warning system and aquatic product supply and demand information release platform to reduce the adverse effects of aquatic product price agglomeration, high risk and asymmetric characteristics on the development of aquaculture. On the one hand, relevant departments should strengthen market monitoring, make full use of big data and other technologies, improve the monitoring and early warning system of the whole industrial chain of aquatic products, grasp the price fluctuation of aquatic products, and provide macro guidance and services to farmers (enterprises). On the other hand, relevant departments should establish a unified information release platform for aquatic products supply and demand, and regularly release information on aquatic products prices, supply and demand through mobile phones, television, newspapers and other channels. So that farmers (enterprises) unreasonable adjustment of production scale and more rational entry or exit from the market to scientifically guide the production and consumption of aquatic products, thereby reducing the adverse impact of aquatic product price agglomeration fluctuations on fishery development.
The main contributions of this study are as follows: On the one hand, aquatic products are more susceptible to frequent and severe price volatility than agricultural products. However, there is currently limited research available, and the existing studies primarily focus on analyzing aquatic products’ individual price volatility characteristics. Based on previous studies, this paper will begin with an analysis of the dominant characteristics using the price decomposition method, followed by a recessive feature analysis using the ARCH model. This paper presents a comprehensive and systematic study of the price volatility characteristics of freshwater fish in China from 2006 to 2022. On the other hand, currently, scholars hold differing opinions on whether price volatility in aquatic products exhibits high-risk, high return, and asymmetric characteristics. In this paper, we utilize the GARCH-M model and TARCH model to analyze the high-risk, high-return, and asymmetric characteristics of price volatility in freshwater fish in China to verify whether there are high-risk, high-return and asymmetric characteristics. However, there are also some limitations to this paper. On the one hand, this paper mainly analyzes the price of freshwater fish from the perspective of price volatility characteristics and qualitative analysis of the causes of freshwater fish price volatility, quantitative analysis of the causes of freshwater fish price volatility remains to be further studied. On the other hand, based on the availability of data, only wholesale prices in the intermediate market of freshwater fish are selected for analysis in this paper. In fact, the price of freshwater fish is a complex concept that encompasses not only the wholesale price in the intermediate market, but also the production price in the origin market and the consumer price in the retail market. It is unclear whether the prices in these markets exhibit the same volatility characteristics as wholesale prices, which requires further conditions to obtain more comprehensive data for research.
Acknowledgments
This study was supported and financed by the Ministry of Agriculture of People’s Republic of China through the China Agriculture Research System (Grant No CARS-48).
Authors’ Contributions per CRediT
Methodology: Jing Wang (Equal), Zhiyuan Zhao (Equal), Shen Liu (Equal). Writing – original draft: Jing Wang (Equal), Zhiyuan Zhao (Equal), Shen Liu (Equal). Data curation: Jing Wang (Equal), Zhiyuan Zhao (Equal), Shen Liu (Equal). Software: Jing Wang (Equal), Zhiyuan Zhao (Equal), Shen Liu (Equal). Conceptualization: Hongtao Jin (Equal), Chen Sun (Equal). Writing – review & editing: Hongtao Jin (Equal), Chen Sun (Equal). Supervision: Hongtao Jin (Equal), Chen Sun (Equal). Funding acquisition: Chen Sun (Lead).