Introduction
Longfin batfish (Platax teira) is a marine fish species that is increasingly attracting attention due to its unique biological characteristics, ecological significance and potential for commercial farming.1,2 They are distributed in tropical waters of the Indo-Pacific and inhabit coral reefs, lagoons and other shallow coastal environments, which play a role in maintaining the ecological balance and diversity of coral reef ecosystems.1 The fish has a high economic value and delicious meat.1,3 Besides, with its unique body shape and attractive habit of living and swimming in schools, the fish is among the notable marine ornamental fish, especially in public or large aquariums.4 Due to an increased demand and limited supply, the fish is facing the risk of overexploitation in their natural resources.2 Aquaculture represents a constructive approach in endeavors to conserve and promote the sustainable development of fish farming. However, up to now, research information on the biology, reproduction, and environmental ecology of this fish species is still extremely limited, posing challenges to artificial breeding and commercial farming research.
Determining environmental and technical parameters in larval rearing plays a crucial role in the success of fish farming because it directly affects growth, survival, and production efficiency.5 Various environmental factors, including salinity, significantly impact fish growth and physiology.6,7 Salinity is an important parameter that needs to be considered in the process of selecting a farming system and area because it affects osmoregulation, metabolic activity, overall health, and even the ability to function correctly, and survival of cultured species has been mentioned in many studies.8–11 We hypothesized that longfin batfish larvae can be reared at low salinity in coastal areas. This is significant in reducing the use of seawater which can damage hatchery equipment and is costly if hatcheries are far from the ocean. Understanding the effects of salinity levels on the growth, survival, and food utilization efficiency of the fish at the larval stage is essential to optimize rearing conditions as well as production results.
In general, salinity in coastal areas where fish farming takes place varies widely from 5 - 35‰, and can significantly impact the success of marine fish farming.8 However, up to now, research on the impact of salinity on the longfin batfish at the larval stage is still very limited, both domestically and internationally, making it difficult to determine appropriate rearing systems and areas for this species. This study aims to evaluate the effects of different salinity levels on the growth, survival, and food utilization efficiency of the larvae. Through systematic evaluation of the above criteria, within a wide range salinity range (10 - 30‰), we can determine the optimal salinity of this fish. We hypothesize that different salinity levels will have a significant impact on growth performance, survival and food utilization efficiency of the fish. The results obtained will be an important basis for improving rearing efficiency and expanding the development of fish farming.
Materials and methods
Experimental designs
The experiment was conducted at the marine fish hatchery, Nha Trang University, Vietnam. Fish were reared in 15 cylindrical fiberglass tanks. The rearing tank has a diameter of 80 cm, a height of 100 cm, a tank capacity of 300 liters, and a water supply of 250 liters.

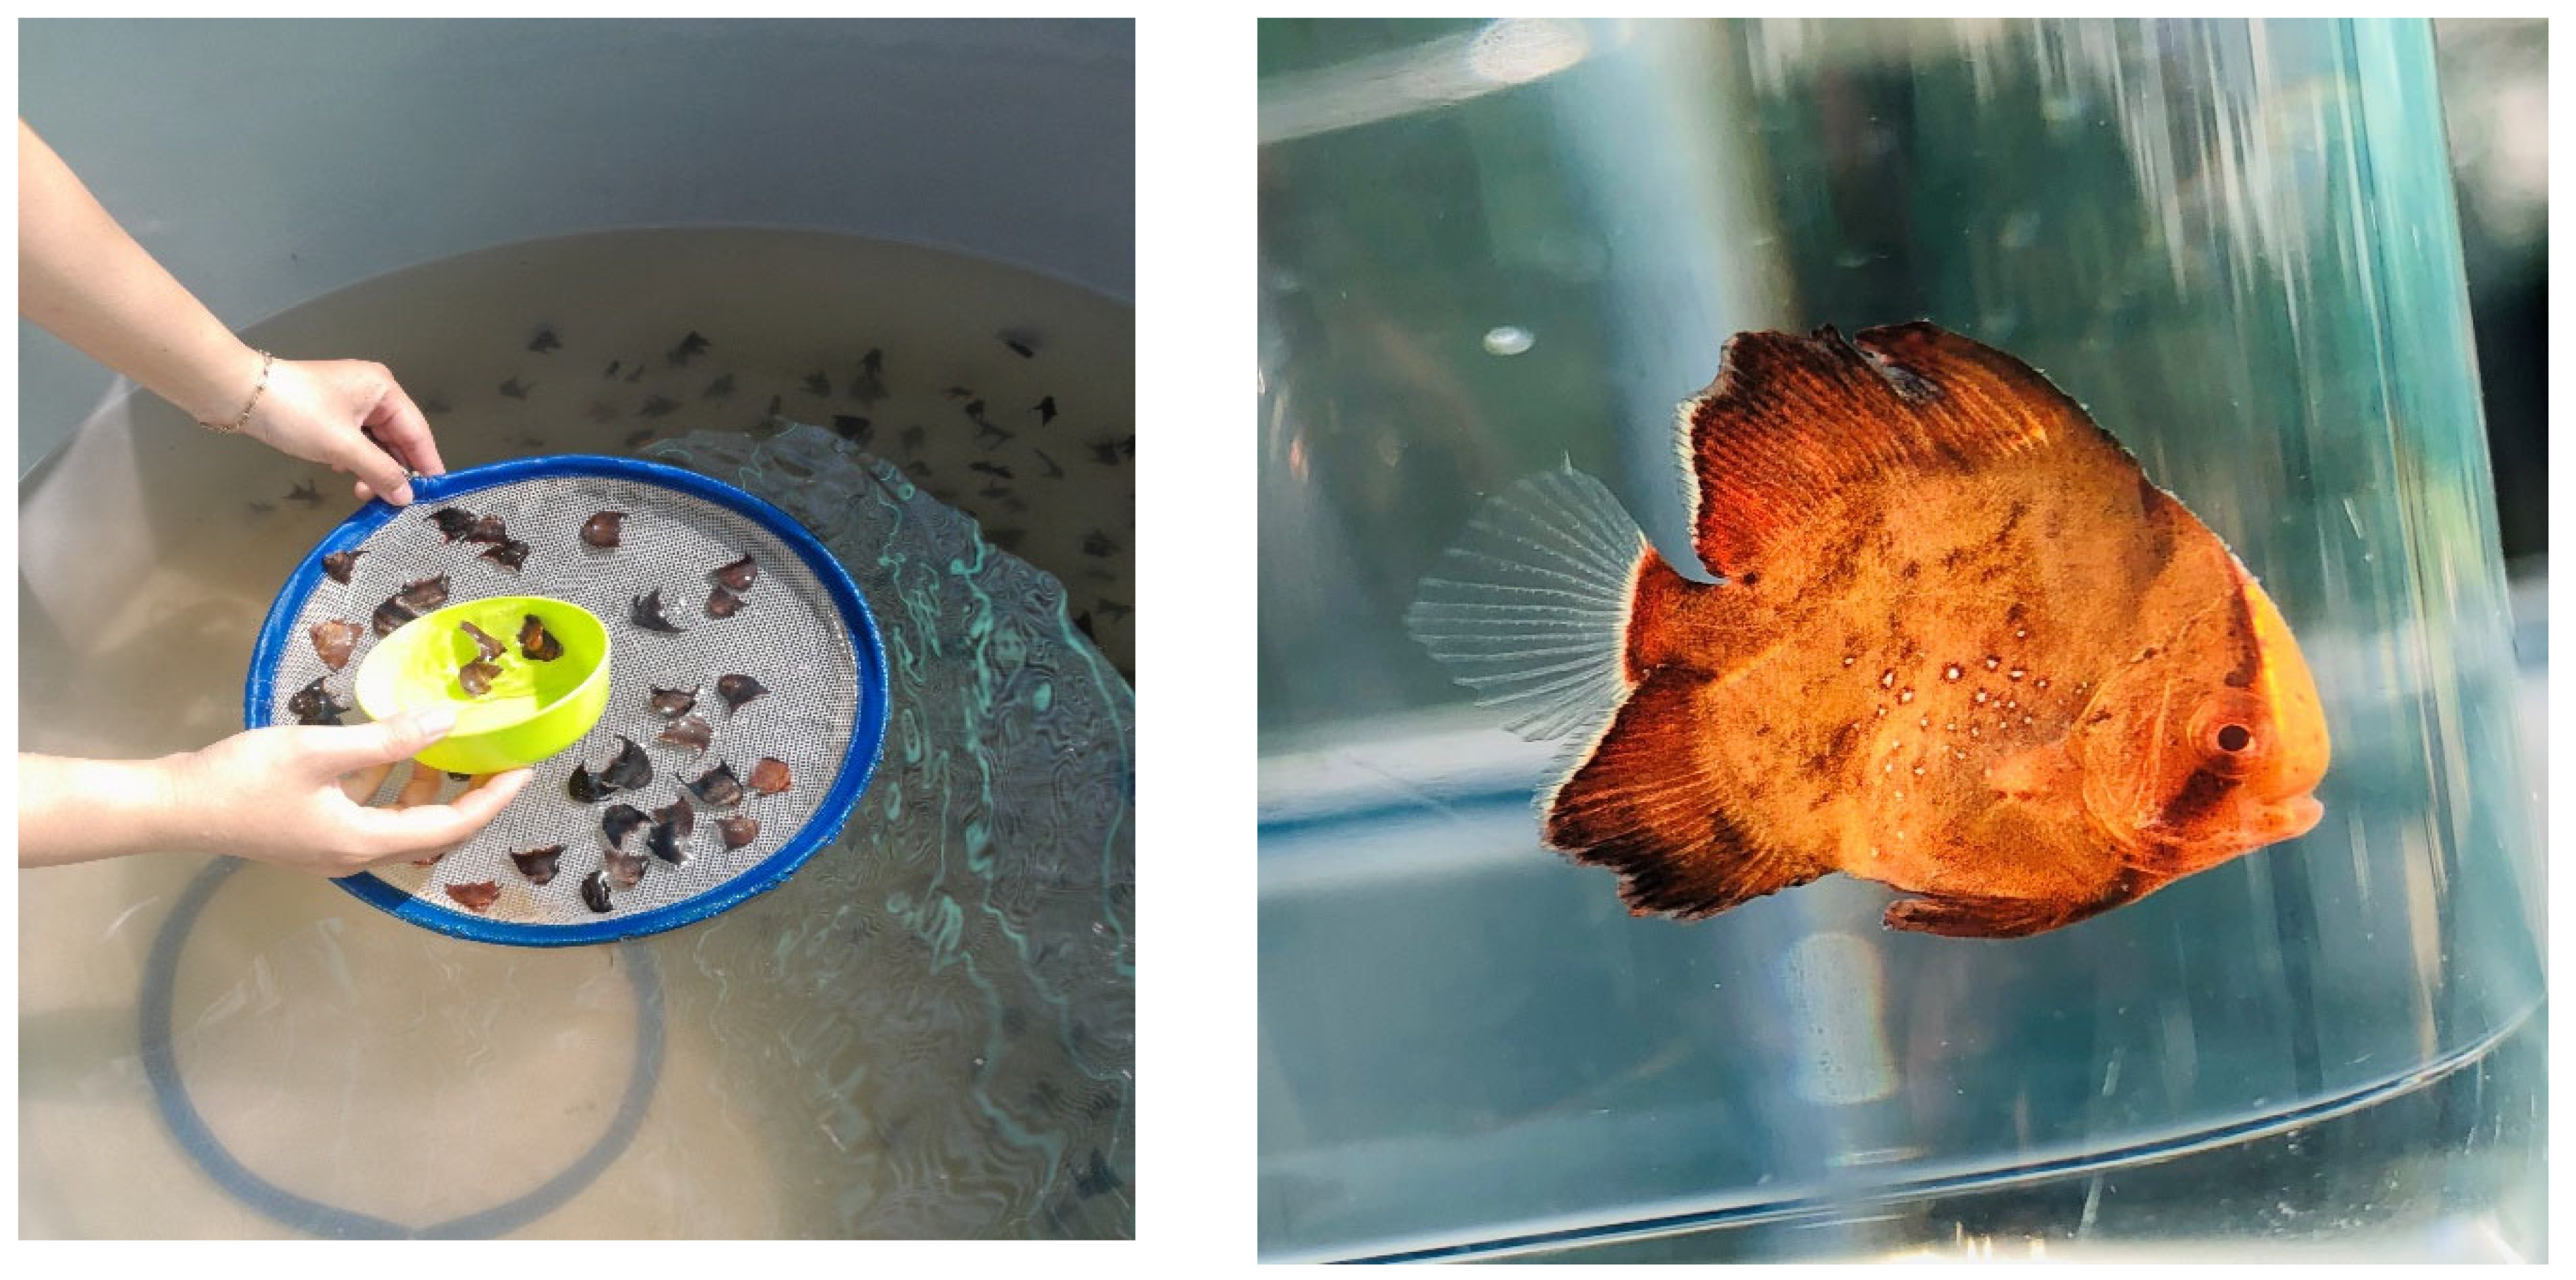
The effect of salinity on the fish was evaluated from the larval stage to fingerlings (1.5 - 6.0 cm). Fish included in the experiment had an initial size of 1.56 ± 0.10 cm and 0.20 ± 0.04 g/individual (Figure 1). The larvae were examined, and only healthy, equal-sized individuals without deformities or signs of disease were selected. Fish were reared at a density of 1 fish/L, equivalent to 250 fish per tank. Five levels of salinity were specifically tested as 10‰, 15‰, 20‰, 25‰ and 30‰.
Water source and salinity preparation
The water source used for the experiment was natural seawater with a salinity of 30‰. Water was pumped directly from the sea, then settled and treated with 10 ppm chlorine. After 2 days, the water was neutralized with sodium thiosulfate at a ratio of 1:1. In addition to the initial salinity of 30‰, lower salinities were mixed and adjusted by adding fresh water (chlorine removed). To mix the salinity corresponding to the experimental treatments, the formula S1 × V1 = S2 × V2 (with S1, V1 are the salinity and volume of initial seawater, S2, V2 are the salinity and volume of water mixing rod) was applied. Five large concrete tanks (8 m3/tank) containing salinities corresponding to 5 experimental treatments were used for daily water changes. Fish were domesticated from the initial salinity level of 30‰ to the corresponding salinity levels, with a decrease of 5‰/day, until reaching the required salinity. Then, the fish were acclimatized to this condition for 5 days before the start of the experiment. Salinity was measured using an S-Mill-E refractometer (ATAGO, Japan). Each treatment was conducted with 3 replications over a period of 28 days. Criteria to evaluate experimental results include total length, weight, condition coefficient, biomass, survival rate, and food utilization efficiency.
Feeding and care
Fish were fed with KAIO industrial feed (Marubeni Nisshin Feed, Japan), No. 5 and 6 equivalents to the particle size of 500 and 800 µm. Feed with nutritional ingredients (as described by the manufacturer) including crude protein > 50.0%, crude lipid > 6.0%, crude fiber < 3.0%, crude ash < 15%, calcium > 2.0%, phosphorus > 1.5%, moisture 10%. Fish were fed according to demand, divided into 4 times per day (around 7:00 a.m, 10:00 a.m, 1:00 p.m and 4:00 p.m.). When feeding, feed was adjusted according to the fish’s needs to minimize excess. The tank was siphoned combined with water changes once a day (around 7:00 a.m.). In addition to the salinity corresponding to each treatment, the environmental factors were checked and maintained within a suitable range for fish: temperature from 27 - 30oC, pH 7.8 - 8.2, dissolved oxygen > 5.0 mg/L and total ammonia nitrogen (TAN) content < 1.5 mg/L. The system was located outdoors, but was covered by a black net to reduce the light and temperature.
Data collection and calculation formulas
The total length (TL, cm) and body weight (BW, g) of fish at the beginning and end of the experiment (day 28) were determined by randomly weighing and measuring 30 fish per tank. Total length was measured from the fish’s snout to the end of the tail fin using a ruler with an accuracy of 1.0 mm. Body weight was determined with the Viet Nhat electronic scale with an accuracy of 0.01 g.
The deformity rate was determined by the percentage of deformed fish over the total number of tested fish applied to all remaining fish in the tank at the end of the experiment. Deformed signs of fish were identified including bent body, crooked jaw, and loss of operculum bone. The survival rate was determined at the end of the experiment by counting all surviving fish divided by the initial number of stocked fish.
Feed utilization efficiency was calculated based on the amount of feed eaten, unused feed (remaining in the box), and the amount of leftover feed siphoned after each feeding. To determine this amount of feed, 30 minutes after feeding, siphoned the remaining feed at the bottom of the tank and stored it in the freezer. This amount of feed was synthesized at the end of the experiment, and dried to 10% moisture (corresponding to the moisture content of the original food). Parameters used to evaluate food utilization efficiency include the amount of feed consumed or eaten daily calculated as a percentage of body weight and feed conversion ratio (FCR).
Specific growth rate in length (SGRL): SGRL (%/day): = [Ln(L2) – Ln(L1)] / T × 100%
Specific growth rate in weight (SGRW): SGRW (%/day) = [Ln(W2) – Ln(W1)] / T × 100%
Coefficient of variation of length (CVL): CVL (%) = SD / L2 × 100%
Coefficient of variation of weight (CVW): CVW (%) = SD / W2 × 100%
Condition factor (K): K (g/cm3) = 100 × W2/L23
Biomass (BM): BM (g/L) = TBW / V × 100%
Deformity rate (DR): DR (%) = Ndf / Nnf × 100%
Survival rate (SR): SR (%) = N2 / N1 × 100%
Feeding rate (FR, %BW/day): FR = 100 × FI / [(W1 + W2) / 2 × t]
Feed conversion ratio (FCR): FCR = FI / (W2 – W1)
where L1, L2 are the total length (cm) and W1, W2 are the body weight (g) of the fish at the beginning and end of the experiment. T is the experimental time (28 days). SDL, SDW are standard deviations of length and weight of fish. N1, N2 are the initial number of fish stocked and the remaining number of fish at the end of the experiment. FI is the amount of feed used (g). Ndf is the number of deformed fish, Nnf is the number of normal fish. TBW is the total weight of fish at the end (g). V is the volume of the rearing tank (liters).
Data analysis
Descriptive statistical parameters were calculated on Microsoft Excel 2016 software. Next, one-factor analysis of variance (one-way ANOVA) and Duncan’s test were used to compare differences. Statistical difference in average values of growth, survival rate, food utilization efficiency between treatments with significance level p < 0.05. All data were presented as mean (mean) ± standard error (SE).
Results
Growth performances
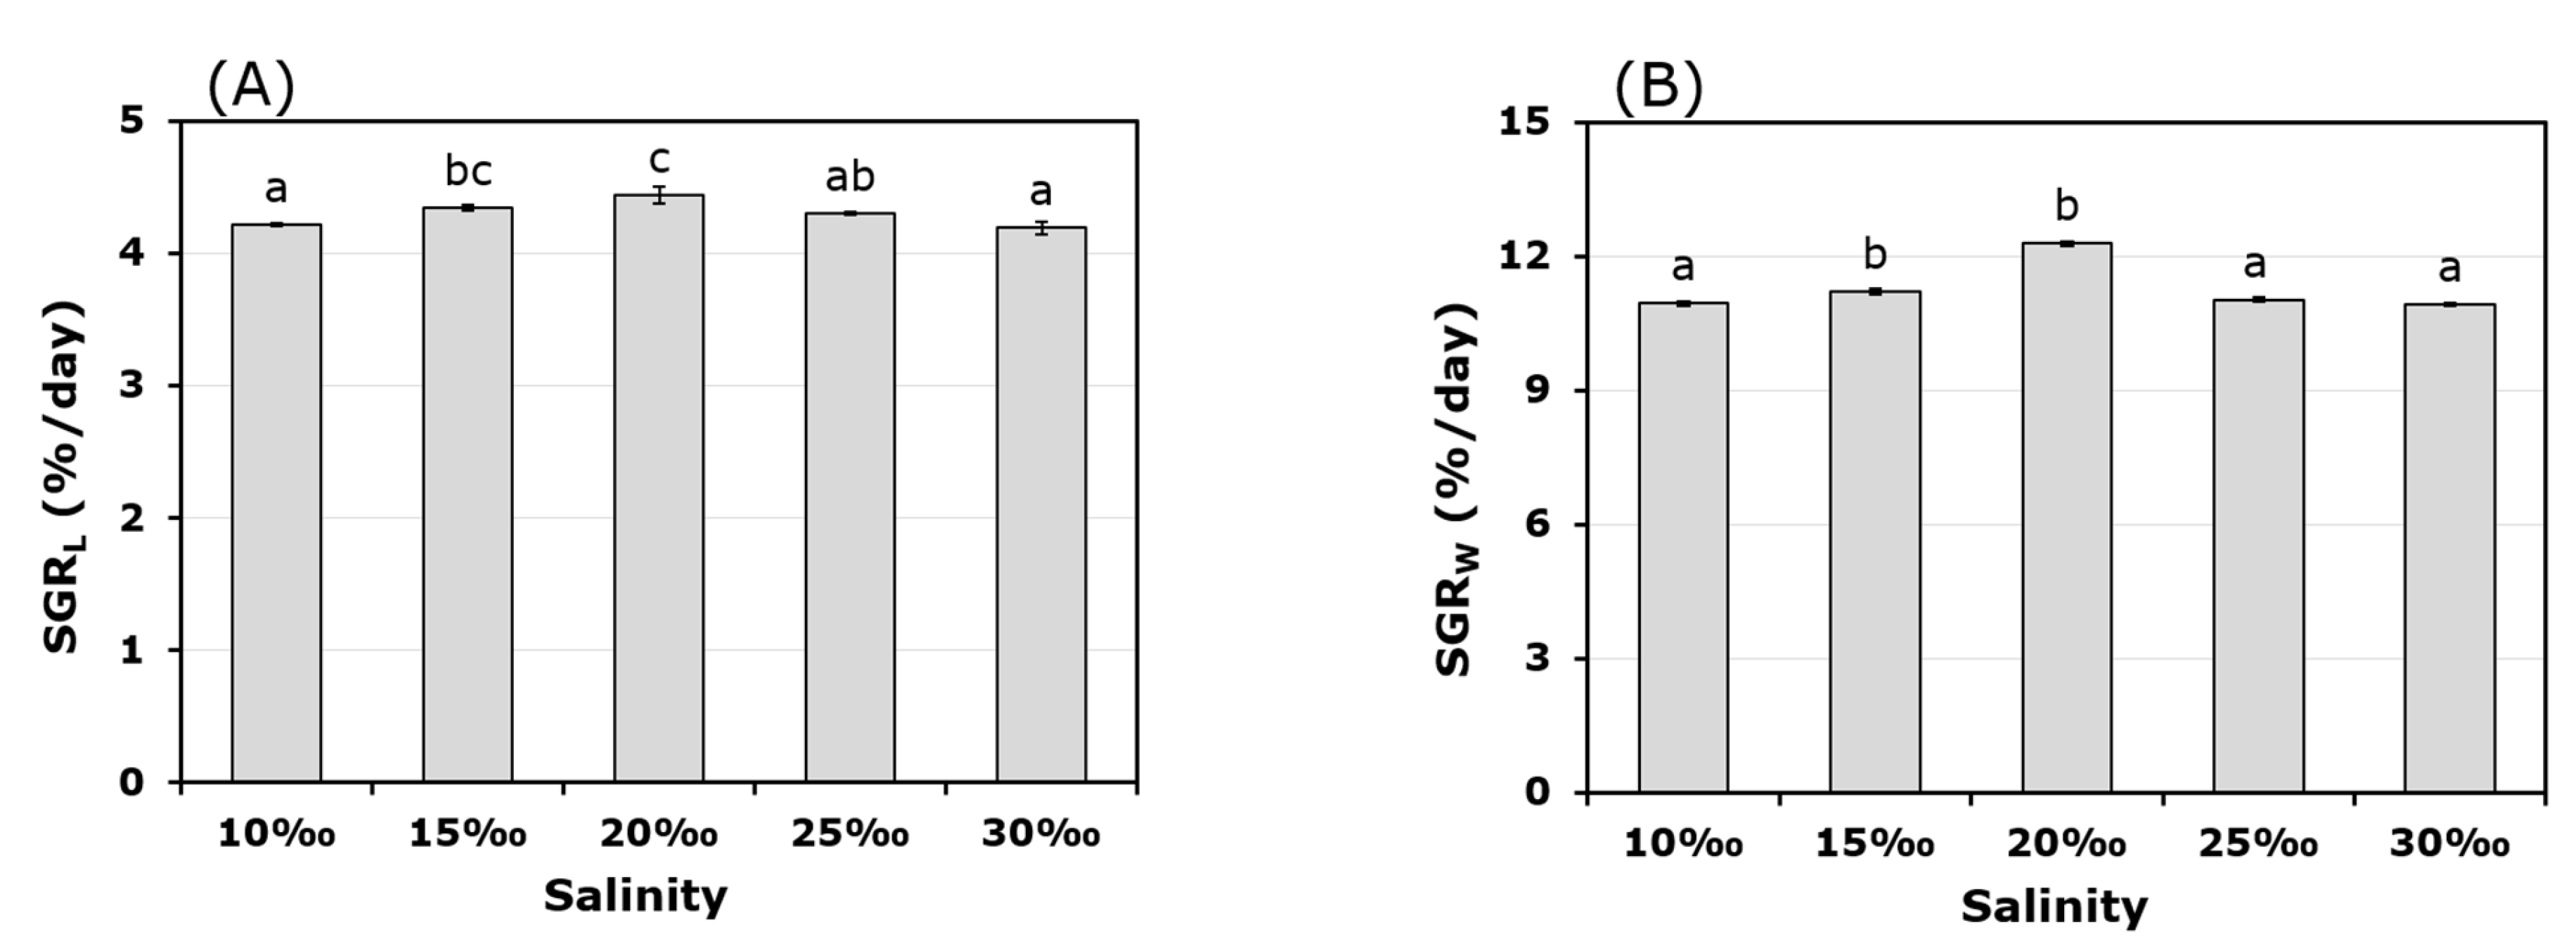
The impact of salinity levels on the growth of the fish is shown in Figure 2. Fish reared at a salinity of 20‰ achieved the highest length growth rate (4.44 ± 0.06%/day), followed by salinities 15‰ and 25‰ (4.34 ± 0.02 %/day and 4.30 ± 0.01 %/day, respectively), and lowest at salinities 10‰ and 30‰ (4.22 ± 0.01 %/day and 4.19 ± 0.05 %/day; P < 0.05). However, there was no significant difference between salinity levels of 20‰ and 15‰ or 10‰ and 30‰ (P > 0.05; Figure 2A). For body weight, fish reared at salinity levels of 15‰ and 20‰ achieved better results than the other salinity levels, 10, 25 and 30‰, respectively 11.28 ± 0.06 and 11.22 ± 0.06%/day versus 10.95 ± 0.05, 11.03 ± 0.05 and 10.92 ± 0.04 %/day (P < 0.05; Figure 2B). Thus, a salinity range between 15 - 20‰ is the most suitable for the fish.
_and_weight_(b)_under_different_salinity_levels.png)
Coefficient of variation, condition factor and biomass
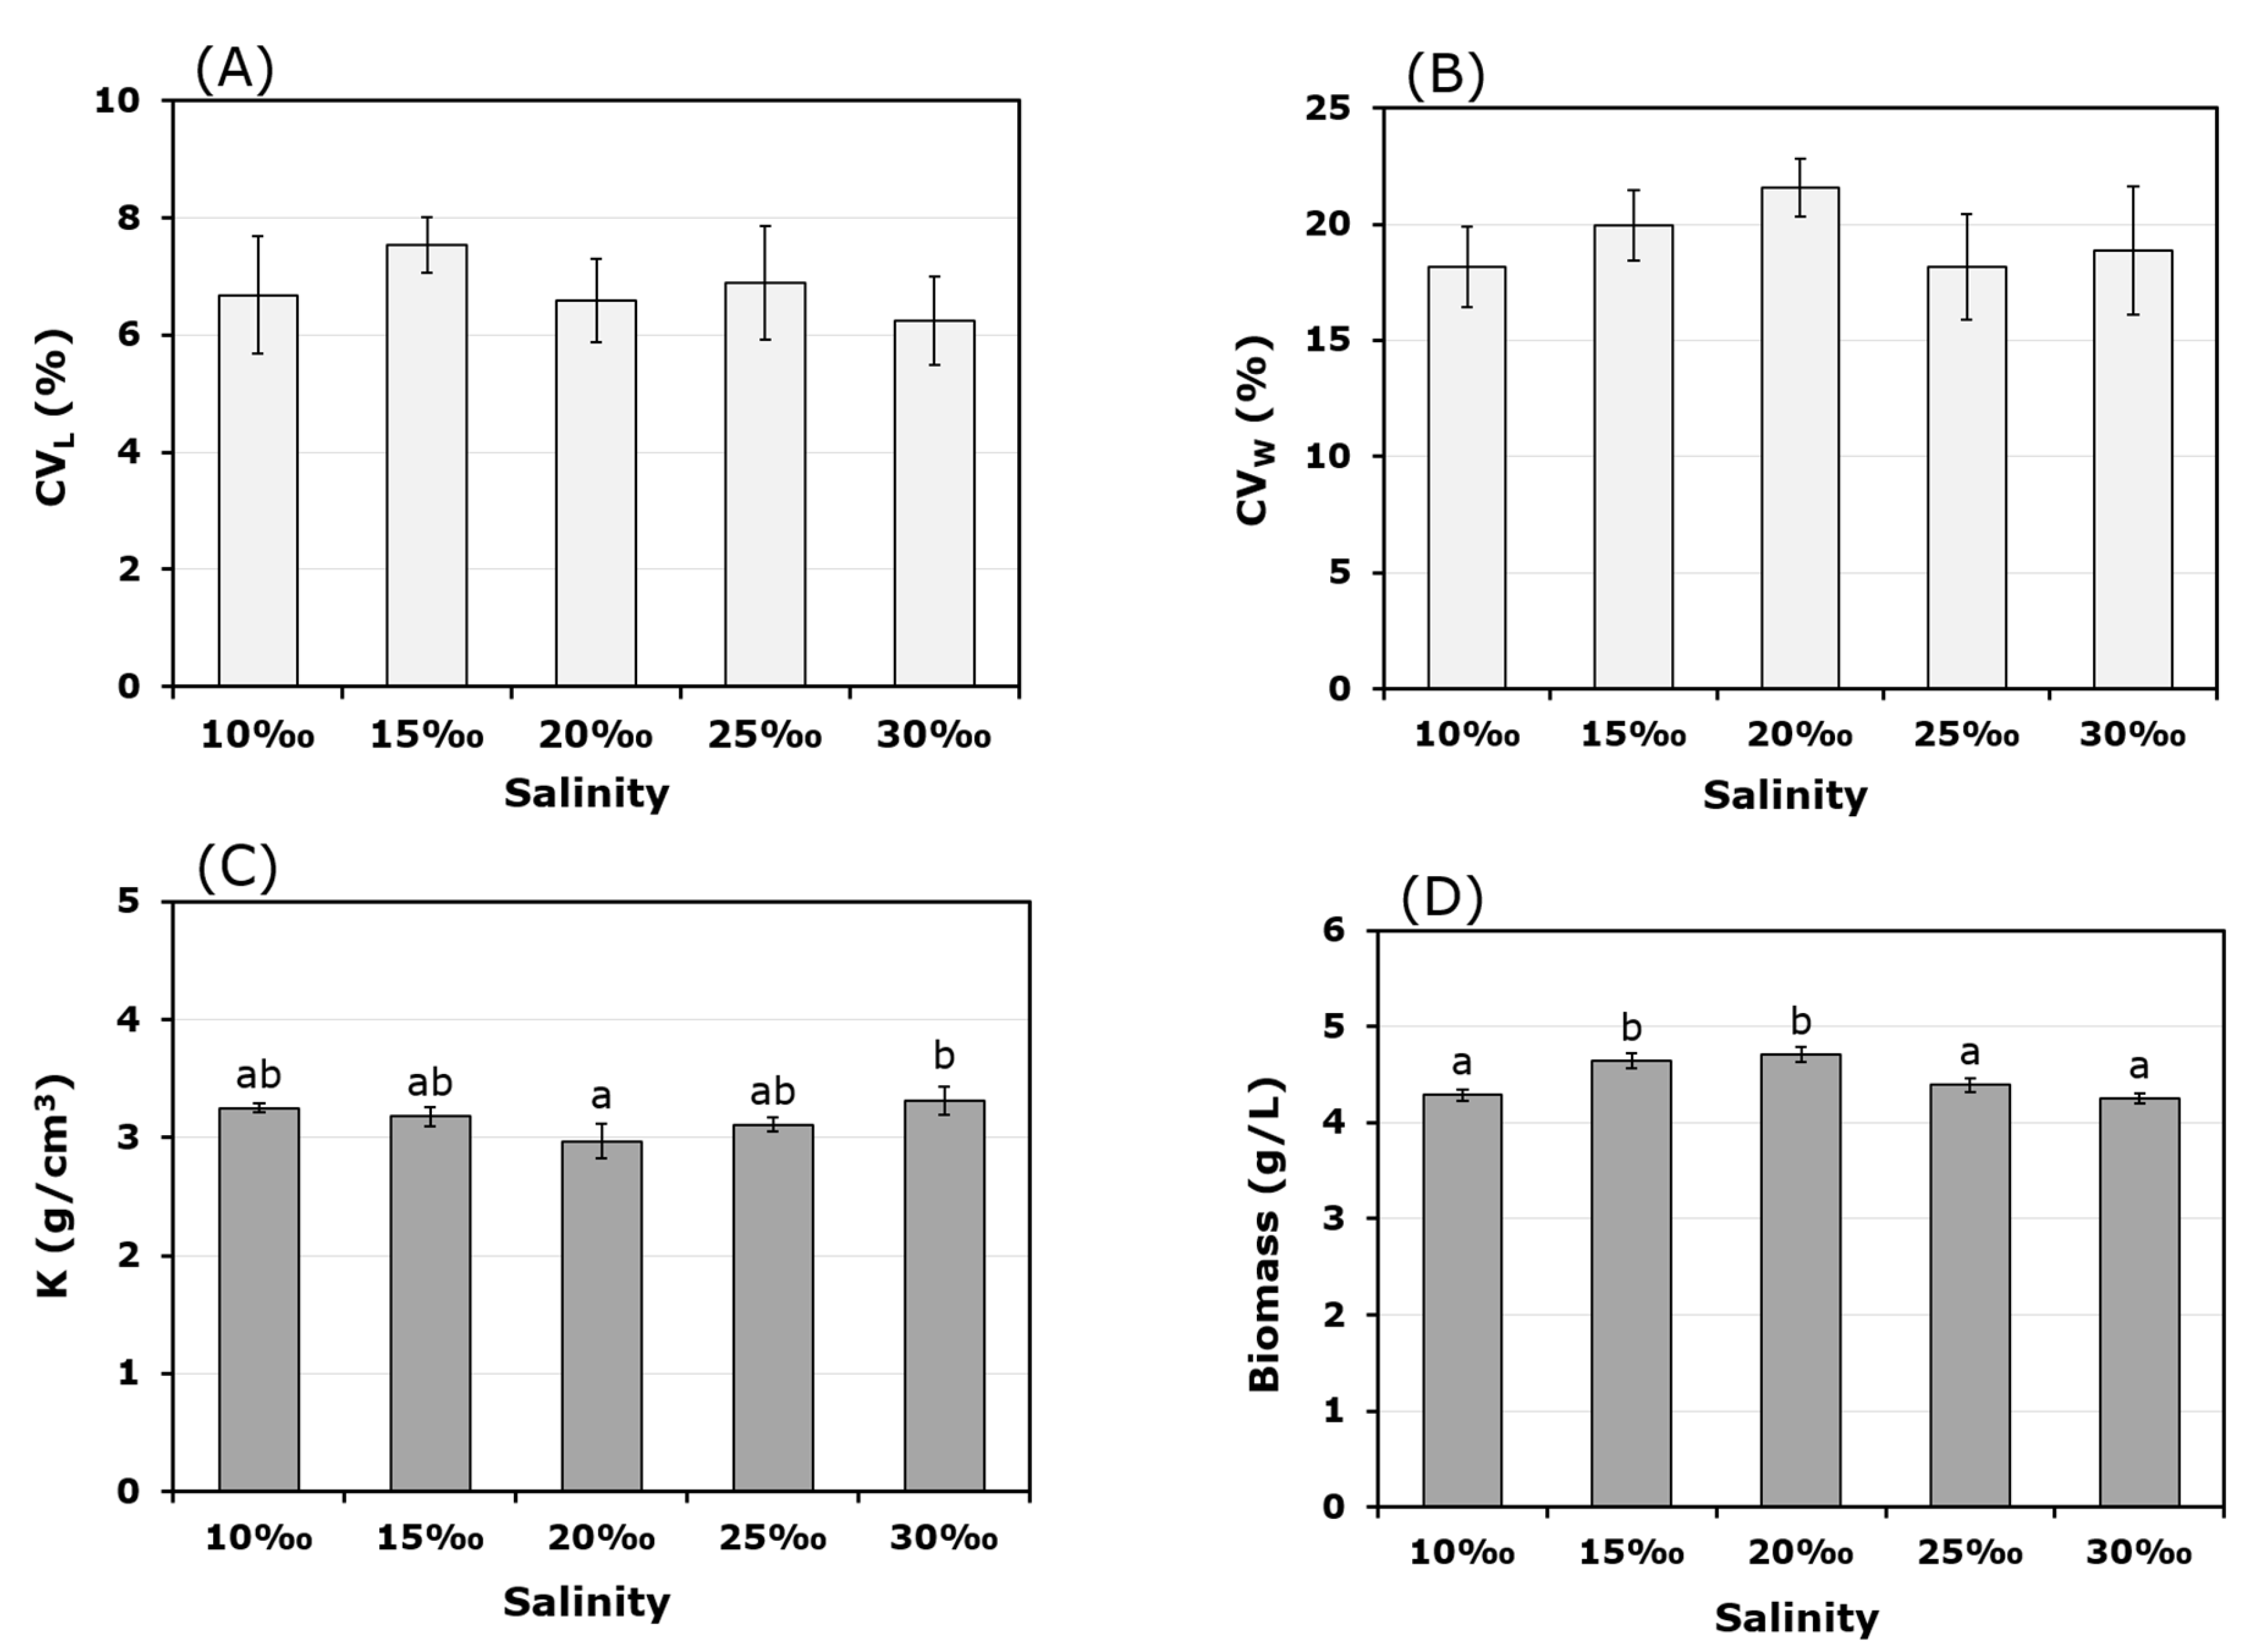
Salinity did not affect the coefficient of variation, length and weight of fish, ranging from 6.24 – 7.54% and 18.16 – 21.57%, respectively (P > 0.05; Figures 3A, 3B). Meanwhile, it had significant effects on the condition factor and fish biomass. Specifically, fish reared at a salinity of 30‰ achieved a higher condition factor than fish reared at a salinity of 20‰, 3.31 ± 0.12 versus 2.97 ± 0.15 g/ cm3, respectively (P < 0.05). However, the condition factor of fish in both treatments was not statistically different from the 10, 15 and 30‰ treatments, ranging from 3.11 - 3.25 g/cm3 (P > 0.05; Figure 3C).
_and_weight_(b)__condition_factor_(c)_and_biomass_(d.png)
Consistent with the salinity-dependent growth rate trend, larvae reared at 15 and 20‰ salinities exhibited a significantly higher biomass compared to those reared at 10, 25, and 30‰. The biomass measurements were 4.64 ± 0.08 and 4.71 ± 0.08 g/L for the 15 and 20‰ groups, respectively, and 4.29 ± 0.06, 4.39 ± 0.07, and 4.25 ± 0.05 g/L for the 10, 25, and 30‰ groups, respectively (P < 0.05; Figure 3D). Consequently, salinity levels between 15 and 20‰ can be determined suitable for larval rearing of this fish species.
Survival and deformity
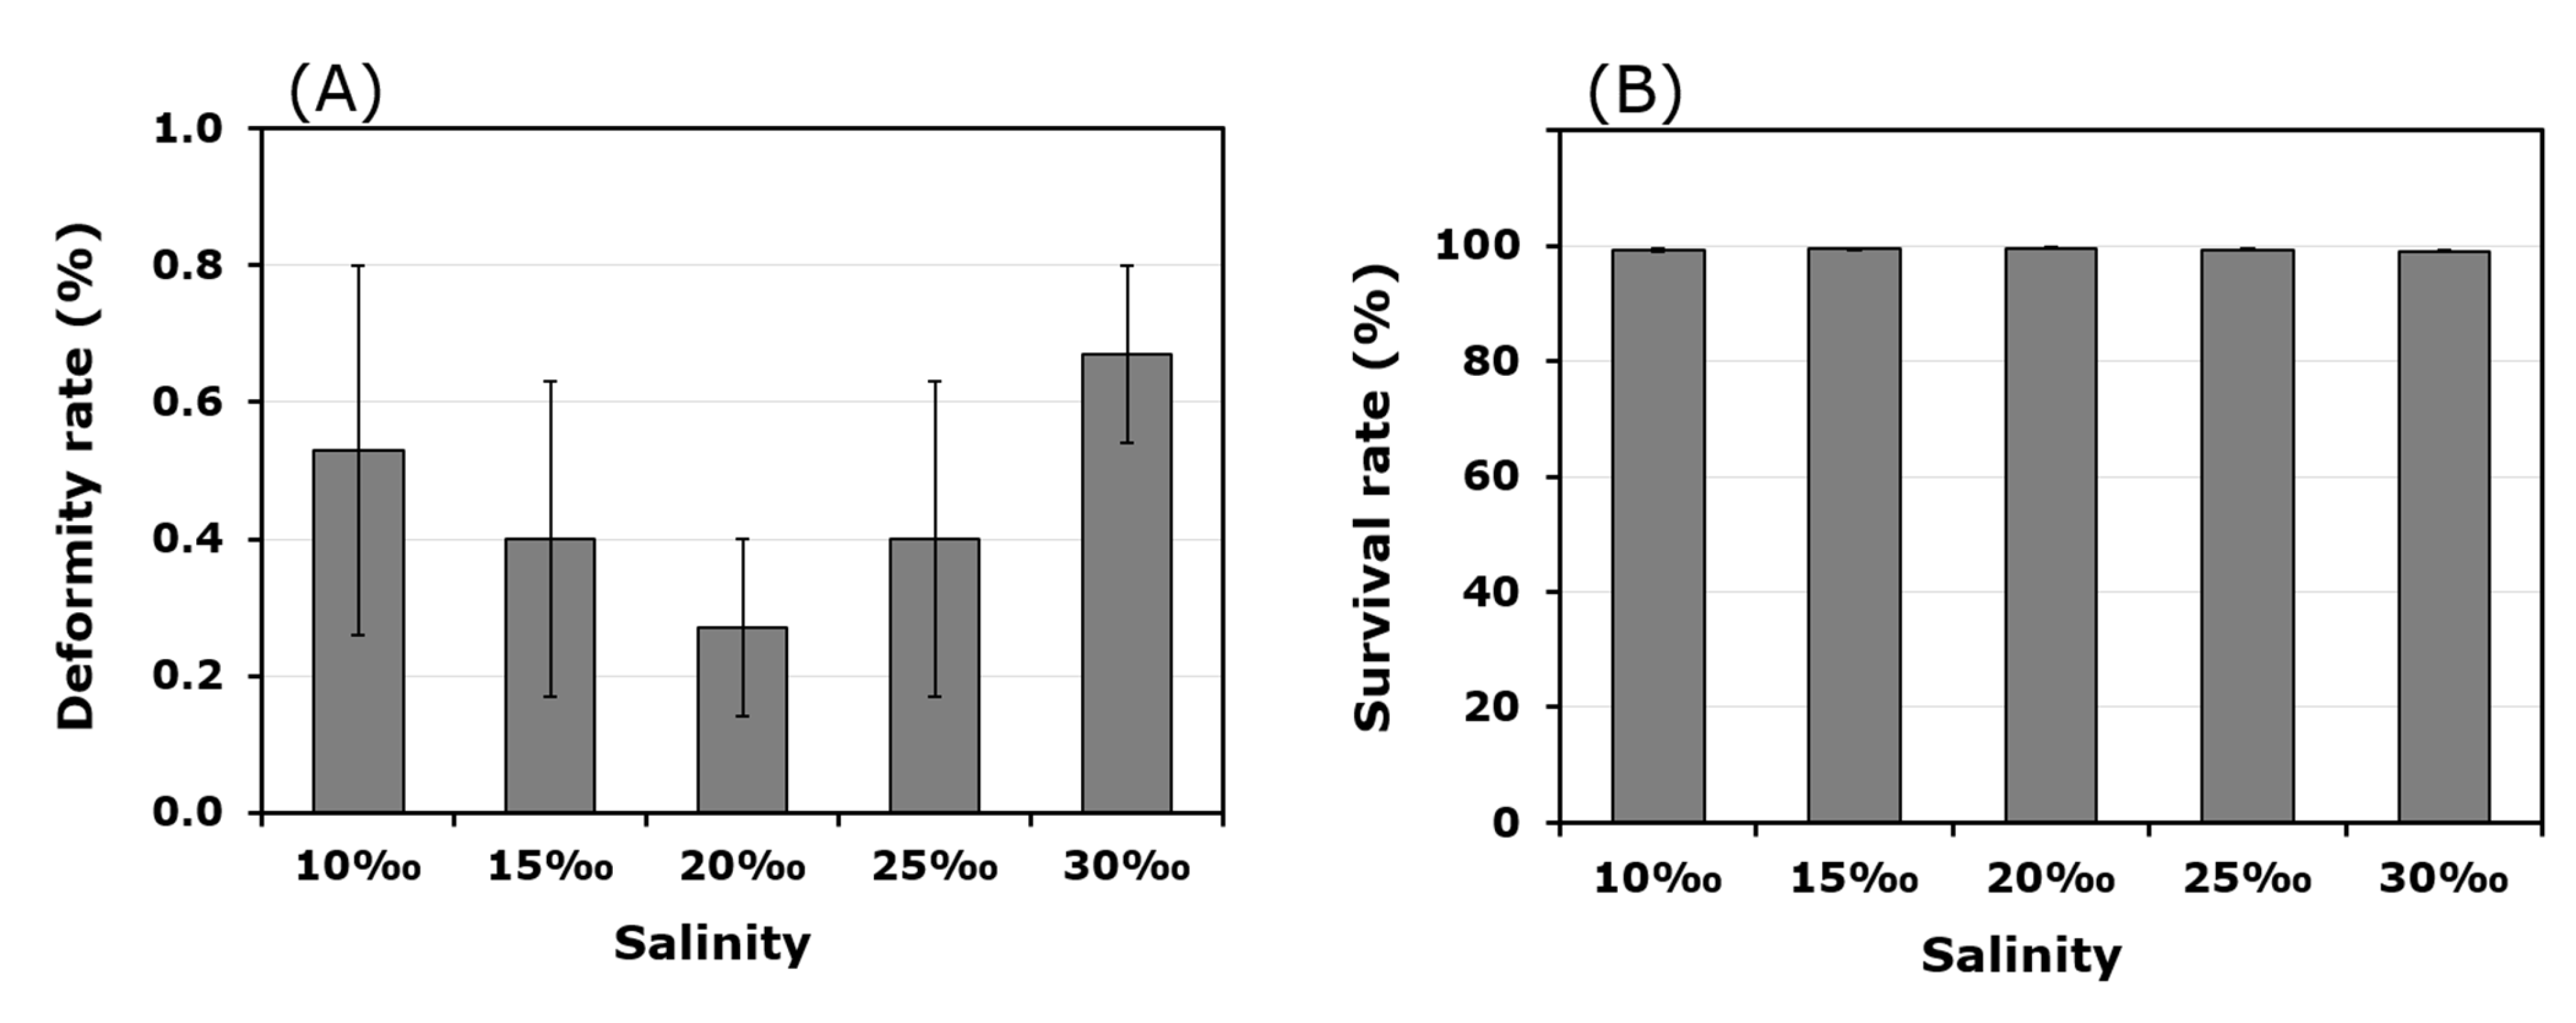
The salinity did not significantly affect the survival and deformity rate. After 28 days of rearing, the survival rate was very high, ranging from 99.07 to 99.60% (P > 0.05; Figure 4B) and the deformity rate was very low, ranging from 0.27 - 0. 67% (P > 0.05; Figure 4A).
_and_survival_(b)_of_the_fish_under_different_salinity_levels.png)
Feed utilization efficiency
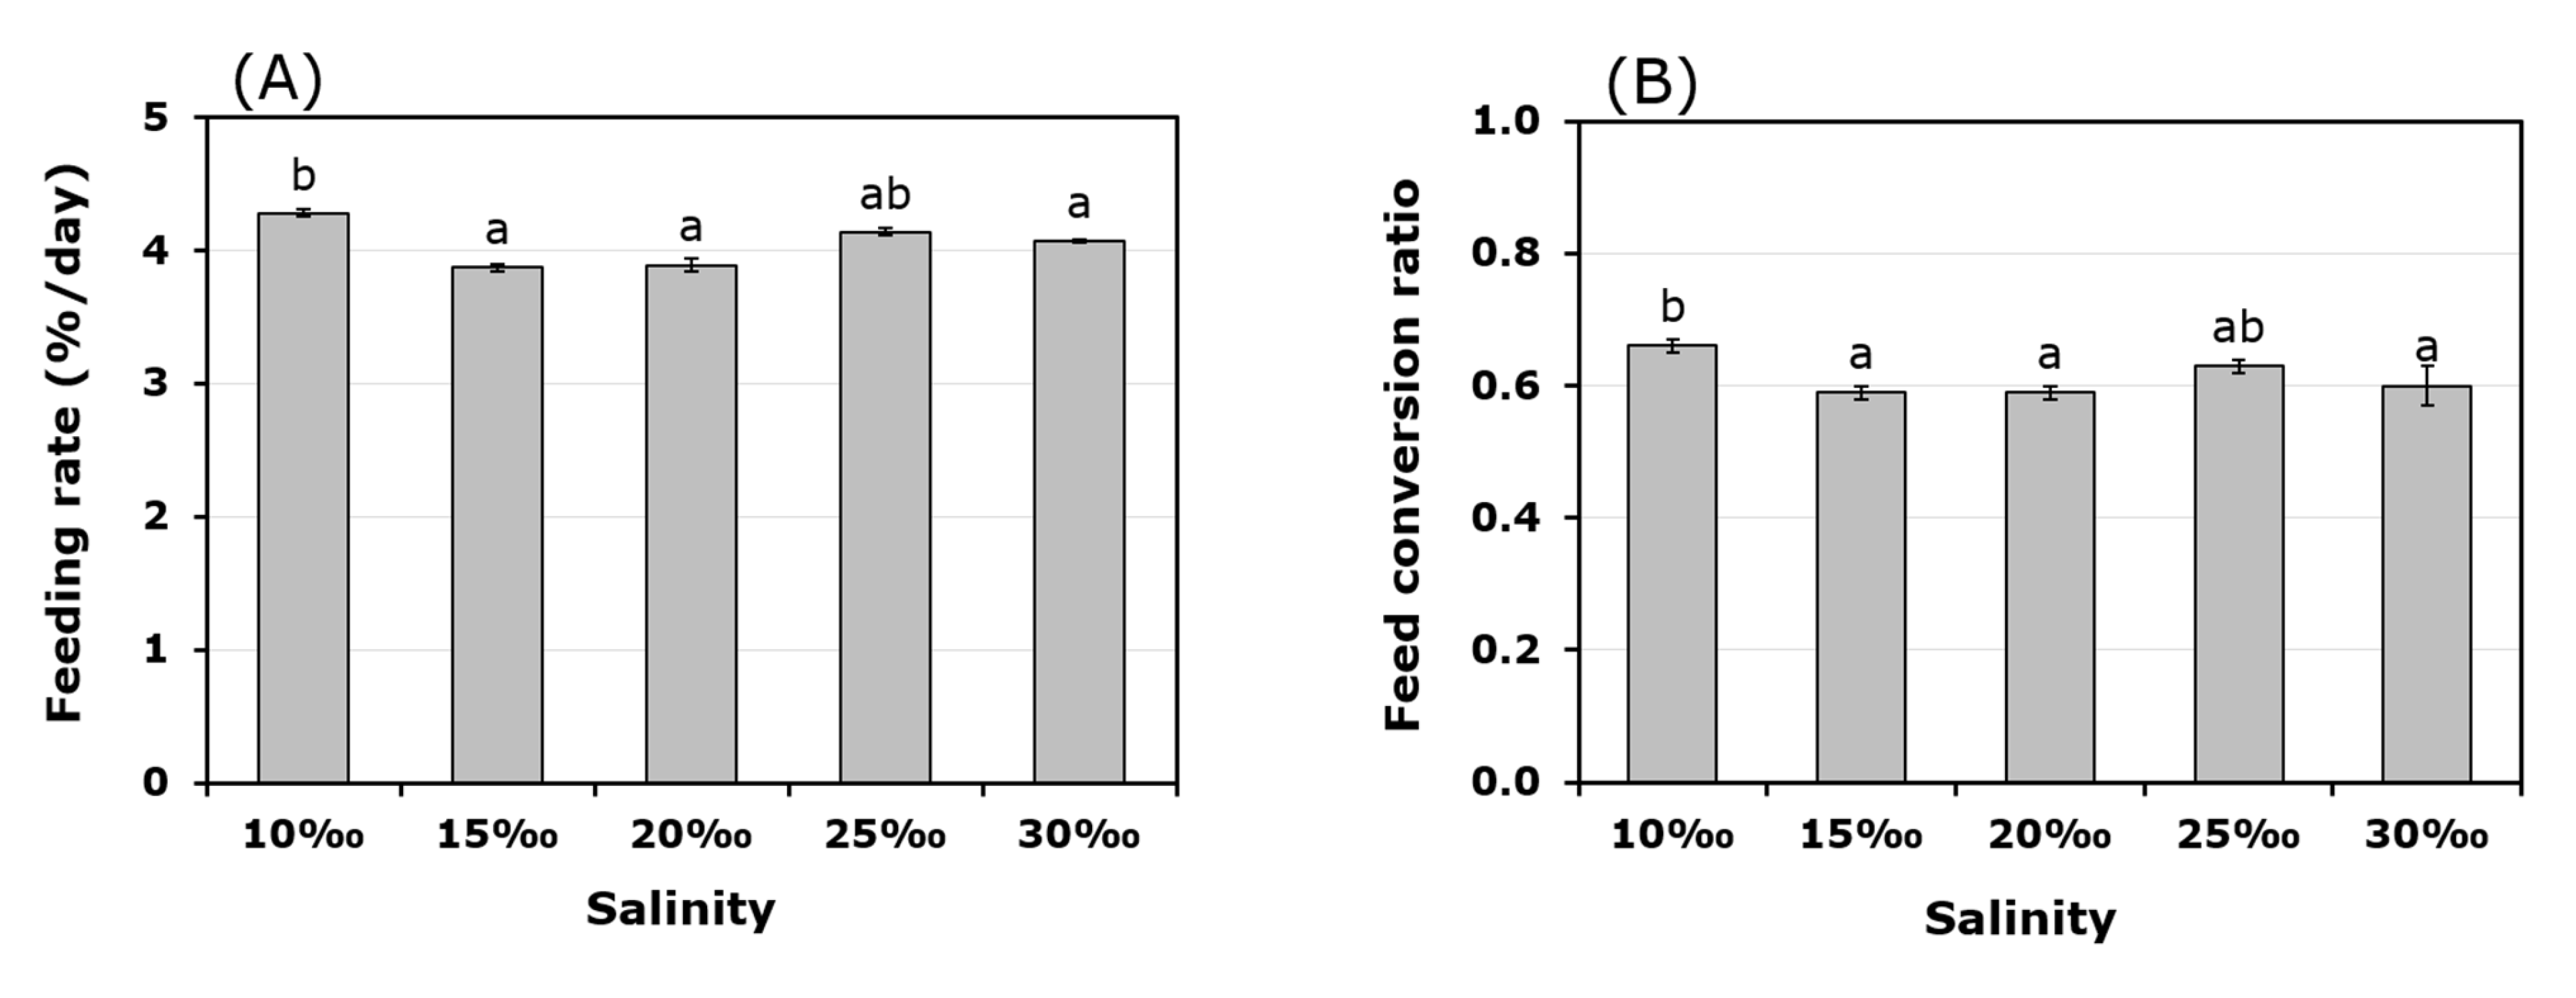
Feed utilization efficiency includes daily feed consumption (FR) and feed conversion ratio (FCR) of larvae in the treatments presented in Figure 5. It was observed that the larve reared at a salinity of 10‰ had a higher feed intake than those at salinities of 15, 20, and 30‰, with respective consumption rates of 4.28 ± 0.03 %/day compared to 3.87 ± 0.03, 3.89 ± 0.05, and 4.07 ± 0.01 %/day (P < 0.05). Nonetheless, the daily feed intake for fish at a salinity of 25‰ (4.14 ± 0.03 %/day) did not show a significant difference from the remaining treatments (P > 0.05; Figure 5A).
_and_feed_conversion_ratio_(b)_under_different_salinity_levels.png)
Fish reared at the salinities of 15, 20 and 30‰ had significantly lower food conversion coefficients than those reared at salinities of 10‰, 0.59 ± 0.01 respectively, 0.59 ± 0.01 and 0.60 ± 0.03 versus 0.66 ± 0.01 (P < 0.05). However, the feed conversion coefficient of fish reared at the salinity of 25‰ (0.63 ± 0.01) did not differ from fish reared at the other salinities (P > 0.05; Figure 5B). Thus, fish reared at salinity levels of 15, 20 and 30‰ showed the highest feed conversion efficiency.
Discussion
The environmental conditions, including hydro-chemical and aquatic factors, interact and directly or indirectly affect cultured organisms. To successfully establish a rearing process for marine fish like longfin batfish. It is crucial to determine suitable environmental parameters for fish larval rearing. Salinity has a great impact on the life of aquatic organisms in general.8 It serves as the basis for categorizing cultured organisms and determining their distribution areas.6,12 Many studies have shown that salinity affects the regulation of osmotic pressure in cultured animals, thereby influencing growth, survival rate, feed utilization efficiency, and health status.8 Furthermore, the ability of cultivated animals to acclimatize or adapt to salinity depends on many factors, including species, life stage, mineral composition and ratio in the water, natural distribution area, and domestication of animals.8,13,14 In this study, the optimal salinity range for the growth of longfin batfish larvae was determined to be from 15 - 20‰. However, salinity did not affect the condition factor, survival and deformity in this fish species. These findings indicate that the fish can adapt well to changes in salinity and that the salinity range tested, 10 - 30‰, is not a decisive factor in the survival of the species. This may be related to the natural habitat preferences during the seed to pre-adult stages, where they tend to inhabit coastal areas such as lagoons and shallow sea regions. Meanwhile, in the reproductive stage, they tend to reside in offshore waters or coral reefs with higher and more stable salinity levels.1 Similarly, for other marine fish species, habitat and reproductive migration behavior are believed to govern their ability to adapt to salinity.8,15
The impact of salinity on the growth and feed utilization efficiency of the present study has also been reported in several other marine fish. For example, a similar trend was observed in yellow croaker (Micropogonias furnieri), Atlantic halibut (Scophthalmus maximus) and white bream (Sparus sarba), that the growth and feed efficiency of fish reared at salinity levels of 15 – 19‰ were better than those reared at higher or lower salinity levels.16–18 Meanwhile, in the case of golden trevally (Gnathanodon speciosus), Ngo et al.15 discovered that the growth, survival rate and feed conversion ratio of the fish reared at high salinity levels (25 - 33‰) were better than those reared at low salinity levels (5 – 15‰). Similarly, cobia (Rachycentron canadum) exhibited better growth and survival rates at high salinity (30 - 35‰) compared to low salinity (5 - 15‰).19 Notably, when fish were domesticated, and the environment was supplemented with minerals, the aforementioned assessment criteria did not show significant differences within the salinity range of 5 - 35‰.20
For certain species of clownfish (Amphiprion spp.), some authors have found that they can adapt to a wide range of salinity (10 - 40‰) rather than high and narrow salinity levels (33 - 35‰) generally found in natural coral reefs.21,22 When 13 species of marine fish were domesticated and raised at low salinity levels (3 - 10‰), Wu and Woo12 found that salinity did not affect their growth and survival rates. These results further support the argument that the impact of salinity on cultured marine fish varies depending on the species, developmental stage, degree of domestication, and mineral supplementation in the farming system. Notably, even within the same golden trevally species, significant salinity effects on growth were reported by Ngo et al.15 This also suggests that the adaptability to salinity in certain marine fish species can be enhanced through domestication, and assessing their adaptability is necessary.
The impact of salinity on the growth, survival rate, and feed efficiency of marine fish is believed to be related to the maintenance of cellular homeostasis and body function through two essential processes that are metabolism and osmoregulation.8,10 Specifically, when living in an environment with excessively high or low salinity, fish must expend significant energy, around 20 - 50% of the total energy expenditure to regulate osmotic pressure, particularly to balance the concentrations of sodium ions (Na+) and potassium ions (K+) inside and outside the body.8,10,23 This high energy expenditure is trading off with the reduced fish growth rates and survival.8,10 Additionally, when salinity deviates from the optimal range, the feeding, digestion, and nutrient absorption activities of fish are significantly affected.11,24 This may explain why longfin batfish, when raised in excessively high or low salinity levels within the investigated range, exhibited significantly lower growth rates and feed utilization efficiency compared to those raised in moderate salinity levels.
Despite identifying the effects of salinity on the growth, survival, and feed utilization efficiency of longfin batfish, there are some limitations in the current study. The impact of salinity on the ability to regulate osmotic pressure, digestive activity, nutrient absorption, and the stress level of the fish has not been fully evaluated. These factors are important for explaining the differences in outcomes observed in this study and should be further investigated and clarified. Therefore, our findings suggest that the appropriate salinity for the nursery phase of longfin batfish to be 15 - 20‰, and this salinity range should be applied in practice to improve the economic and technical efficiency of the production process. At the same time, this information can serve as a basis for planning the aquaculture of this economically valuable marine fish species.
In conclusion, salinity exerts a substantial influence on various growth performances of the longfin batfish, including length and weight, biomass, and feed utilization efficiency. Notably, longfin batfish larvae reared at a salinity range between 15-20‰ exhibited superior performance compared to other salinity levels. However, salinity did not significantly affect the condition factor, deformity and survival. Our findings provide valuable information for better salinity management in the longfin batfish larval rearing practices.
Acknowledgement
This research is funded by the Department of Sciences and Technology, Khanh Hoa Province, Vietnam, under contract number 1863/HD-SKHCN dated 25-11-2022.
Author contributions
Conceptualization: Hung Quoc Pham (Lead), Manh Van Ngo. Methodology: Hung Quoc Pham (Equal), Manh Van Ngo (Equal), Dung Tran Van (Equal), Thuy Thi Nguyen (Equal). Formal Analysis: Dung Van Tran (Equal), Thuy Thi Nguyen (Equal), Manh Van Ngo (Equal). Writing – original draft: Manh Van Ngo (Equal), Hung Quoc Pham (Equal), Dung Van Tran (Equal). Writing – review & editing: Hung Quoc Pham (Equal), Manh Van Ngo (Equal), Dung Van Tran (Equal). Funding acquisition: Hung Quoc Pham (Lead).