


Introduction
The black tiger shrimp (Penaeus monodon) is an economically and globally important marine species in China’s aquaculture industries.1 However, there are only a few artificially selected P. monodon breeding lines worldwide, which has seriously hindered the sustainable development of the P. monodon industry.2 Genetic evaluation of economic traits is a basic work in selective breeding; heritability and genetic correlation, as important genetic parameters in quantitative genetics, are important parameters in breeding value estimation, selection index estimation, and genetic progress prediction.3 Growth traits are quantitative traits. The genetic mechanism of growth traits is affected by the internal microgene system and external environmental factors, resulting in continuous and normal distribution of phenotypic variation. At the same time, different growth traits may be controlled and influenced by similar gene linkage groups and similar environmental factors. The phenotype of growth traits showed various variations and had a certain relationship with each other.4 Therefore, in the breeding program of P. monodon, it is necessary to investigate one growth trait alone and evaluate several other growth traits simultaneously.5 There are only a few theoretical studies on the genetic breeding of P. monodon, focusing on evaluating genetic parameters for a few traits, such as body weight, body length, and stress resistance.5 So far, there is no report on the evaluation of genetic parameters of multiple growth traits under the condition of feeding roughage.
Heritability is not only determined by the unique characteristics of the traits but also affected by the population’s genetic structure and its environment.6 The heritability of different breeding generations is often dynamic.7 Adjusting the selection scheme according to the heritability and genetic correlation changes is an important prerequisite to ensure the sustainable accumulation of breeding traits.8 In this study, 15 families of P. monodon were constructed, and the standardized growth traits were tested in an indoor tank covered by the greenhouse. Combined with different fixed and random effects, the second generation (G2) of P. monodon was evaluated to provide a theoretical basis and practical guidance for the multi-traits breeding of P. monodon.
Materials and methods
Bloodstock mating and maturation
The bloodstocks used in the experiment were the core breeding population of new roughage-resistant strains bred by the genetics research group and breeding of P. monodon in South China Sea Fisheries Research Institute, Chinese Academy of Fishery Sciences (SCSFRI, CAFS). In May 2020, 82 full-sib families were constructed using the Yang9 method: the male shrimp with a well-developed spermatophore was selected, and the spermatophore was gently squeezed. The obtained spermatophore was placed inside the spermatheca of female shrimp with tweezers.
Larval rearing and marking
The larvae were cultured according to Yang’s method.9 At 45 days after the PL10 stages, 180 individuals were randomly selected from each family. Different combinations of fluorescent substances (red, yellow, green, blue, purple, and orange, purchased from Qingdao Starfish Instruments Co., Ltd) were injected into the sixth abdominal segment as family markers. Fifteen families with similar construction dates (±2d) were selected from 82 families and mixed cultured in cement ponds (500 cm × 400 cm × 150 cm) in three indoor tanks. A total of 60 individuals per family were set in each pond for the comparative test of growth traits. The composition and nutrient content of the experimental diet are shown in Table 1.
Data collection
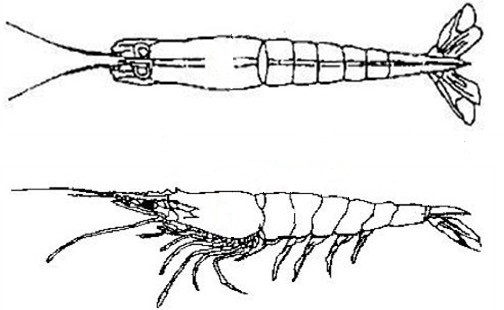
After 56 days of culture, all the P. monodon in each pond were collected, and their family ID was read according to the fluorescent markers. The body length (BL), carapace length (CL), carapace width (CW), carapace height (CH), first abdominal segment width (FSW), and first abdominal segment height (FSH) of P. monodon were measured with vernier caliper (precision 0.01 mm) (Figure 1).10

Statistical analysis
SAS software was used to test the normal distribution of the data. The variance components were estimated by the constrained maximum likelihood method
Yij=μ+bdi+aj+eij
In the above formula, is the measured value of individual traits, is the population mean value of traits, b is the regression coefficient of BW to the test value of harvest traits before polyculture, is the BW (covariant) value before polyculture of the ith family, is the additive genetic effect (random effect) value of j-tailed shrimp, and is the random residual effect value. The heritability, phenotype, and genetic correlation of growth traits were calculated using the WOMBAT software.11
Results
Statistics of growth traits of P. monodon
Seven growth traits of 15 families of P. monodon were measured and counted after 56 days. The coefficient of variation of BW is the largest, which is 47.53% (Table 2), and the variation is shown in Figure 2; the coefficient of variation of BL is 11.52% (Table 2), and the variation is shown in Figure 3. The coefficient of variation of body size traits ranged from 11.52 to 14.56%, and CL had the largest coefficient of variation. The results showed abundant phenotypic variations in growth traits of P. monodon. The variation degree of BW was the highest, and CH’s was the lowest.


Phenotypic correlation analysis and curve fitting among growth traits
Phenotypic correlation analysis was carried out on seven growth traits of P. monodon, and the curve relationship among them was estimated by different curve fitting. The phenotypic correlations of the seven growth traits were significant, with medium and high correlations: BW and BL had the highest correlation (0.93), followed by BL and Cl (0.91); the correlation between CW and FSH was the lowest (0.53) (Table 3). Through different curve fitting, the power function model Y=aXb was the best fitting method for the relationship between BW and the other six individual size traits of P. monodon. The R2 of the power function model between BW and BL was the highest (0.95), and the fitting curve was shown in Figure 4; the second was BW and CL, R2 of the power function model was 0.86 (Figure 5). The lowest was between BW and FSH; R2 of the power function model was 0.42 (Table 4).


Genetic parameters and correlation analysis of growth traits
The heritability range of growth traits was (0.25 ± 0.03) - (0.41 ± 0.13), and the heritability of growth traits was medium and high (P<0.01). The heritability of BW was the highest, followed by CL and CH, and FSH was the lowest (Table 5). The random residual variance of seven growth traits was greater than that of additive variance (the sum was phenotypic variance), indicating that the environment greatly affected growth traits. The standard deviation of heritability evaluation ranged from 0.03 to 0.18, which indicated that the accuracy of heritability assessment of growth traits could be improved if the number of individuals continued to increase.
The results of the genetic correlation analysis are shown in Table 3; the seven growth traits had a highly positive correlation, and the statistical test results were significant (P<0.01). Among them, the genetic correlation between BW and BL was the highest (0.99), followed by BL and Cl (0.98); the lowest genetic correlation was between CW and FSH (0.71). The standard deviation of genetic correlation was less than 0.1, indicating that the evaluation accuracy of genetic correlation was high (3.2).
Discussion
Genetic variation of growth traits
The growth traits of P. monodon were divided into weighing traits (such as BW) and body size traits (such as BL, Cl, CW, and CH). The basis of growth breeding is genetic variation in the breeding population, which requires significant and rich variation in growth phenotype between individuals and families. This study showed that seven growth traits of the G2 population of P. monodon had high genetic variation levels, and the variation degree of BW (weighing traits) was higher than that of body size traits such as BL, CL, and CH. The coefficient of variation of BW was more than 45%, and the variation of BL, Cl, and CH were less than 15%. Similar results were also found in crustaceans such as Litopenaeus vannamei, Penaeus japonicus, Fenneropenaeus chinensis, and Portunus trituberculatus, and the variation degree of weighing traits was higher than that of body size traits.12–15 Other studies found that the genetic variation coefficient of growth traits of crustaceans ranged from 20% to 35%, which was much higher than that of terrestrial animals (7%-10%).16 In this study, we found that the growth traits of P. monodon have a high level of genetic variation, especially for BW, which can obtain rapid breeding progress. However, it also shows that the genetic regulation mechanism is complex, and the breeding improvement stability is poor. Therefore, we must refer to the body size traits with relatively stable genetic variation such as BL and CL.
Phenotypic correlation and growth characteristics of growth traits
As a kind of crustacean, the growth and reproduction of P. monodon were closely related to molting, and its growth pattern was gradual. Growth characteristics such as BW and BL could be completed by molting. At the same time, the growth characteristics of P. monodon were different in different growth environments and stages.17 There was a high correlation between BW, BL, and CL in the growth traits of F. chinensis18 and L. vannamei.19 BL significantly affected BW, and the power function model Y=aXb was the best-fitting curve for BL and BW.18,19 The results of this study showed that the phenotypic data of seven growth traits of P. monodon, including BW, BL, and CL, were positively correlated. The most significant effect on BW was the body size traits of BL and CL, which measured the body length of P. monodon. The b value of the fitting curve between BL and BW was 3.26, which indicated that the growth rate of BW in P. monodon was slightly faster than that of BL and close to uniform growth. The b value of the fitting curve between CL and BW was 2.95, indicating that the growth rate of BW in P. monodon was faster than that of CL, showing a non-uniform growth. The studies of L. vannamei and P. japonicus showed that the growth characteristics of L. vannamei and P. japonicus in different growth stages were mainly the growth of BL in the early rapid growth stage. They gradually transformed into the growth of BW in the middle and late growth stages. Still, environmental factors such as temperature, salinity, and food greatly influenced the growth characteristics.19,20 This study showed that BW was the fastest-growing G2 breeding population, and the body length indexes such as BL and CL were relatively slow. To reduce the influence of environmental factors, it was necessary to investigate the breeding potential of multiple growth traits simultaneously.
Evaluation of multi-trait genetic parameters for growth traits
In recent years, great progress has been made in evaluating genetic parameters of multiple growth traits in crustaceans.5 The heritability of BL, Cl, and BW of F. chinensis was studied using animal models, and the results showed that the heritability of BL and BW was moderate, and their growth traits had great potential for genetic improvement. The growth traits could be improved by continuous breeding.14 The narrow sense heritability of BL, Cl, and BW of F. chinensis was estimated by variance components of full-sib and half-sib. The results showed that the heritability of BL and BW ranged from 0.36 to 0.51 and 0.04 to 0.29, respectively, which indicated that these growth traits had high heritability and great potential for growth improvement.21
Similarly, the heritability of growth traits of 5-month-old L. vannamei was estimated by using variance components, and the results showed that the growth traits such as BW and BL of 5-month-old L. vannamei belonged to medium and high heritability levels, which showed high selection breeding potential.19,22 The study of the heritability of BL and BW traits of P. japonicas also showed high breeding potential, and the heritability of BL and BW ranged from 0.25 to 0.39.23 This study showed that the heritability of seven growth traits ranged from 0.25 to 0.41, which belonged to medium and high heritability levels, consistent with the high heritability level of the growth traits evaluation population in P. monodon. According to the heritability, we estimated the breeding value of the retained individuals and then selected the seeds according to the breeding value: the individual breeding method is better for the high heritability traits, and the family breeding method is better for the low heritability traits. At the same time, the high heritability traits could be improved by pure breed continuous breeding, and the low heritability traits can be improved by using different line cross-breeding.16 In addition, related studies have shown that compared with terrestrial animals, aquaculture animals had greater fecundity, and genetic inbreeding leads to a rapid decline in traits during breeding. Selecting a family breeding strategy to control inbreeding decline was appropriate to ensure stable breeding progress.12 The growth traits of P. monodon belonged to the medium and high heritability level, and the genetic improvement potential was high. To control inbreeding and ensure continuous breeding and improvement, it was suitable to adopt the strategy of family breeding combined with individual breeding.
Previous studies have shown a complex correlation among terrestrial animals’ growth, disease resistance, and breeding traits. Generally, there was a positive correlation between growth traits and a negative correlation between growth, disease resistance, and breeding traits.24 The genetic correlation among traits should be evaluated to achieve different breeding objectives. Otherwise, breeding failure would be caused by a strong negative correlation among traits.5 The study on the genetic correlation of growth traits of F. chinensis showed a high positive correlation between the growth traits (0.82-1.00). The highest genetic correlation was CW and BL, and the lowest was FSL and the second abdominal segment width. It indicated that growth traits such as BL and CW could be indirectly selected and improved by genetic positive correlation.21 The study about the genetic correlation of BL, CL, BW, and abdominal segment length of F. chinensis showed that there was a highly positive genetic correlation (0.832-0.920) among the growth traits. The genetic correlation between BW and abdominal segment length was the highest, and that of BL and CL was the lowest.18 The study on the genetic correlation of growth traits of L. vannamei showed that there was a high positive genetic correlation (0.750-0.976). The highest genetic correlation was BW and BL; the lowest was the BL and the third abdominal segment back height. It indicated that the growth and breeding target of L. vannamei could be BW or BL, and other growth traits would be improved simultaneously due to positive genetic correlation.25 This study showed highly positive genetic correlations among seven growth traits of P. monodon. The highest genetic correlation was 0.99 between BW and BL, and the lowest was 0.71 between CW and FSH. The results showed a highly positive correlation between growth traits, which suggested that any growth trait could be used as a reference for breeding, and other growth traits could be indirectly selected to improve the growth of P. monodon.
Conclusions
In conclusion, the genetic variation level of BW in the G2 population was the highest, while BL was relatively stable. There was a high positive genetic correlation between BW and BL, and BL and BW could be selected as the key traits of growth and breeding to be included in the selection index. Based on the genetic evaluation results of BW and BL in the G1 population of P. monodon, three-dimensional morphological data (CL, CW, CH) were added to the genetic evaluation of the G2 population of P. monodon. The evaluation results showed that the body size growth traits of G2 population were medium and high heritability, and the most significant influence on BW was body size traits such as BL and CL. In the follow-up study, we can further carry out multiple trait breeding for body height and body width traits according to market demand to improve the morphological fullness of commercial shrimp. We can also carry out a genetic evaluation on growth traits (head and breast weight and abdominal quality) reflecting the proportion of edible parts of shrimp to increase the proportion of edible parts and meet the needs of shrimp food processing.
Author Contributions by CRediT
Conceptualization: Song Jiang (Lead). Writing – original draft: Song Jiang (Lead). Writing – review & editing: Song Jiang (Equal), Qibin Yang (Equal). Supervision: Song Jiang (Lead). Formal Analysis: Jieyi Wang (Equal), Dewei Kong (Equal). Investigation: Jieyi Wang (Equal), Dewei Kong (Equal). Methodology: Wanli Yang (Lead). Funding acquisition: Jianhua Huang (Equal), Lishi Yang (Equal), Yundong Li (Equal). Resources: Falin Zhou (Lead).
Funding
This study was funded by the National key research and development plan project (2022YFD2400104), Youth Fund of Hainan Natural Science Foundation (321QN351), Industrial Technology System of Modern Agriculture (CARS-48), Central Public-Interest Scientific Institution Basal Research Fund, South China Sea Fisheries Research Institute, CAFS (2023TD34,2021SD13), Special fund project for scientific and technological innovation and industrial development in Dapeng New Area (KJYF202101-08), Fangchenggang Science and Technology Plan Project (Fang ke AB22013015), 2022 Provincial Rural Revitalization Strategy Special Fund Seed Industry Revitalization Project (2022-SPY-00-002, 2022-SPY-00-006, 2022-SJS-02-001), Special scientific research and trial production project in Sanya (2020KS02), Beihai Science and Technology Plan Project (Beikehe 202181013).
Institutional Review Board Statement
The use of all the shrimps in these experiments was approved by the Animal Care and Use Committee at the Chinese Academy of Fishery Sciences (CAFS), and we also applied the national and institutional guidelines for the care and use of laboratory animals at the CAFS.
Informed Consent Statement
Not applicable.
Data Availability Statement
The authors confirm all data are available in the article.
Conflicts of Interest
The authors declare no conflict of interest.