

Introduction
Many invertebrates and vertebrates, including chordates, arthropods, echinoderms, cnidarians, and others, lay eggs that develop ex vivo in the water environment. These envelopes are simple coats in cnidarians and nematodes, but they are acellular membranes with or without an external jelly coating in chordates, arthropods, echinoderms, and mollusks.1 In addition to the inner vitelline membrane, teleost fish eggs, pterygoid insect eggs, and cephalopod eggs are all covered by an external chorion membrane. Chorion and vitelline membranes cooperate to protect growing embryos from external pressures in the water column, including mechanical forces, predators, and infections.2
According to studies on teleost fish eggs, the chorion functions as a reliable physical barrier against the ingestion of particle pollutants. For instance, it was discovered that microplastics (MPs) particles adhered to the villi on the surface of chorion in medaka fish eggs but were absent in the eggs.3 Since cuttlefish are cephalopods, they lack villi, and a recent analysis discovered MPs in the cuttlefish embryo.4
In the last few decades, the production of plastics has increased significantly, from 500 to 350,000 tons annually.5 In all seas, including the pelagic, abyssal, and polar zones, over 10% of this plastic pollution makes its way into marine environments, and the accumulation of plastic debris becomes a severe issue.6 More than 92% of the plastic waste in the ocean nowadays is made up of MPs, described as polymer particles typically having a diameter of less than 5 mm. They are mostly made from manufactured plastic beads or the fragmentation of larger plastics.7 Recent estimates place the amount of MPs particles in the world’s oceans at between 15 and 51 trillion, or 93,000 and 236,000 tons.8 As reported, there may be more than 100,000 microplastic particles per cubic meter in coastal waters.9
Cuttlefish Sepiella japonica is an endemic local species in the East China Sea.10 Breeding reproduction is essential for this species because of its excessive consumption and ecological deterioration.11,12 MPs suspended in the surface water of the Yangtze estuary, which is the major habitat for the mariculture of S. japonica, can reach up to 4137.3±2461.5 n/m3.13 Fertilized eggs are deposited on or adhered to the coral reef from April to June. Seawater is used to soak the fertilized eggs. The juveniles promptly emerge and have typical swimming abilities after a month of in vitro incubation. It was the most vulnerable during the hatching period. The marine environment’s dissolved oxygen, pH, temperature, and light had little effect.14 Although there is no solid evidence that MPs can stick to S. japonica eggs, a study on zebrafish eggs with a similar structure revealed that MPs of various sizes in the seawater performed differently when connected to the chorion surface. Smaller MPs of 1 to 5 µm can cover the entire chorion surface, but relatively large MPs of 10 to 20 µm are only attached in patches.15 MPs have been proven to obstruct the egg’s pores, which is likely to minimize the supply of oxygen to the embryo, resulting in hypoxia and the embryo hatching postponed.16 In order to benefit both the host and themselves, these symbiotic bacteria release some compounds that the host needs for growth and development in addition to using the nutrients from the host. Both the host and parasitic bacteria adapt to changes in the seawater environment. According to studies, MPs exposure can alter the intestinal microbiota of marine Organisms, increasing the abundance of Firmicutes and decreasing the abundance of Bacteroides.17–19 However, the response of the bacterial community surrounding the fertilized eggs of S. japonica to the presence of marine MPs is still unavailable. Thus, in this study, we quantify the emergence rate, emergence cycle, and deformity rate of the fertilized eggs of S. japonica; physiological indicators such as respiratory oxygen consumption rate and ammonia nitrogen excretion rate of the fertilized eggs of S. japonica; to reveal the impact of MPs exposure on the diversity of bacteria on the fertilized eggs of S. japonica at the genumacro genome using macro genome sequencing to explore the potential impact of MPs on S. japonica. The findings will yield evidence that can be used to shape future regulations surrounding the hazards of marine MPs pollution.
2. Materials and methods
2.1. Cuttlefish preparation
The experiment was conducted from October 2020 to August 2021. The S. japonica eggs were collected from the parent species’ natural broods in an indoor cement pond that was maintained by an aquatic breeding facility in Zhoushan, Zhejiang Province. The parents were lowered into the cement pool (6 m×4 m×1.4 m) with carcasses measuring (11.5–12.4 cm in length, 7.5–8.2 cm in breadth, and 109.5–159.4 g in body weight). Natural seawater with a salinity of 24.4–28.2, a water temperature of 19–21 °C, a pH of 7.38–8.21, a COD of 5.45–7.5mg/L, continuous aeration, and a 50% water daily change is used for parent breeding and egg incubation.
2.2. Seawater preparation
Nine tanks of 50 L in total (triplicates for each of the three MPs treatments: Control, 5 µm, and 0.5 µm) were used in our investigation. In this investigation, commercial microspheres (ACMETM, 5 µm polystyrene (PS), 3.6×10⁸ items/mL, and 0.5 µm PS, 3.6×10¹¹ items/mL) were used to prepare the MPs suspensions. According to previous research, the MPs concentration was set to 104 items/L, representing the concentration at the primary location for S. japonica culture.20 Airflow was performed throughout the experiment to keep the microsphere particle suspensions in place.
2.3. Effects of MPs on the early development of S. japonica
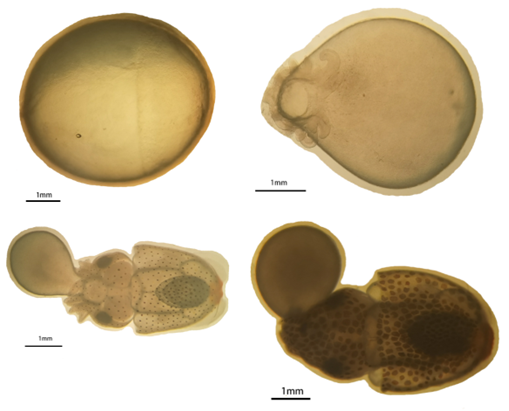
For spawning, the air-exposure techniques linked to flow stimulation were used. In a nutshell, 20 participants were moved to the 0.3 m2 square tank after 4 hours of air exposure. A submersible pump maintained an emergent flow of seawater. Eggs were collected using a 400-mesh net for 10 minutes. The eggs were transferred to the tanks containing the right seawater for the cuttlefish hatching and development after being rinsed in the appropriate seawater (15 eggs/mL). Each tank’s 3×100 eggs were sampled at four different developmental stages: the gastrula stage (GS), the organization formed stage (OF), the endoskeleton formation stage (EFS), and the embryo just before hatching (EBH). The samples were then stored with 4% paraformaldehyde for further study. The standard for morphological classification was displayed in Figure 1. Most fertilized eggs developed to the morphological criteria in Figure 1 for stage time classification.

The hatching rate (%) was calculated by samples taken at 4 stages after fertilization.
Hatching rate = (the fertilized eggs meet the morphological classification standard) / 100 × 10021 is referred to morphological classification when determining whether larvae have a distorted or normal shape.
2.4. effects of MPs on physiological indexes of S. japonica
For the test to measure oxygen intake and ammonia excretion rate at 4 stages, a conical flask with a volume of 500 mL was filled with saltwater after sand filtering. The bottleneck was sealed with paper film after 100 fertilized eggs or embryos had been placed within. Three parallels were set for each treatment, and the test was run at (20±1) °C. The eggless conical flask was used as a placeholder. The examination lasted for six hours.
Oxygen consumption rate measurement: Dissolved oxygen (DO) was measured using WINKLER iodometry. The oxygen consumption rate is calculated as OR=[(DOt-DO0) V]/(Nt). Where: DOt-DO in the respiratory bottle at the test’s end, mg/L; DO0-DO in the blank bottle at the test’s finish, mg/L; OR- oxygen consumption rate per egg, mg/(ind.·h); V stands for the volume of water in the conical flask, N for the number of fertilized eggs in the bottle, T for the length of the test, h.
The ammonia excretion (AN) was calculated using the SKALARSAN++interval flow analyzer. Ammonia rate calculation: NR=[(AN0-ANt) V]/(Nt). Where: ANt-AN in the respiratory bottle at the conclusion of the test, mg/L; AN0-AN in the blank bottle at the end of the test, mg/L; NR-ammonia excretion rate per egg, mg/(ind.·h); V stands for the volume of water in the conical flask, N for the number of fertilized eggs in the bottle, T for the length of the test, h.
2.5. 16S RNA gene sequencing and analysis
35-40 eggs were randomly selected from each tank at the embryonic stage to create 9 samples for 16S RNA gene sequencing and further analyses. Total genomic DNA was extracted using a DNA Extraction Kit and following the manufacturer’s instructions. NanoDrop and an agarose gel were used to confirm the DNA’s purity and amount. To be processed further, the extracted DNA was diluted to a concentration of 1 ng/L and kept at -20°C. Using the barcoded primers and Takara Ex Taq, the diluted DNA was employed as a template for the polymerase chain reaction (PCR) amplification of the bacterial 16S ribosomal ribonucleic acid (rRNA) genes (Takara). V3-V4 (or V4-V5) variable portions of 16S rRNA genes were amplified for bacterial diversity investigation using universal primers 343F and 798R (or 515F and 907R for V4-V5 regions). Variable portions of the 18S rRNA gene were amplified using the universal primers 817F and 1196R to investigate Eukaryota diversity. ITS I variable areas were amplified to investigate fungal diversity using the universal primers ITS1F and ITS2.
Using gel electrophoresis to assess amplicon quality, AMPure XP beads (Agencourt) were used to purify the amplicons before being amplified for a subsequent cycle of PCR. The final amplicon was measured using a Qubit dsDNA assay kit after purification using AMPure XP beads. For further sequencing, identical amounts of purified amplicons were pooled.
FASTQ format was used for the raw sequencing data. Using Trimmomatic software,22 paired-end readings were preprocessed to identify and remove ambiguous bases (N). Low-quality sequences with an average quality score of 20 were also terminated using a sliding window trimming method. Using FLASH software, paired-end readings were assembled after cutting.23 Ten base pairs (bp) of least overlap, 200 bp of maximum overlap, and a maximum misfit rate of 20% made up the assembly parameters. To further denoise the sequences, reads with base pairs shorter than 200 bp or ambiguous or homologous sequences were eliminated, whereas reads with 75% of bases higher than Q20 were kept. Chimera-containing reads were then found and eliminated. Using the QIIME software, these two actions were completed (version 1.8.0).24 Using V search software with a 97% similarity criterion, clean reads were subjected to primer sequence removal and clustering to produce operational taxonomic units (OTUs).25 With the help of the QIIME program, the representative read for each OTU was chosen. The Silva database Version 123 (or Greengens) (16S rDNA) was blasted against using an RDP classifier, which had a 70% confidence threshold, and all representative reads were annotated.26 Using Blast, the Unite database (ITSs rDNA) was also searched for all representative reads.27
2.6. Statistical analyses
This study presented the results as Mean ± Standard Deviation(SD). Shapiro-test Wilk’s and Levene’s test (both using SPSS 26.0) were used to determine the normality and homogeneity of the data. One-way ANOVA was used to examine the significant effects of MPs for each treatment, and Tukey’s HSD test was used for multiple comparisons. Molecular variance (AMOVA) analysis was used to evaluate bacterial communities. The threshold for a significant difference was defined as a P value of less than 0.05.
3. Results and discussion
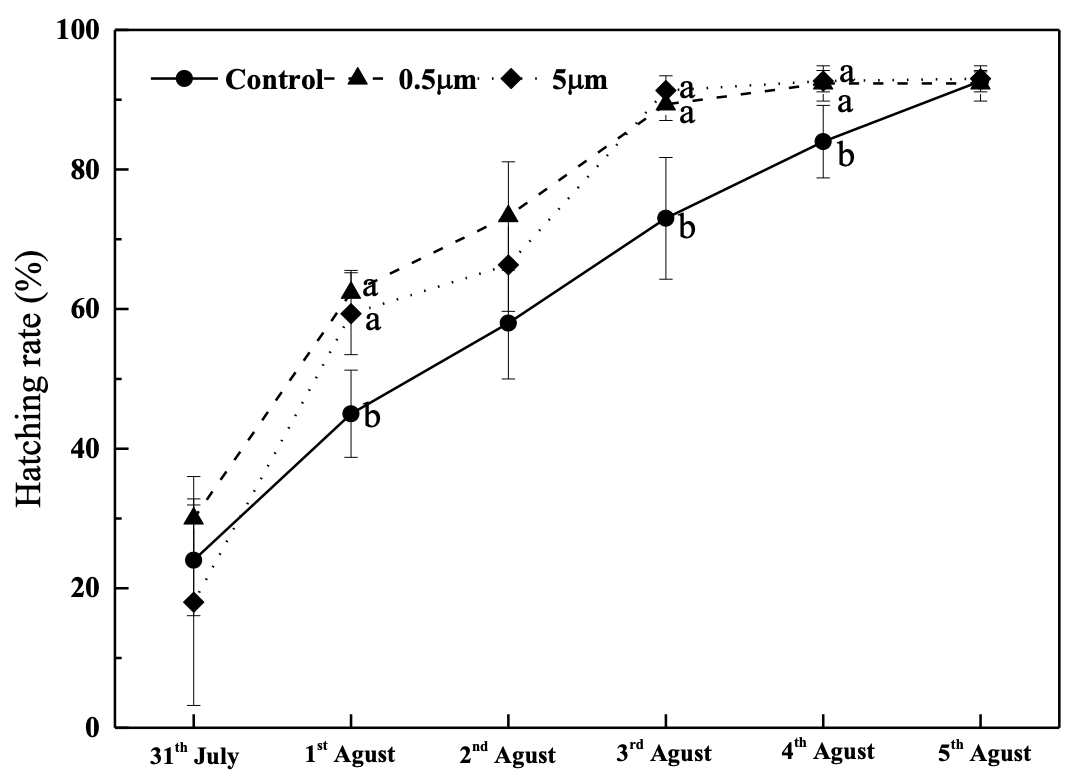
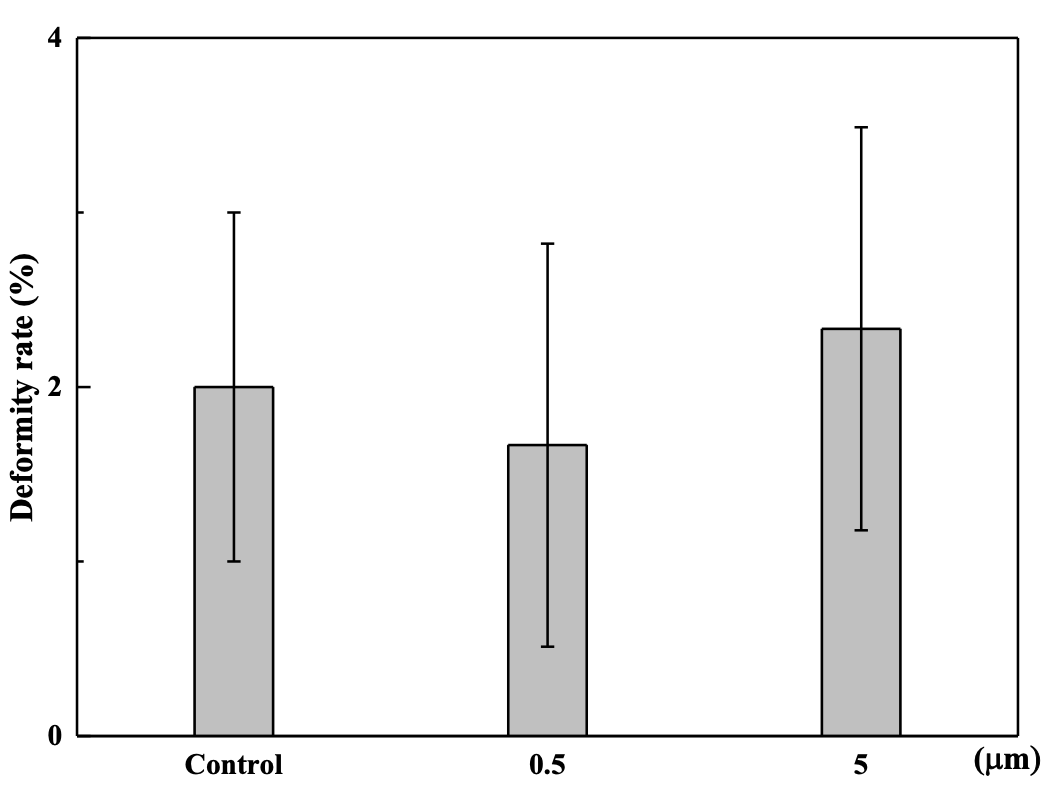
The results indicated that 104 items/L PS (0.5 µm and 5 µm) may improve the hatching rate when compared to the control during the hatching process (P<0.05), but there was no significant difference at the end of the hatching process (P>0.05, Figure 2). There was no significant difference in the deformation rate across the treatments (P>0.05, Figure 3).
_of_*s._japonica*_exposed_to_microplastics_with_different_sizes__control.png)
_of_*s._japonica*_exposed_to_microplastics_with_different_sizes.png)
These findings differed from those of several previous reports,28–30 which suggested that MPs can decrease hatching success, delay the hatching process, and increase the deformity rate. It is believed that the adsorption of fine particles onto eggshells in the presence of dense MPs could obstruct spiracles and channels, resulting in a decrease in the absorption of oxygen and nutrients. Fertilized eggs may experience a longer hatching period.16 These studies primarily focused on teleost fish. Additionally, several investigations revealed that MPs had little impact on the development of fertilized eggs.31,32 Additionally,33 discovered that low levels of polystyrene MPs reduce marine medaka’s early developmental toxicity to phenanthrene (Oryzias melastigma). To the best of our knowledge, the metabolic reactions to MPs from marine bivalves varied depending on the MPs’ characteristics (including kind, shape, and size), as well as the exposure modes (including length and abundance).34 In contrast,15 size-dependent effects of MPs were not confirmed in this study. Species-specific differences in hatching performance could exist. Therefore, further research on various species needs to be done.
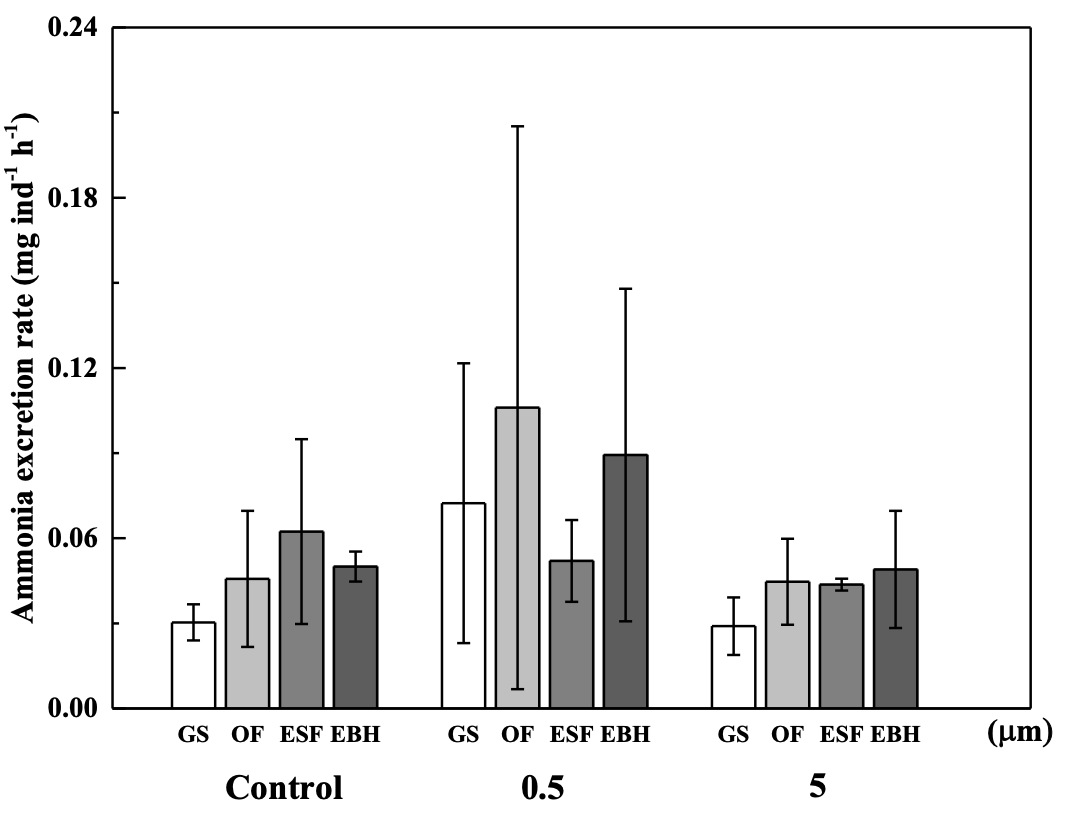
At the GS stage, MPs were observed to have a significantly decreased oxygen consumption rate (P<0.05, Figure 4), suggesting that MPs may have blocked the spiracles of S. japonica fertilized eggs at the start of development. However, the significant difference vanished from the OF stage, demonstrating that the negative effects of MPs were transient. Under three treatments, the oxygen consumption rate often rose as development lengthened. Furthermore, because organisms would increase their ammonia excretion rates to combat environmental stress,35 there was no significant difference in ammonia excretion rates between treatments (P>0.05, Figure 5), implying that 104 items/L PS (0.5 µm and 5 µm) had no negative effects on S. japonica fertilized eggs.
_of_*s._japonica*_exposed_to_microplastics_with_different_size.png)
_of_*s._japonica*_exposed_to_microplastics_with_different_sizes.png)
On an Illumina MiSeq platform, 9 samples produced excellent paired-end reads (200 bp). 676,841 contigs were created by preprocessing and assembling the raw data. The average length of the effective tags ranged from 63,279 to 68,241, was 387–437 nt, making up 85.72%–90.74% of the raw data. The effective tags were clustered into OTUs at 97% similarity to evaluate the species diversity within samples. 9 samples yielded 1553 OTUs, ranging in size from 223 to 446.
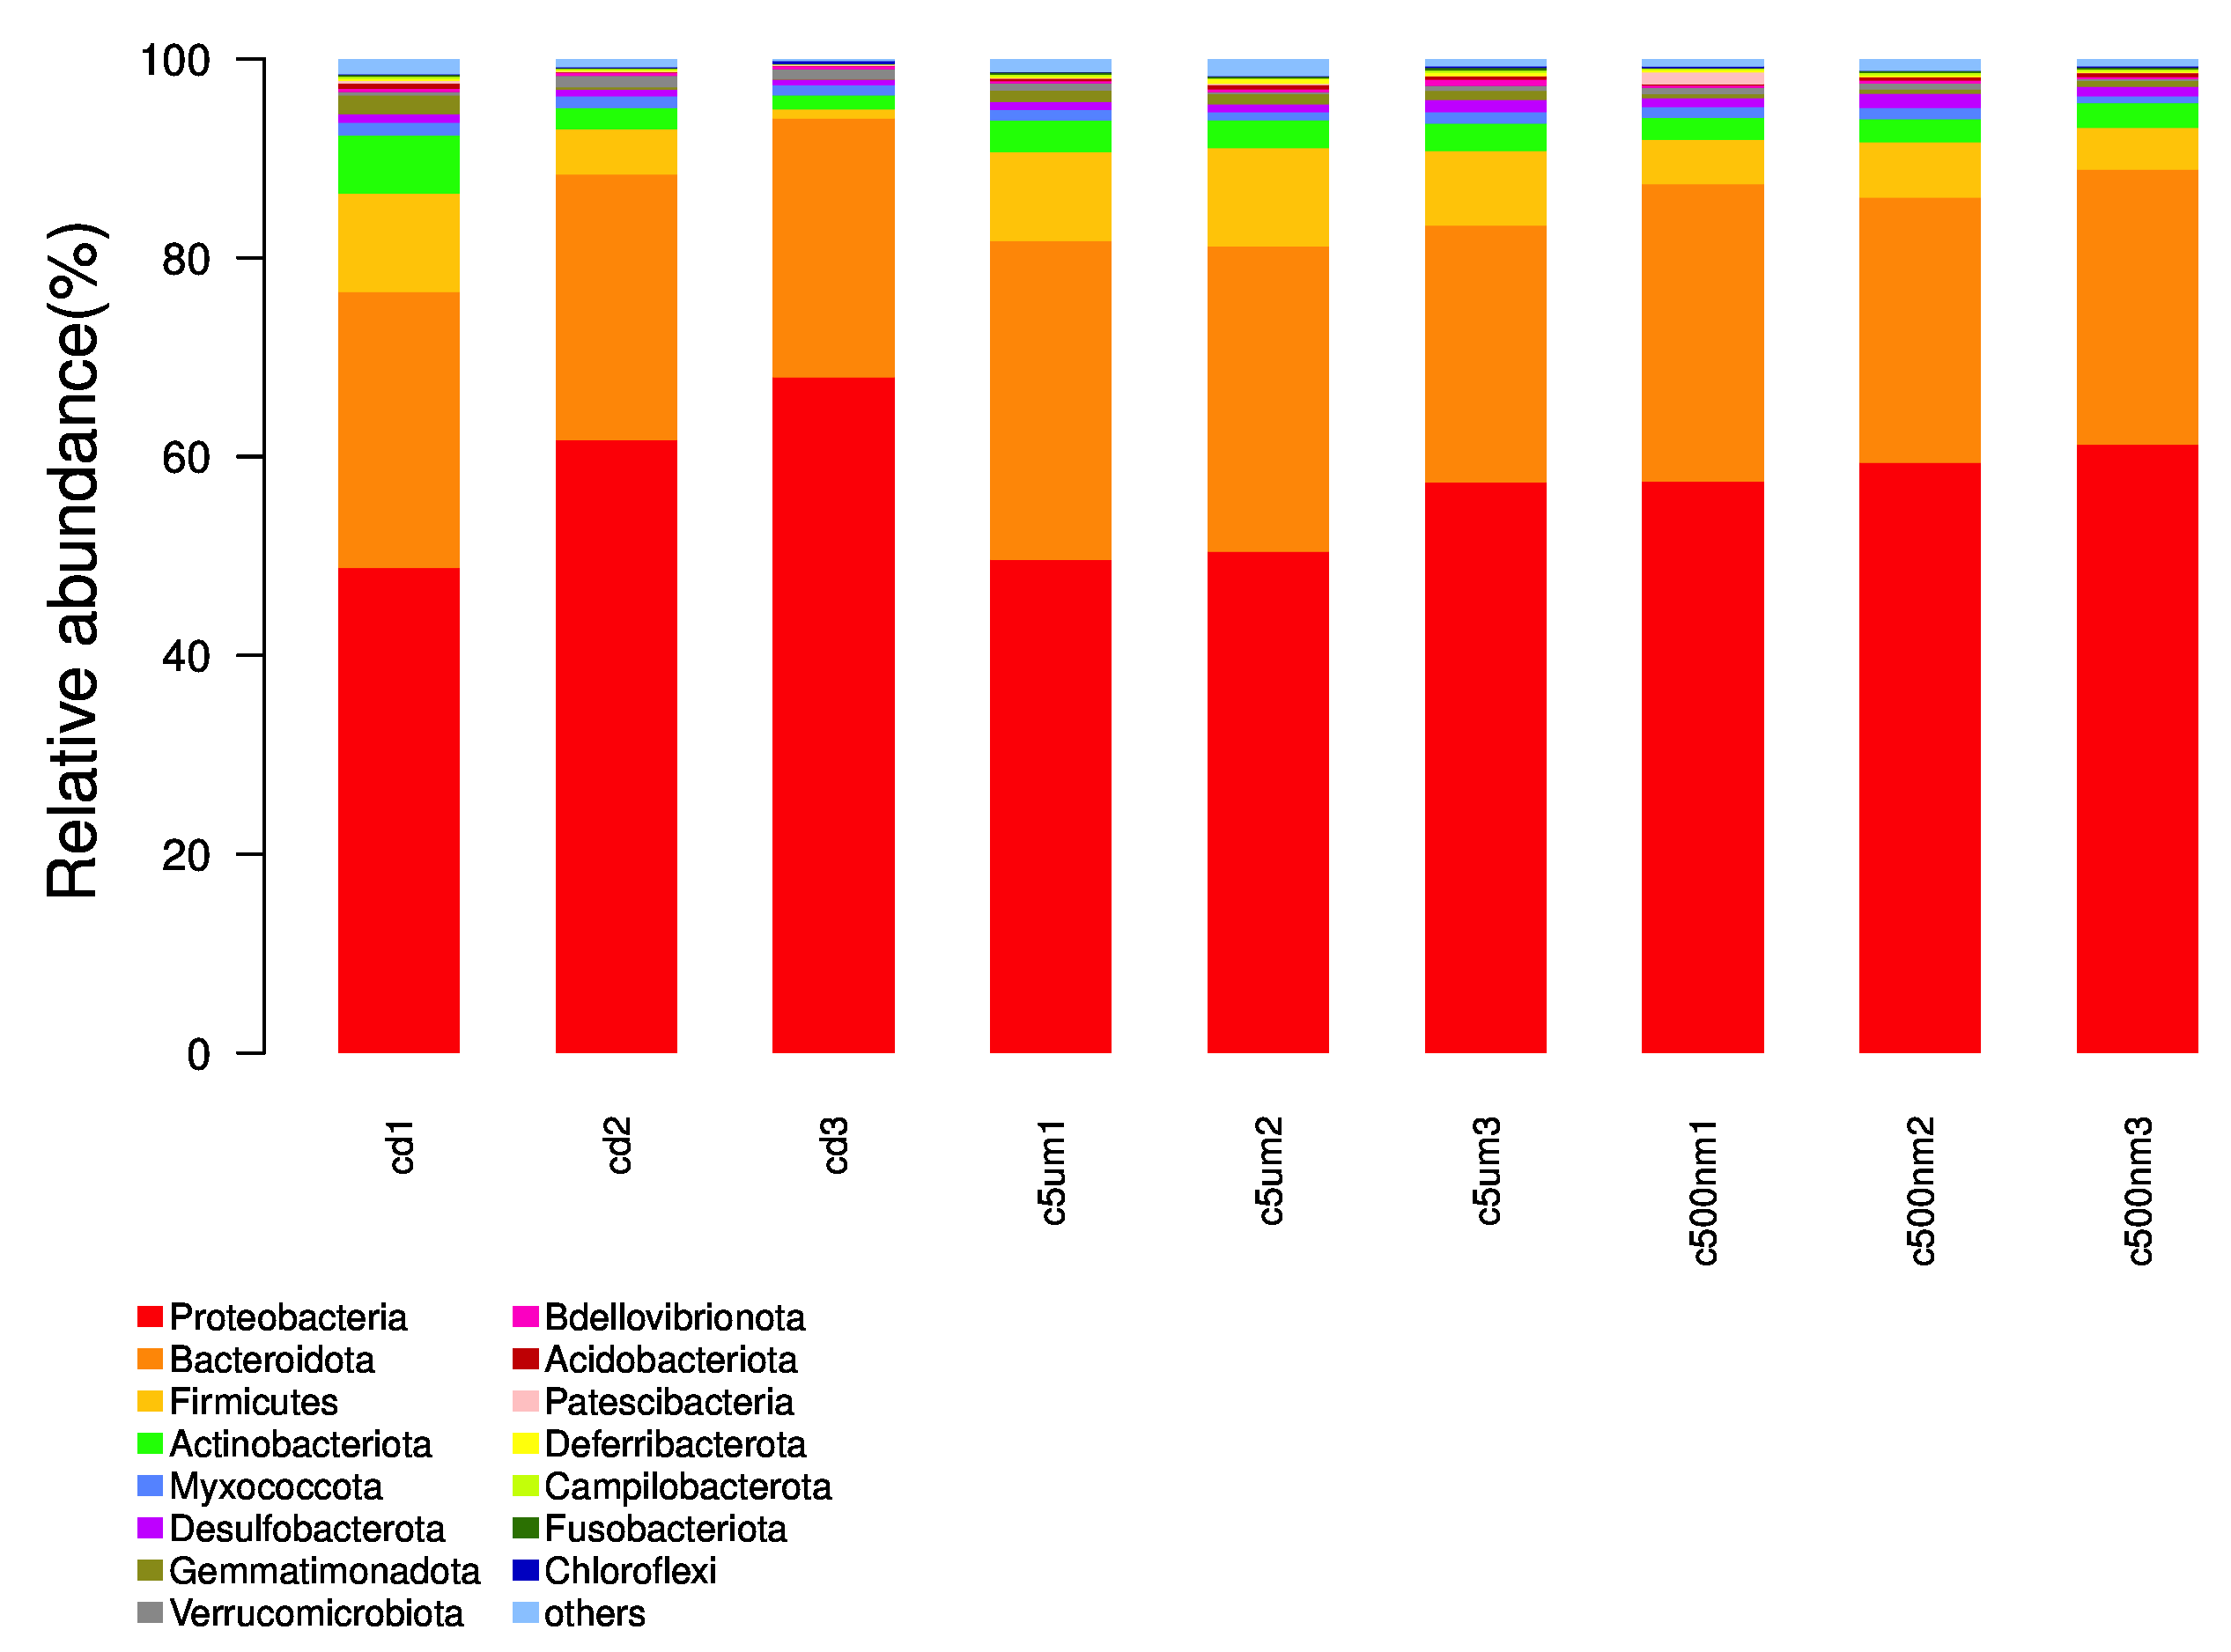
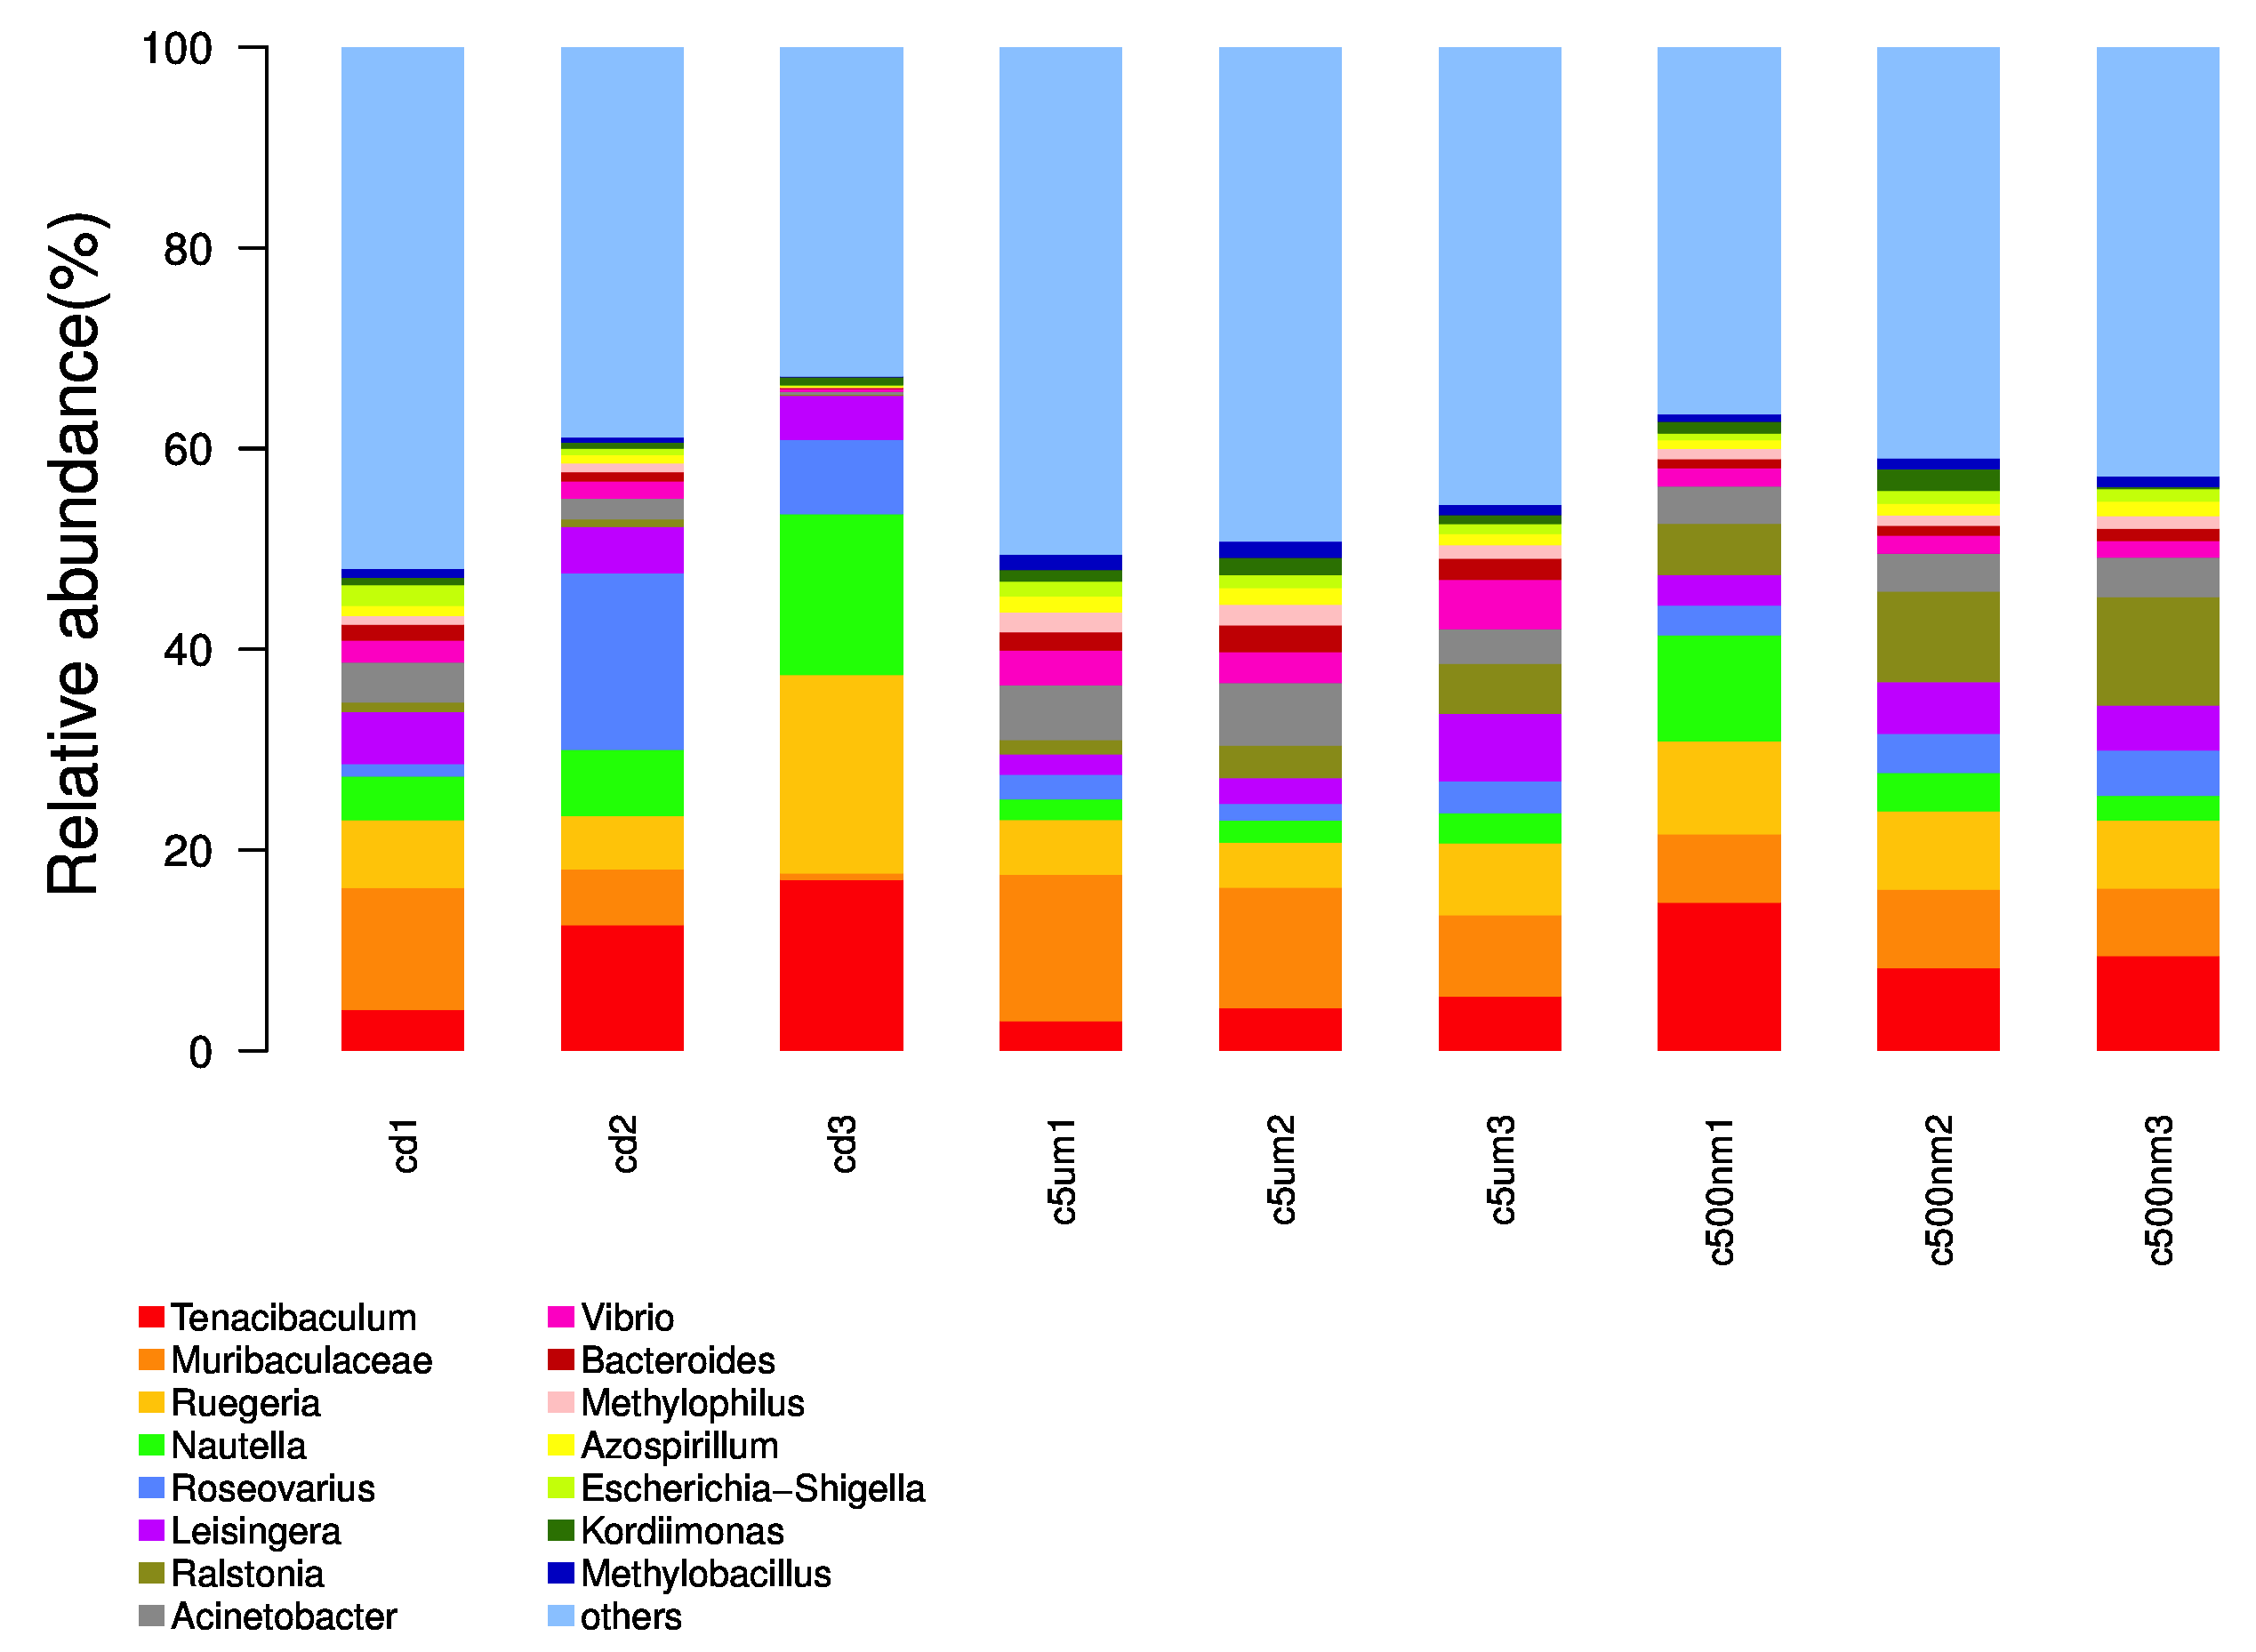
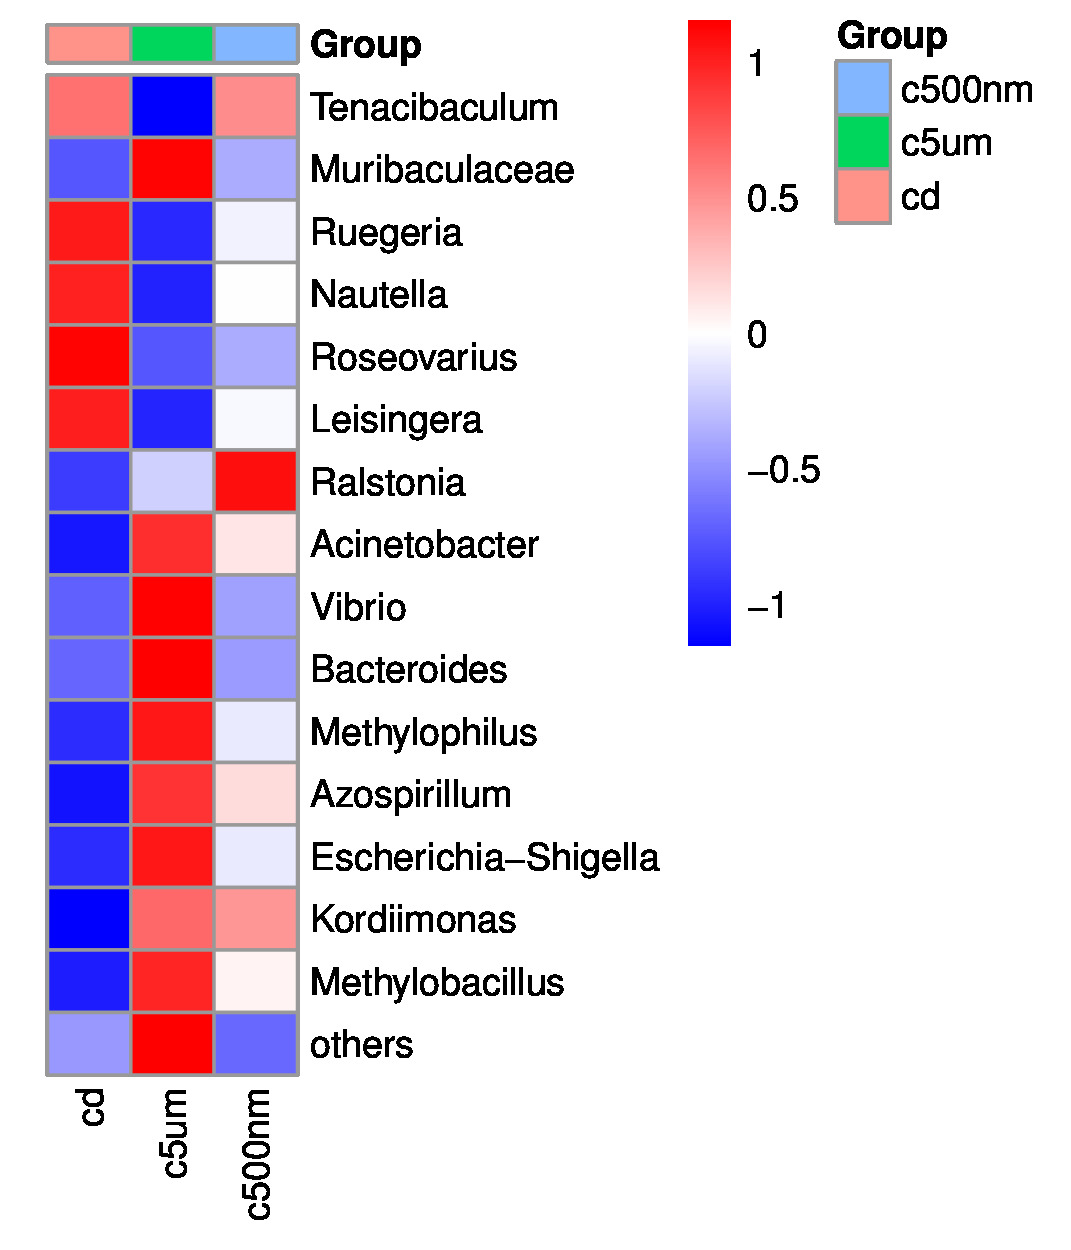
Distribution histograms created using a maximum sorting method display the top 15 most prevalent microorganisms at various taxonomic levels (phylum, class, order, family, genus, and species). The maximum number of organisms in each phylum in all samples was determined, and the top 15 phyla were chosen for the figure. Proteobacteria, Bacteroidota, Firmicutes, Actinobacteria, Desulfobacterota, Gemmatimonadota, Verrucomicrotiota, Bdellovibrionota, Acidobacteriota, Patescibacteria, Deferribacterota, Campilobacterota, Fusobacteriota, and Chloroflexi were the top 15 (Figure 6). Tenacibaculum, Muribaculaceae, Ruegeria, Nautella, Roseovarius, Leisingera, Ralstonia, Acinetobacter, Vibrio, Bacteroides, Methylophilus, Azospirillum, Escherichia-Shigella, Kordiimonas, and Methylobacillus were the most prevalent genera (Figure 7).
__c5m_(1--3)_and_c500nm_(1--3)_.png)
__c5m_(1--3)_and_c500nm_(1--3)_.png)
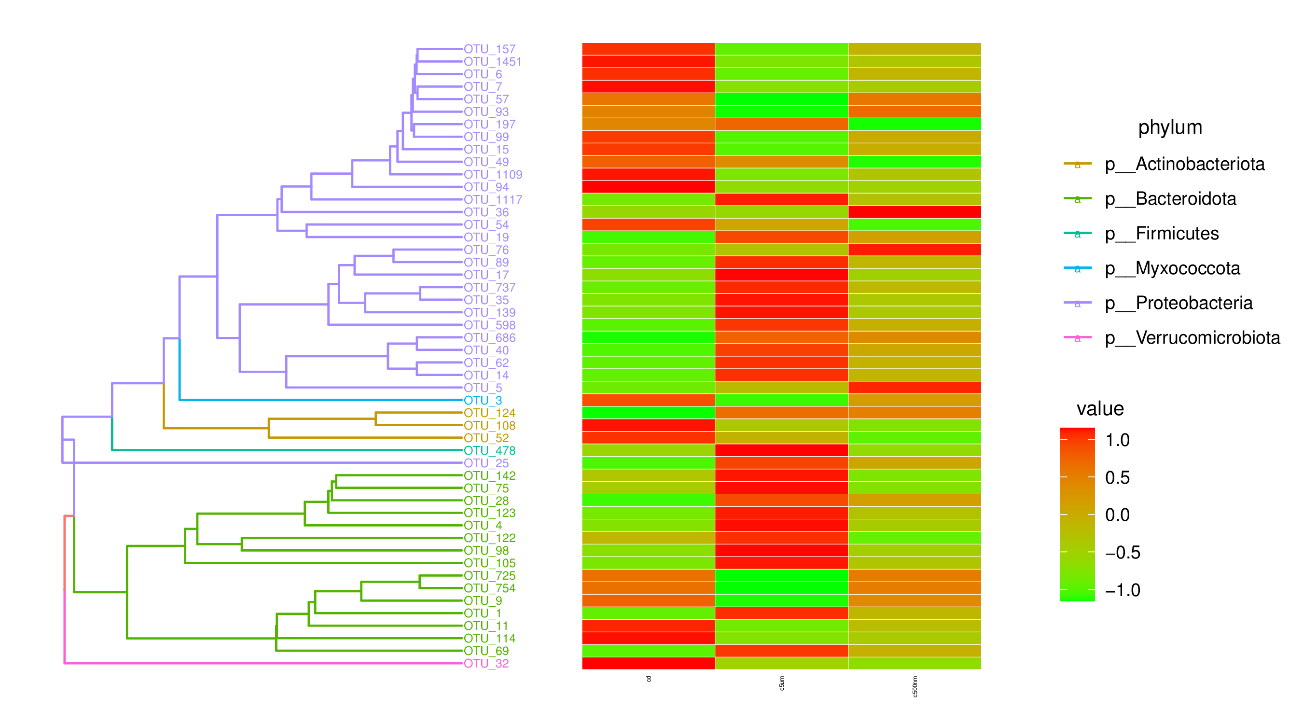
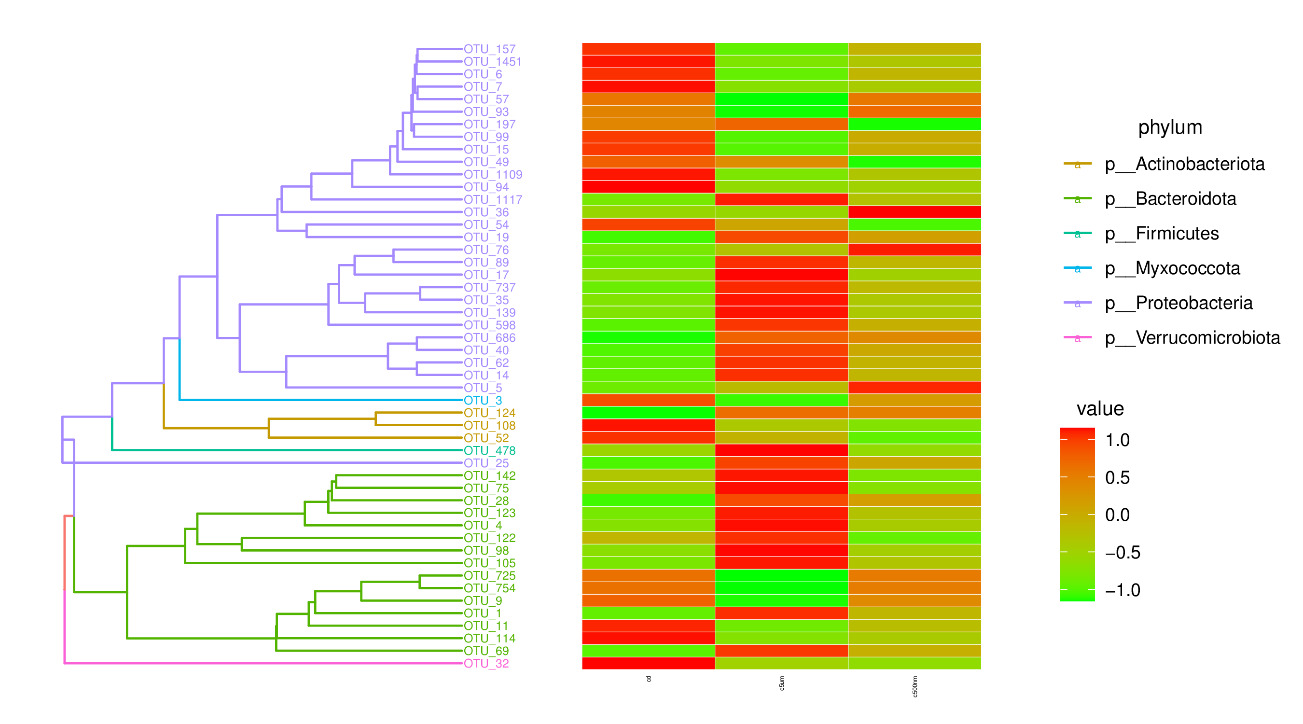
By calculating the abundance of each OTU (Figure 8), choosing the top 50 OTUs based on their abundance of tags, and creating an evolution tree, it was possible to discover the phylogenetic relationships between various OTUs and the variations among the dominant species. Proteobacteria, Bacteroidota, Actinobacteriota, Firmicutes, Deferibacterota, Myxococcota, and Verrucomicrobiota were the taxa with the highest OUT diversity.
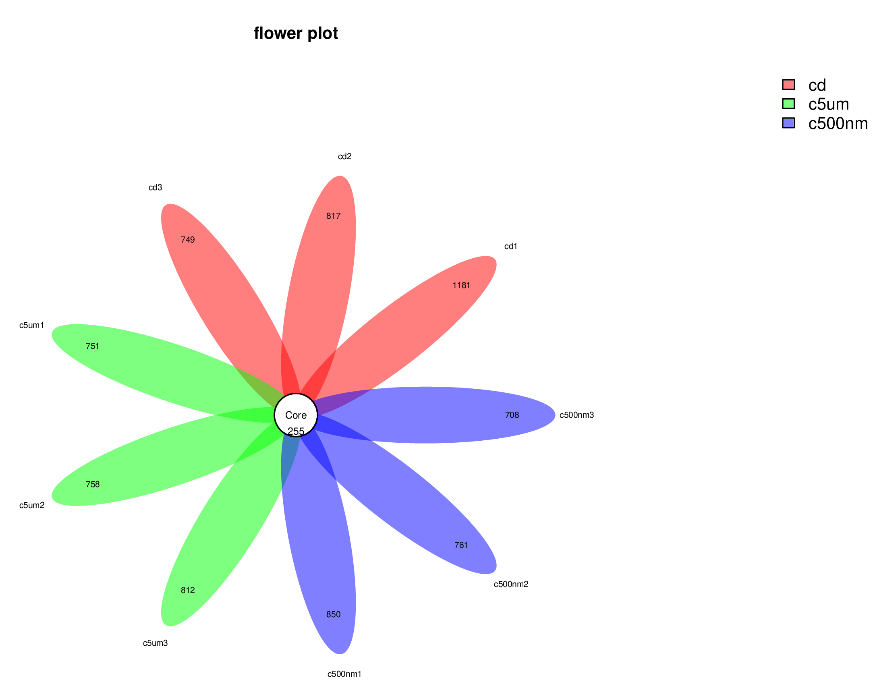
The dominating microbiotas in the three groups were examined by normalizing the OTU table and examining both the shared and unique OTUs on the microbial community compositions of cuttlefish fertilized eggs at varied PS sizes. The OTUs in the digestive tracts were identified using a flower plot diagram (Figure 9). A total of 255 OTUs were clustered into the 4 groups. The OTUs 850, 761, and 708 were specific to the c500nm (1-3) wavelength, while the OTUs 1181, 817, and 749 were specific to the control (cd) (1-3), and the OTUs 751, 758, and 812 were specific to c5µm (1–3).

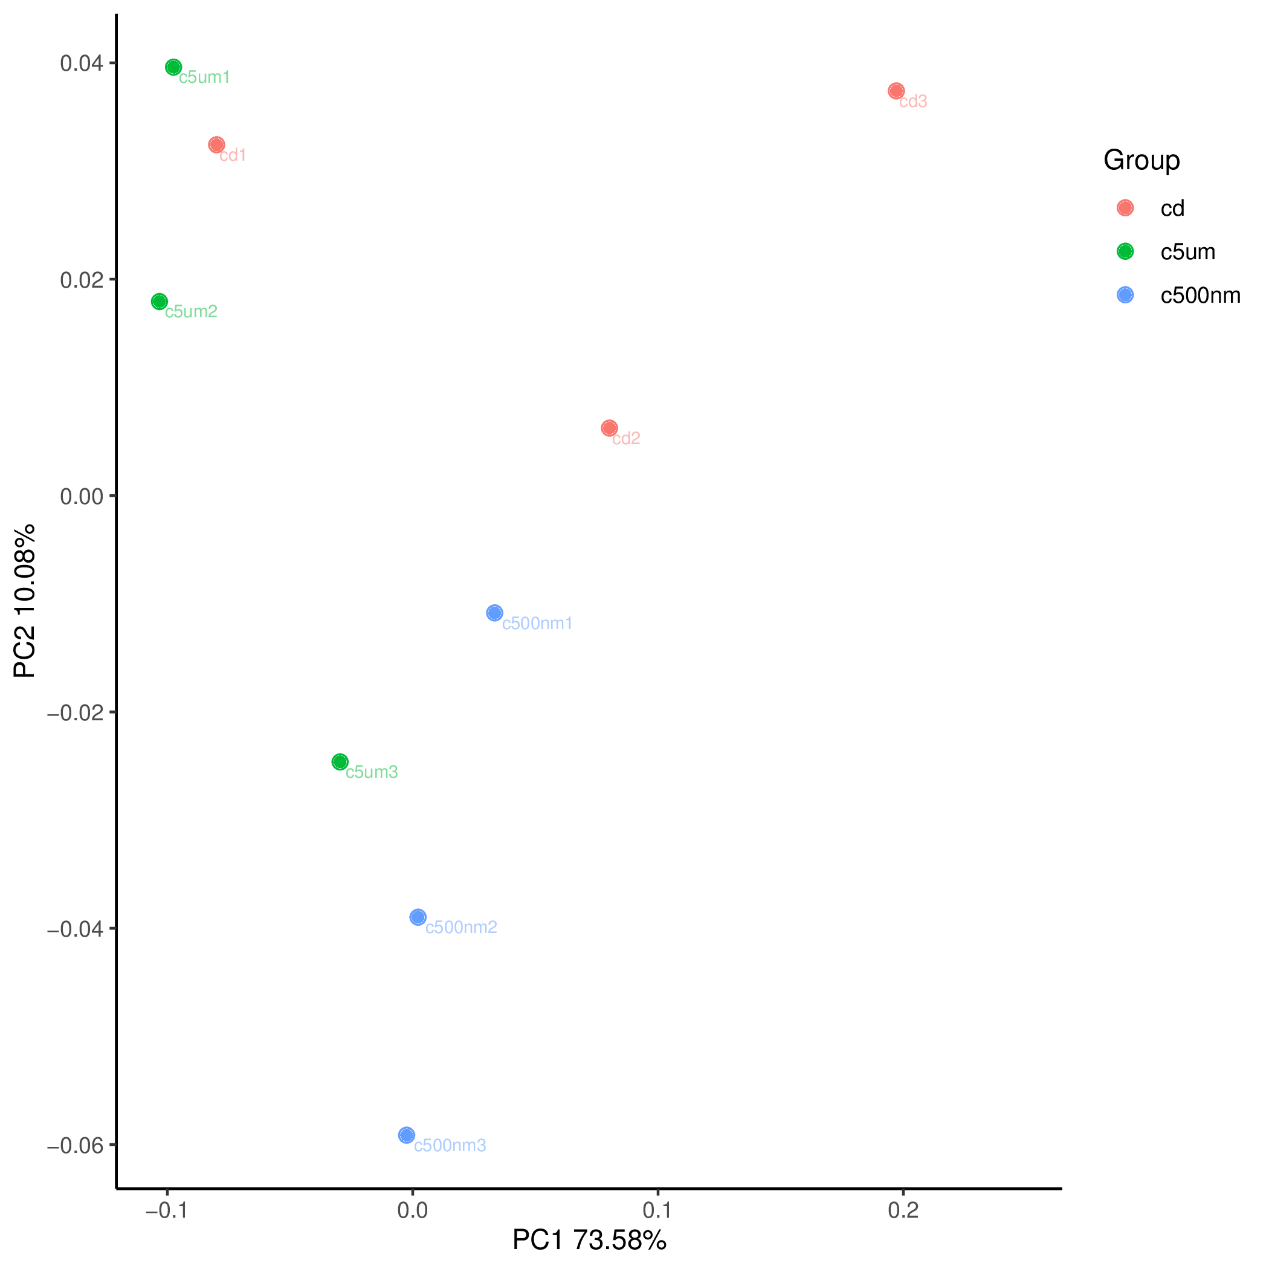
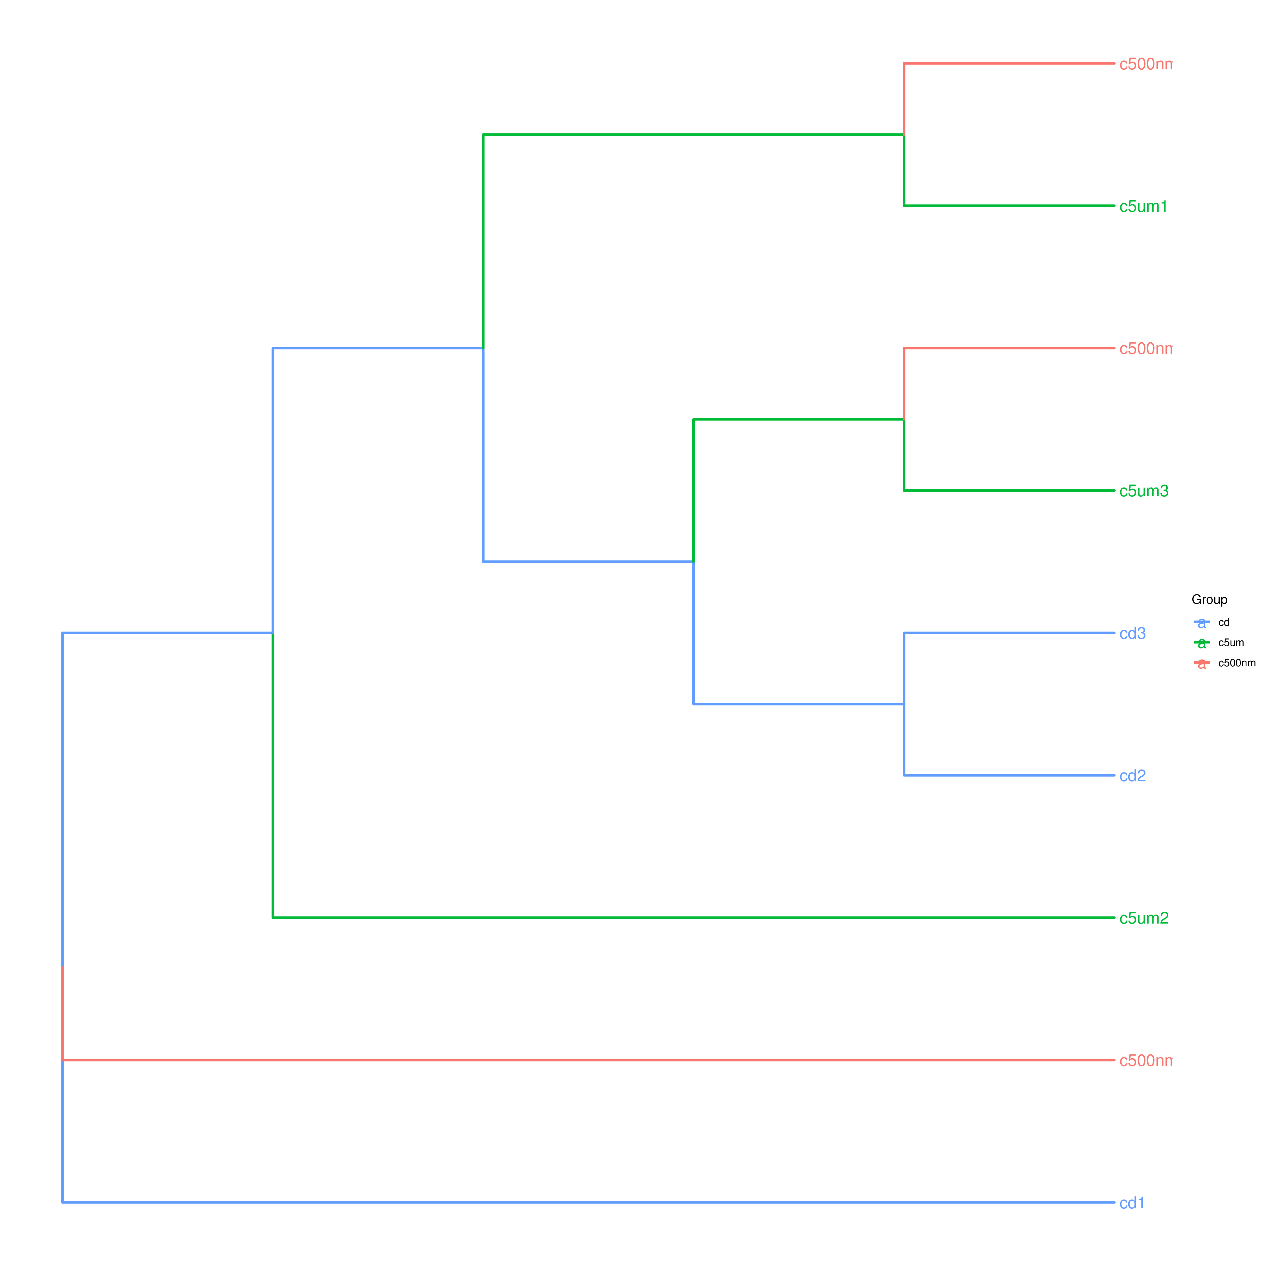
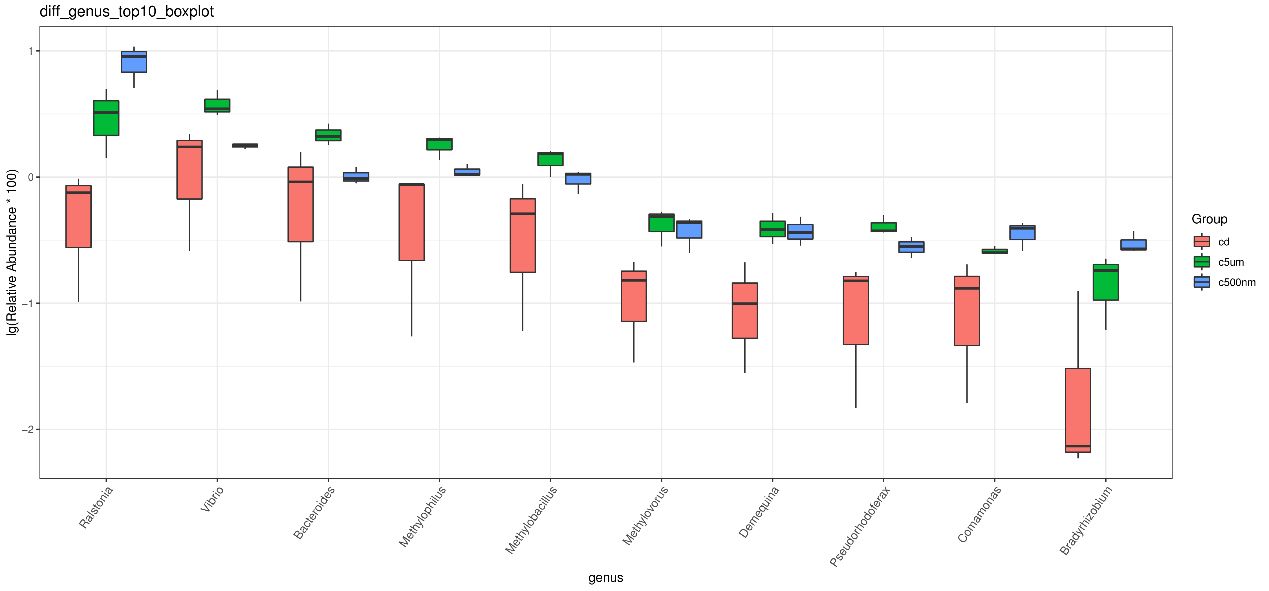
The top 15 genus-level microorganisms were most prevalent in each treatment group (Figure 10). Ruegeria, Nautella, Roseovarius, and Leisingera were the top four prevalent genera among the samples in the cd groups. Muribaculaceae, Acinetobacter, Vibrio, Bacteroides, Methylophilus, Azosprillum, Escherichia-Shigella, and Methylobacillus were the most prevalent genera in the samples from cd groups c5m. Ralstonia was the most prevalent genus in the cd groups c500nm samples. Based on the relative abundances of OTUs, the weighted UniFrac distances of all nine samples within the four treatment groups were determined. Utilizing the weighted UniFrac distance, we conducted principal coordinate analysis (PCoA) (Figure 11). All of the samples, including all groups, did not cluster properly and were not arranged along the chart’s first main component (PC1). They accounted for 73.58% of the total weighted PCoA.A sample clustering tree was created using the unweighted pair group technique with arithmetic mean (UPGMA) to examine further the similarities between various samples and groups (Figure 12). It was clear that there was no visible clustering of the groups or samples into a single branch, which was in line with the PCoA analysis. The variations in bacterial communities across the four groups were then further evaluated using an analysis of molecular variance (AMOVA). The cd and c5µm groups of communities in Ralstonia, Vibrio, Bacteroides, Methylophilus, Methylobacillus, Methylovorus, Demequina, Pseudorhodoferax, and Comamonas showed distinct characteristics. There were clear variances between the cd and c500nm groups of communities in Ralstonia, Methylophilus, Methylovorus, Demequina, Pseudorhodoferax, Comamonas, and Bradyrhizobium. The cd and c5µm groups of communities in Ralstonia, Vibrio, Bacteroides, Methylophilus, Methylobacillus, Methylovorus Demequina, Pseudorhodoferax, and Comamonas showed distinct characteristics. There were clear variances between the cd and c500nm groups of communities in Ralstonia, Methylophilus, Methylovorus, Demequina, Pseudorhodoferax, Comamonas, and Bradyrhizobium. Significant differences existed between the c5 µm and c500nm groups of communities in Vibrio, Bacteroides, Methylophilus, Pseudorhodoferax, and Bradyrhizobium. (Figure 13). All three findings demonstrated that the microbial community structure of the cuttlefish fertilized eggs is significantly impacted by variations in MPs size.
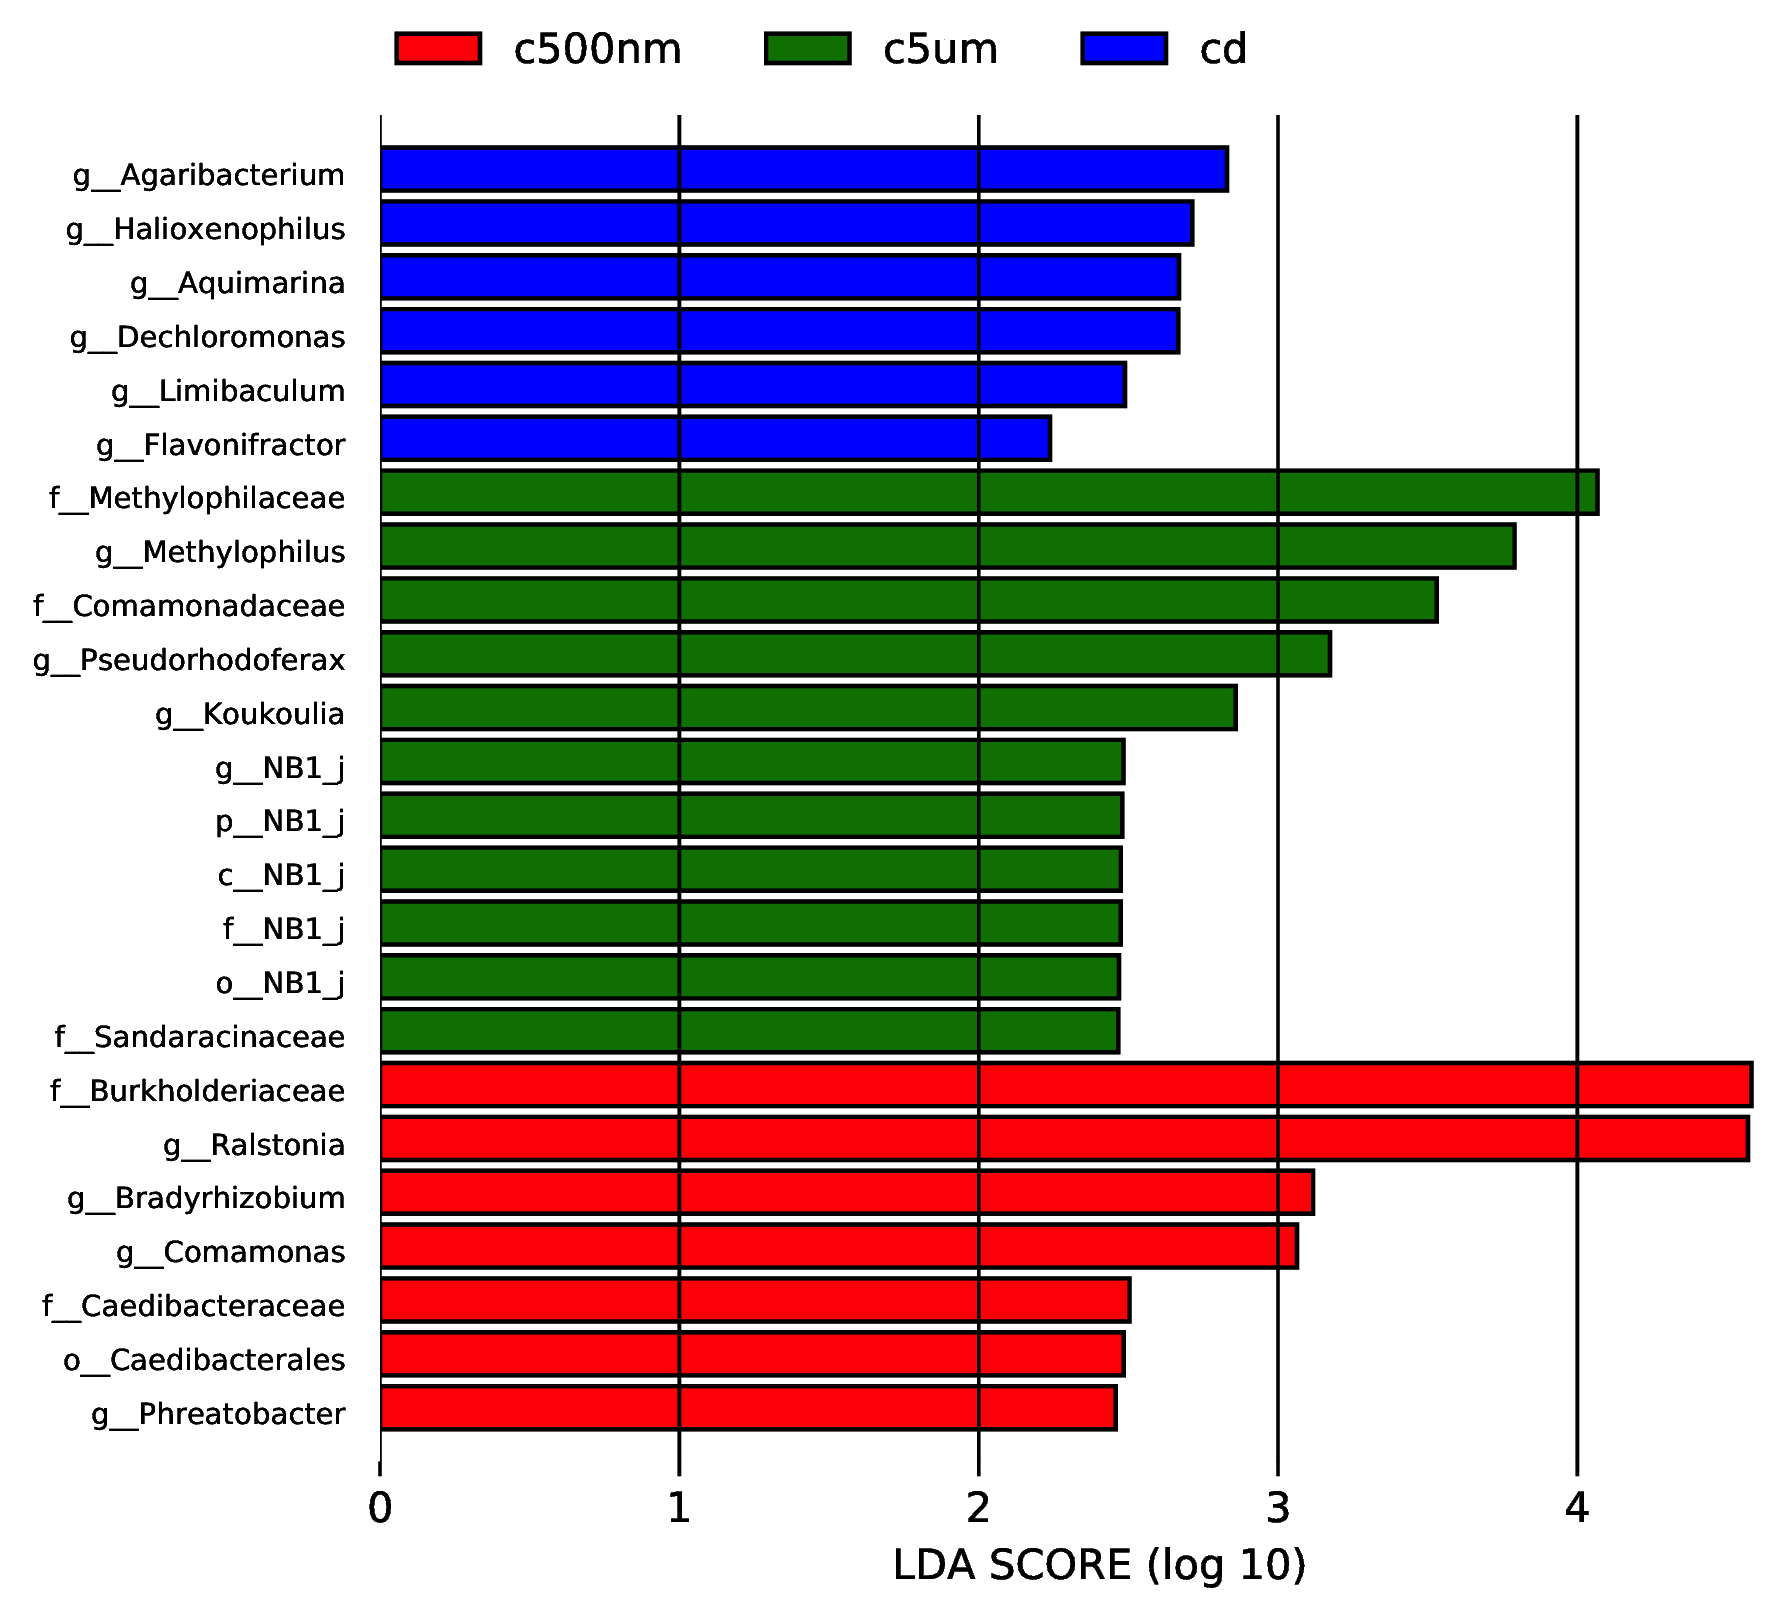
We performed LEfSe on taxa while keeping as many as possible for useful comparisons in order to further discover significant differences in biomarkers among the categories. Only six taxa, comprising the genera Agaribacterium, Halioxenophilus, Aquimarina, Dechloromonas, Limibaculum, and Flavonifracor, were found to be more prevalent in group cd, according to the comparison. Group c5µm, however, has a higher proportion of eleven taxa, including five NB genera, Methylophilaceae, Comanonadaceae, Sandaracinaceae, Methylophilus, Pesudorhodoferax, and Koukoulia (Figure 14). When seven taxa, including the genera Burkholderiaceae, Ceadibacteraceae, Ralstonia, Bradyrhizobium, Comamonas, Phreatobacter, and Caedibacterales, were more prevalent in the c500nm group.

__c5m_(.png)


__c5m_(.png)
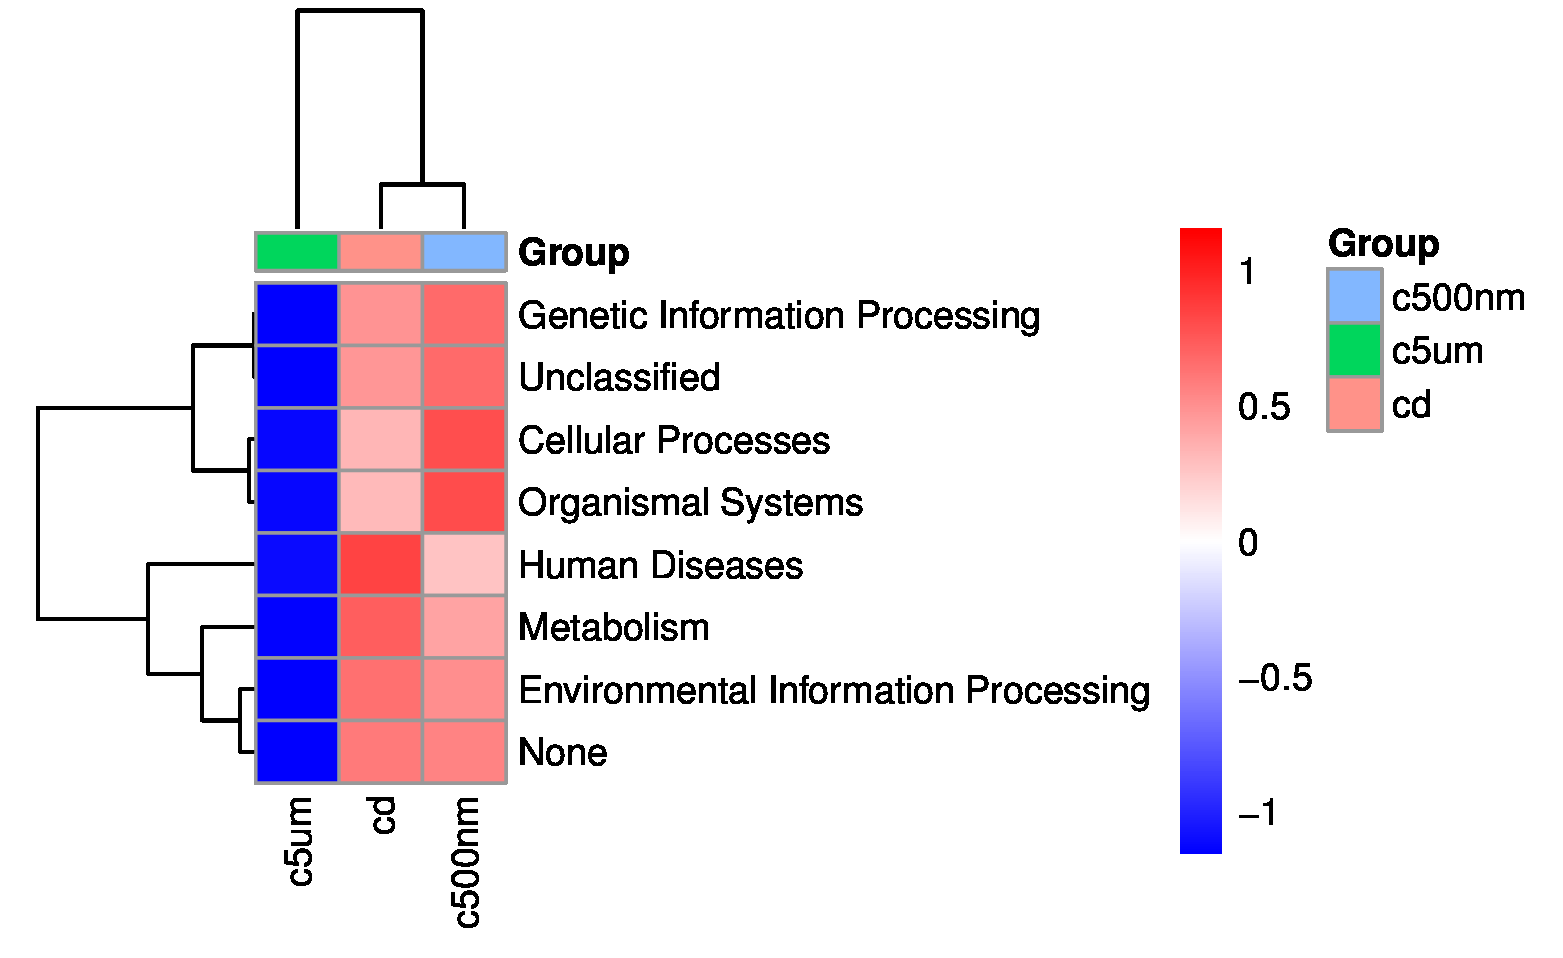
By utilizing PICRUSt to anticipate metagenomes, the presumed roles of the cuttlefish fertilized egg microbiome were examined. Figure 15 displays the top seven enrichment pathways: Genetic information processing is listed first, followed by unclassified, cellular processes, organismal systems, human diseases, metabolism, and finally, unclassified. There was no obvious major enrichment pathway. In relation to the seven paths, Group c5µm performs mediocrely. Meanwhile, Group cd functions heavily in the road for human diseases, and Group c500nm functions strongly in the pathway for cellular processes and organismal systems.
The findings demonstrated that Proteobacteria dominated the phylum flora in cuttlefish fertilized eggs and that MPs tended to lower Proteobacteria’s relative abundance. According to,36–38 proteobacteria were also found to be prevalent in the Pacific oyster Crassostrea gigas, noble scallop Chlamys nobilis, and Yesso scallop Patinopecten yessoensis, indicating their biological and ecological significance in the mollusk. Proteobacteria would become less numerous under environmental stress, according to the discovery that the relative abundance of these microorganisms declined steadily under high-temperature stress.37 The outcomes are consistent with this investigation. Healthy individuals’ intestines also include symbiotic Proteobacteria; nevertheless, they may develop into intestinal microorganisms that cause inflammation in certain intestinal environments. Intestinal Proteobacteria can represent microecological problems or unstable intestinal microbial community structures.39 Proteobacteria in the digestive tract of marine mollusks have received the majority of attention in pertinent studies to date. Its role and existence in other organs require more research.
Three genera, Ralstonia, Methylophilus, and Pseudorhodoferax, have significantly varied relative abundances among the three treatment groups. We hypothesize that MPs alter the composition of the microflora community in the fertilized egg of S. japonica. Zebrafish eggs, which have an exterior structure resembling S. japonica, can adsorb micro- and nanoparticles.40 Adsorbed particles may promote microbial diversity and have antibacterial effects, which closely agrees with our results. A species from Ralstonia with high amounts of poly-hydroxybutyrate, according to,41 can control the immunological response in mussel larvae exposed to Vibrio coralliilyticus. Methylophilus is believed to contribute significant nutrients to an algal diet.42 Catalase can be produced by pseudoorhodoferax.43 This study’s MPs exposure appears to enhance the good bacteria, as shown by an increase in the hatch rate during fertilization. However, the adsorption of dispersed antimicrobial nanoparticles on aquatic eggs may have cascade effects on several oviparous animal life stages, according to.40 According to one study, MPs could interact with microorganisms directly and indirectly by acting as a carrier for other contaminants.44 After the development of the S. japonica juveniles, ongoing surveillance of microbial organisms is required to stop the spread of the disease.
The microbial makeup of the mussel digestive system was investigated in the current work using 16S rRNA second-generation sequencing in response to variations in exposure to MPs of various sizes. We discovered that exposure to MPs impacted a number of dominating bacteria. The findings of the current study may serve to illuminate further the possible effects of growing marine MPs exposure on cuttlefish fertilized eggs. This information should be crucial for addressing the threats that marine MPs pollution poses to the cuttlefish breeding sector.
Conflict of Interest
The authors declare that the research was conducted without any commercial or financial relationships that could be construed as a potential conflict of interest.
Funding
This study was funded by research grants from the National Natural Science Foundation of China (No.41706142 & 32071615), the Open Project Fund of Zhejiang Province Key Lab of Mariculture and Enhancement (2021KF003), and Funding for school-level research projects of Yancheng Institute of Technology (XJR2021035). Yanming Sui is supported by a fellowship from China Scholarship Council.
Authors’ Contribution per CRediT
Conceptualization: Tao Zhang (Lead). Project administration: Xinya Chen (Lead). Supervision: Ke Sun (Lead). Formal Analysis: Jiyi Chen (Lead). Data curation: Xinxin Chen (Lead). Software: Jilin Xu (Lead). Validation: Huilai Shi (Lead). Visualization: Hongling Ping (Lead). Resources: Jie He (Lead). Methodology: Bin Li (Lead). Writing – original draft: Yebing Yu (Lead). Investigation: Lei Li (Lead). Writing – review & editing: Yanming Sui (Lead).