
1. Introduction
Climate change is reshaping the natural environment on which fisheries depend. Unlike many other industries, fisheries production is intrinsically tied to water temperature and quality, precipitation, ocean currents, and aquatic biological resources. Global warming and extreme weather can alter the distribution of fishery resources and the viability of biological assets, and disrupt fishing, aquaculture, processing, and transportation. Evidence from different countries and regions shows that climate risk already has material effects on fisheries production. Ocean warming and extreme temperatures affect the growth, reproduction, and survival of aquatic organisms.1,2 Abnormal precipitation, flooding, and strong winds can degrade water quality, damage aquaculture facilities, and interrupt fishing operations.3 Changes in light intensity and photoperiod may also influence fish feeding and growth,4 increasing the volatility and uncertainty of fisheries output.
As important organizational entities in the aquatic industry chain, listed fisheries companies not only undertake key supply chain links such as aquaculture, fishing, processing, and sales but also play a key role in promoting large-scale development, resource integration, and industrial upgrading of the aquatic industry. It is worth noting that climate risks may further affect the operating performance and financial status of fishery enterprises by affecting the supply of fishery resources, production efficiency, and operating costs. At the same time, some listed fisheries companies have long faced problems such as fluctuating profitability, insufficient operational stability, and pressure on capital turnover. Weak financial resilience may further amplify the adverse effects of climate shocks. Therefore, identifying the impact of climate risks on listed fisheries companies from the enterprise level is of great significance for understanding the microeconomic consequences of climate change.
Cash flow is essential for maintaining operations, absorbing external shocks, and sustaining long-term development. For fisheries companies, stable operating cash flow supports routine fishing, aquaculture, processing, and other production activities, while providing a buffer against environmental uncertainty and supply-chain disruptions. This raises two practical questions: Does climate risk affect the cash flows of listed fisheries companies? If so, which mechanisms can mitigate that effect?
This study addresses these questions by examining listed fisheries companies in China. It contributes to the literature in three respects. First, whereas most research on climate risk and fisheries focuses on ecosystems, fishery resources, or industry output, this study documents firm-level financial consequences. Second, unlike studies emphasizing profitability, financing costs, or cash holdings, it focuses on operating cash flow and thus captures firms’ internal cash-generating capacity. Third, studying a climate-sensitive, natural-resource-dependent industry deepens understanding of corporate climate vulnerability and provides policy implications for strengthening firms’ capacity to respond to climate risk.
2. Literature Review
There are two types of literature related to the research topic of this study: one is the impact of climate change on fisheries and agriculture. Existing research has systematically examined the impact of climate risks on the aquaculture industry. Climate warming, ocean acidification, extreme weather, and changes in hydrological conditions will change the structure of marine ecosystems and the living environment of aquatic organisms, thereby affecting the distribution of fishery resources, fishing potential, and aquaculture output. Cheung et al.5 found that rising seawater temperatures will drive the migration of marine species to high latitudes and lead to the redistribution of global fishery fishing potential among different sea areas; Free et al.1 further showed that historical ocean warming has had a significant impact on the productivity of marine fish populations. In aquaculture, climate risks primarily operate through environmental conditions such as water temperature, salinity, dissolved oxygen, and pH. They may not only reduce the growth and survival rates of cultured organisms but also increase the probability of disease occurrence and the risk of damage to aquaculture facilities.6,7 In recent years, scholars have increasingly emphasized the disruptive effects of extreme weather events on broader agricultural and food supply chains. The warming climate and associated extremes significantly undermine agricultural productivity, thereby cascading through the entire food supply chain and necessitating urgent mitigation strategies.8 Extreme weather events directly threaten supply chain continuity by disrupting logistics, causing delays, and exacerbating price volatility in agricultural markets.9 Consequently, building resilience in agricultural supply chains has become paramount for practitioners to withstand climate-induced shocks.10 At the same time, climate shocks may also push up production costs through feed supply, energy consumption, transportation conditions, and investments in epidemic prevention. Therefore, the impact of climate risks on the aquaculture industry is not limited to a decrease in production, but may also be further manifested in changes in product structure, increases in operating costs, expansion of income fluctuations, and damage to industry profits.11,12
Second, in the field of corporate finance, existing studies have mainly examined the economic consequences of climate risks in terms of operating performance, cash flows, financing costs, cash holdings, and capital market pricing. Physical climate risks such as abnormal high temperatures, floods, and storms will disrupt corporate production and operations, reduce labor productivity and sales revenue, and increase expenditures on facility repairs, energy consumption, and raw material procurement, ultimately weakening corporate profitability.13,14 From a cash flow perspective, climate risks may, on the one hand, reduce cash inflows from operating activities through production reductions, production suspensions, reduced product quality, and delayed delivery. On the other hand, climate risks may increase cash outflows for expenditures such as disaster prevention, insurance, equipment modifications, and post-disaster recovery, thereby reducing the company’s internal cash-generation capabilities and exacerbating cash-flow fluctuations. Faced with rising uncertainty about future cash flows, companies tend to increase cash reserves for precautionary reasons. Javadi et al.15 and Gounopoulos and Zhang16 both found that higher climate risk exposure prompts companies to increase their cash holdings. In addition, climate risks will increase bank loan spreads and external financing costs17 and enter capital market pricing by affecting investors’ judgments about future cash flows and tail risks.18,19 Beyond general enterprises, the financial performance of fisheries and aquaculture companies is particularly sensitive to these climate shocks. Recent empirical work demonstrates that physical climate risks—such as changing water temperatures and extreme weather—directly compromise the financial stability of aquaculture enterprises, prompting heightened investor demand for comprehensive climate-related financial disclosures to evaluate associated economic damages and operational risks.20
In general, existing studies have revealed the impact of climate risks on fishery production activities and corporate financial status, respectively, but the former are mostly based on the ecosystem, fishery resources, and industry output levels, while the latter mainly focus on the financial consequences of general enterprises, and have not fully examined how climate shocks are transmitted to the cash flow of fishery companies. Since the production activities of fishery enterprises are highly dependent on the natural environment, their operations are more sensitive to climate change. Therefore, it is necessary to further examine the impact of climate risks on the cash flow of fishery enterprises from a micro-enterprise perspective. In view of this, this study systematically examines the impact of climate risks on the cash flows of listed fisheries companies.
3. Theoretical Analysis and Research Hypothesis
According to the enterprise production theory, enterprises determine product output by allocating production factors and achieve cash flow accumulation through the difference between product sales revenue and production and operating expenses. However, the production objects of fishery enterprises are mainly biological assets such as fish and shellfish. Their output depends not only on capital, labor, and technological inputs, but also highly depends on water temperature, water quality, precipitation, ocean currents, and marine ecological environment. Since biological assets have a fixed growth cycle and fishing resources and aquaculture environments are difficult for enterprises to control independently in the short term, climate conditions constitute an important exogenous constraint on the production and operations of fishery enterprises. Therefore, climate risks will fundamentally alter an enterprise’s production capacity and further affect its cash-flow generation.
The parameters have direct economic interpretations. R captures the probability or intensity of an adverse climate state; Qn and Qb describe output under normal and adverse conditions; and Cn and Cb denote the corresponding operating cash expenditures. In fisheries, Qb falls when heat, cold, rainfall, drought, or storms reduce survival, growth, fishing days, or facility availability. At the same time, Cb rises because firms must spend more on aeration, water exchange, disease control, repairs, insurance, energy, and post-disaster recovery. For example, a heatwave can reduce dissolved oxygen while increasing aeration and disease-prevention expenditure, making CFb < CFn economically transparent rather than merely algebraic.
In order to describe the above process, it is assumed that fishery enterprises may be in two situations: normal climate state and adverse climate state. R represents the probability that an enterprise faces adverse climate conditions. The larger R is, the higher the climate risk the enterprise faces. Suppose the enterprise’s product output under normal climate conditions is Qn, and the product output under adverse climate conditions is Qb. Because factors such as abnormal high temperatures, typhoons, floods, and ocean acidification may cause the migration of fishery resources, the death of cultured organisms, an increase in diseases, and the interruption of production activities, there are:
\[Q_{b} < Q_{n}\]
The expected output of the company is:
\[E(Q) = (1 - R)Q_{n} + RQ_{b}\]
Find the partial derivative of climate risk R:
\[\frac{\partial E(Q)}{\partial R} = Q_{b} - Q_{n} < 0\]
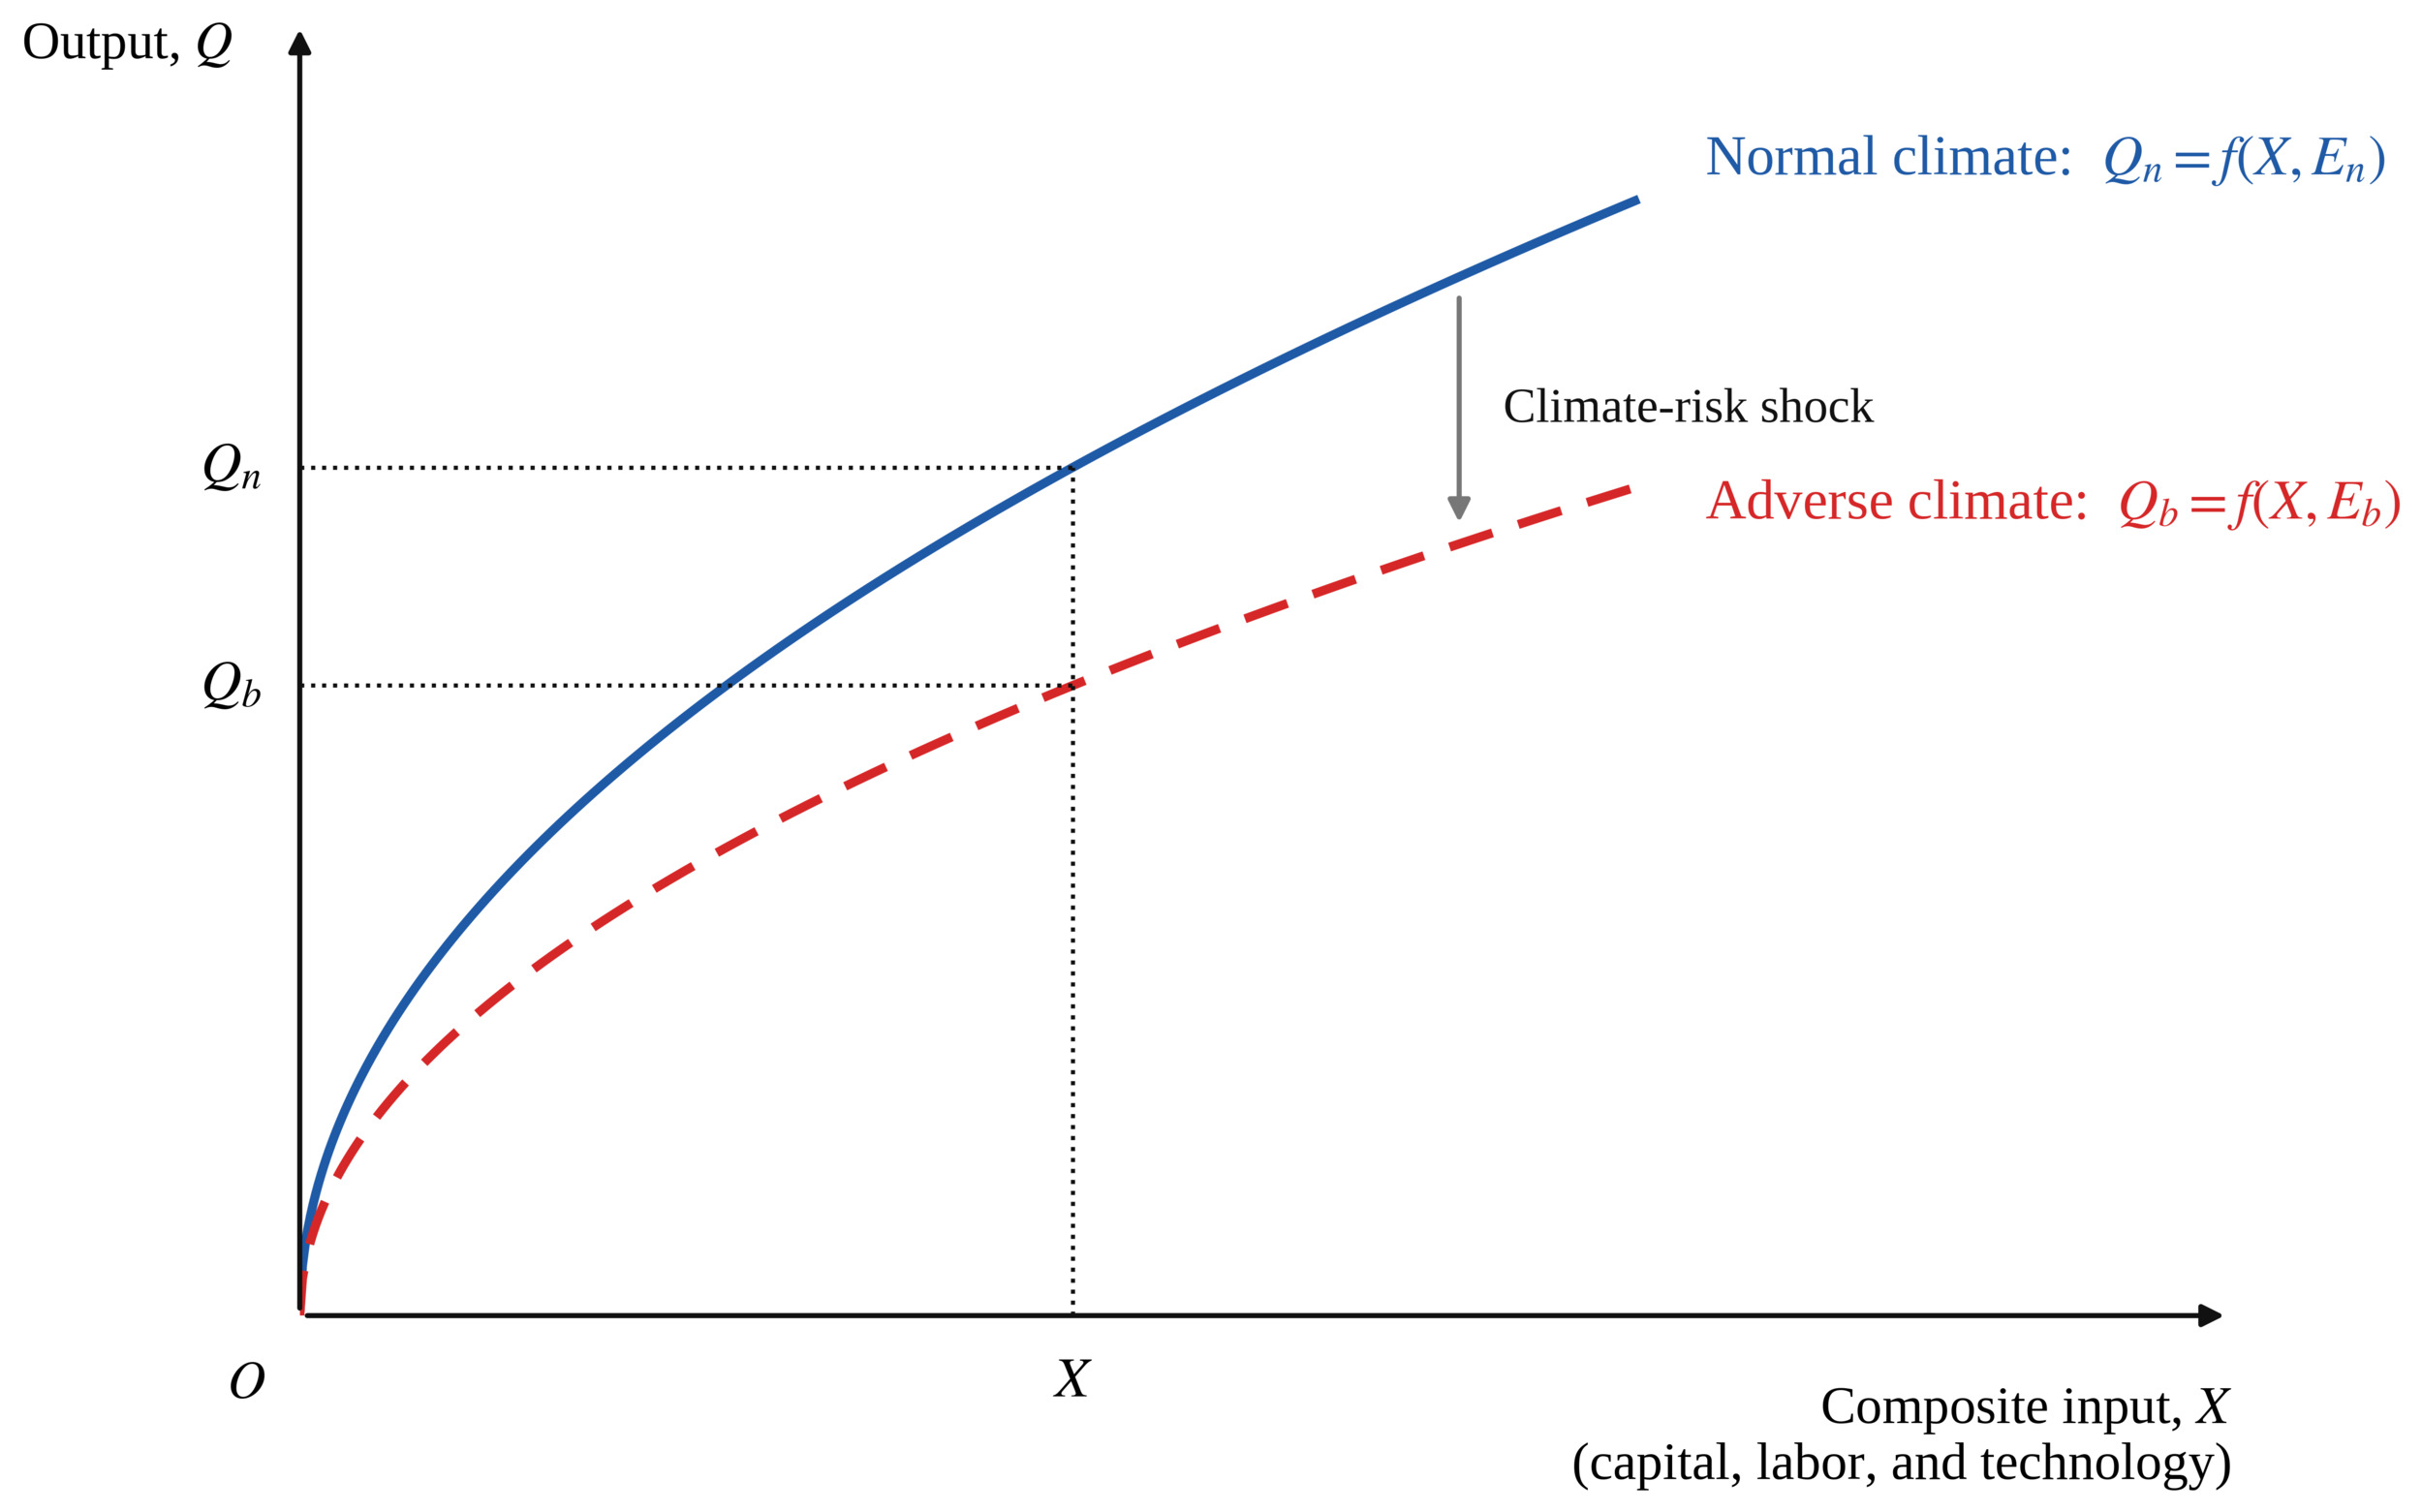
It can be seen that increasing climate risks will reduce the expected output of fishing enterprises. As shown in Figure 1, when the input of production factors is certain, the output level of enterprises under adverse climate conditions is lower than that under normal climate conditions, which is reflected in the downward shift of the input-output relationship of fishery enterprises.
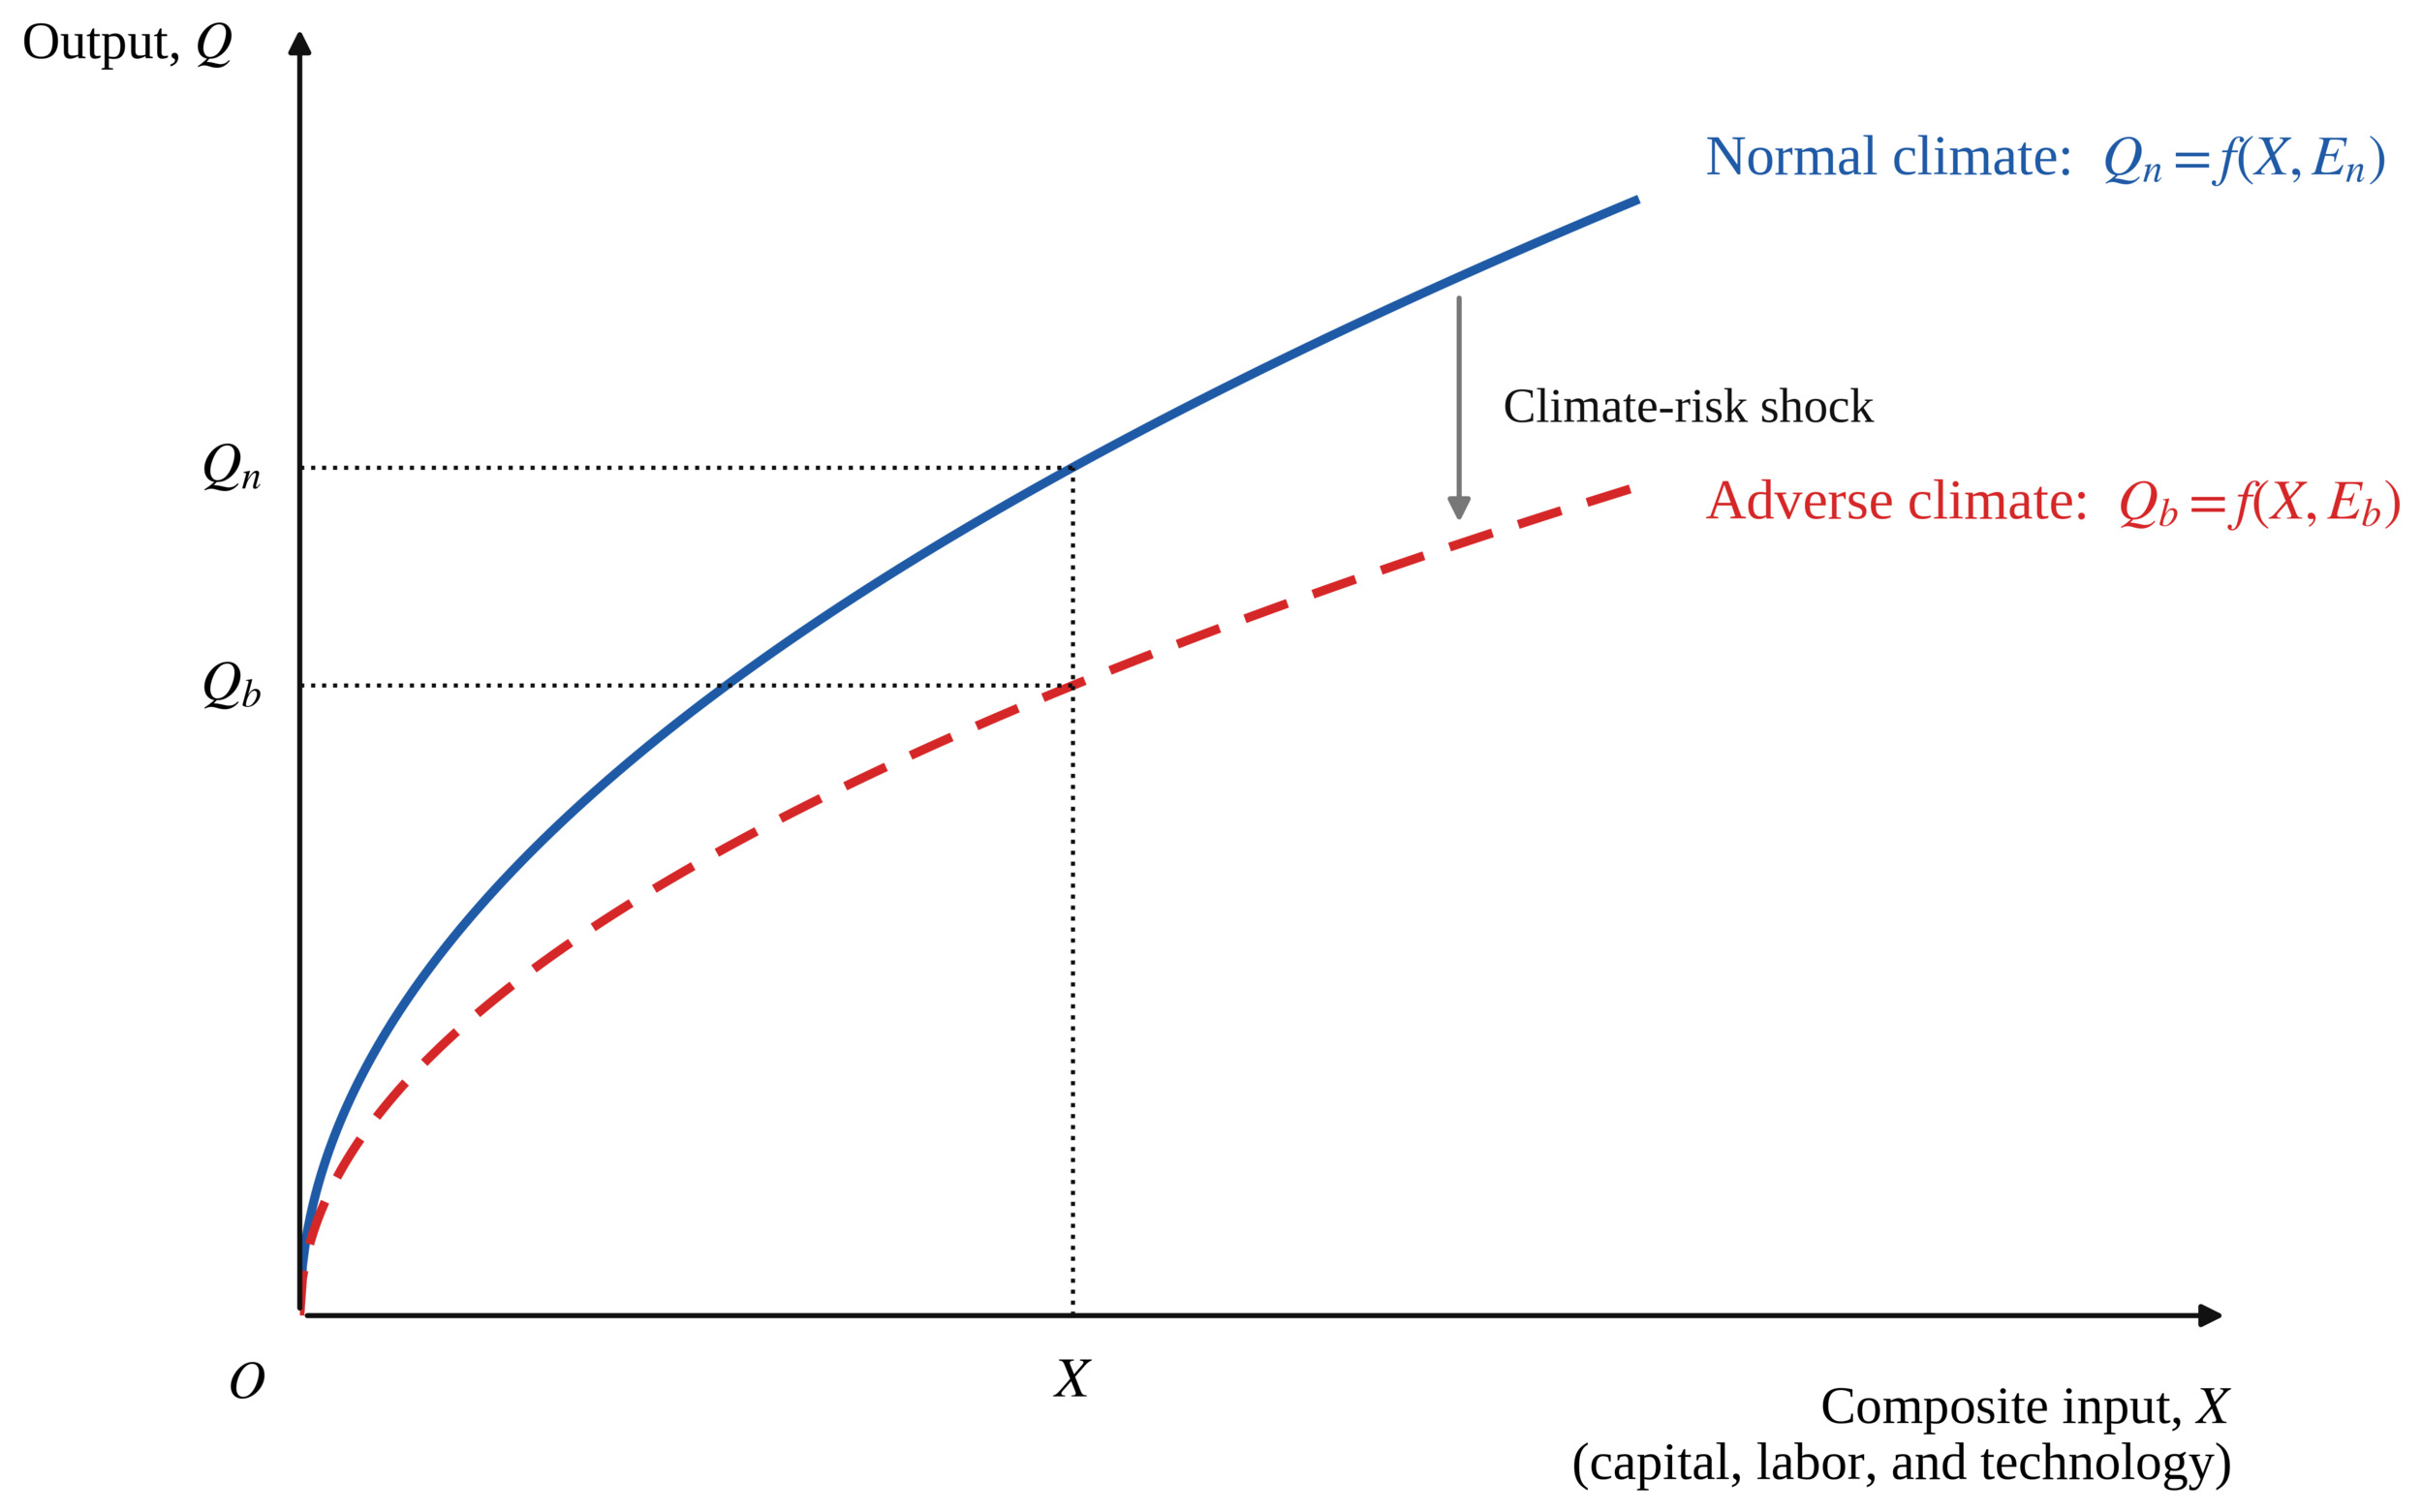
For fishing enterprises, climate change may lead to the migration of fish stocks, the reduction of suitable fishing grounds, and reduced effective operating time; for aquaculture enterprises, abnormal water temperatures, changes in water quality, and the spread of diseases may reduce the survival and growth rates of aquatic organisms. Since fishery production is subject to strong biological-cycle constraints, it is difficult for companies to fully offset production losses from climate shocks with short-term increases in investment.
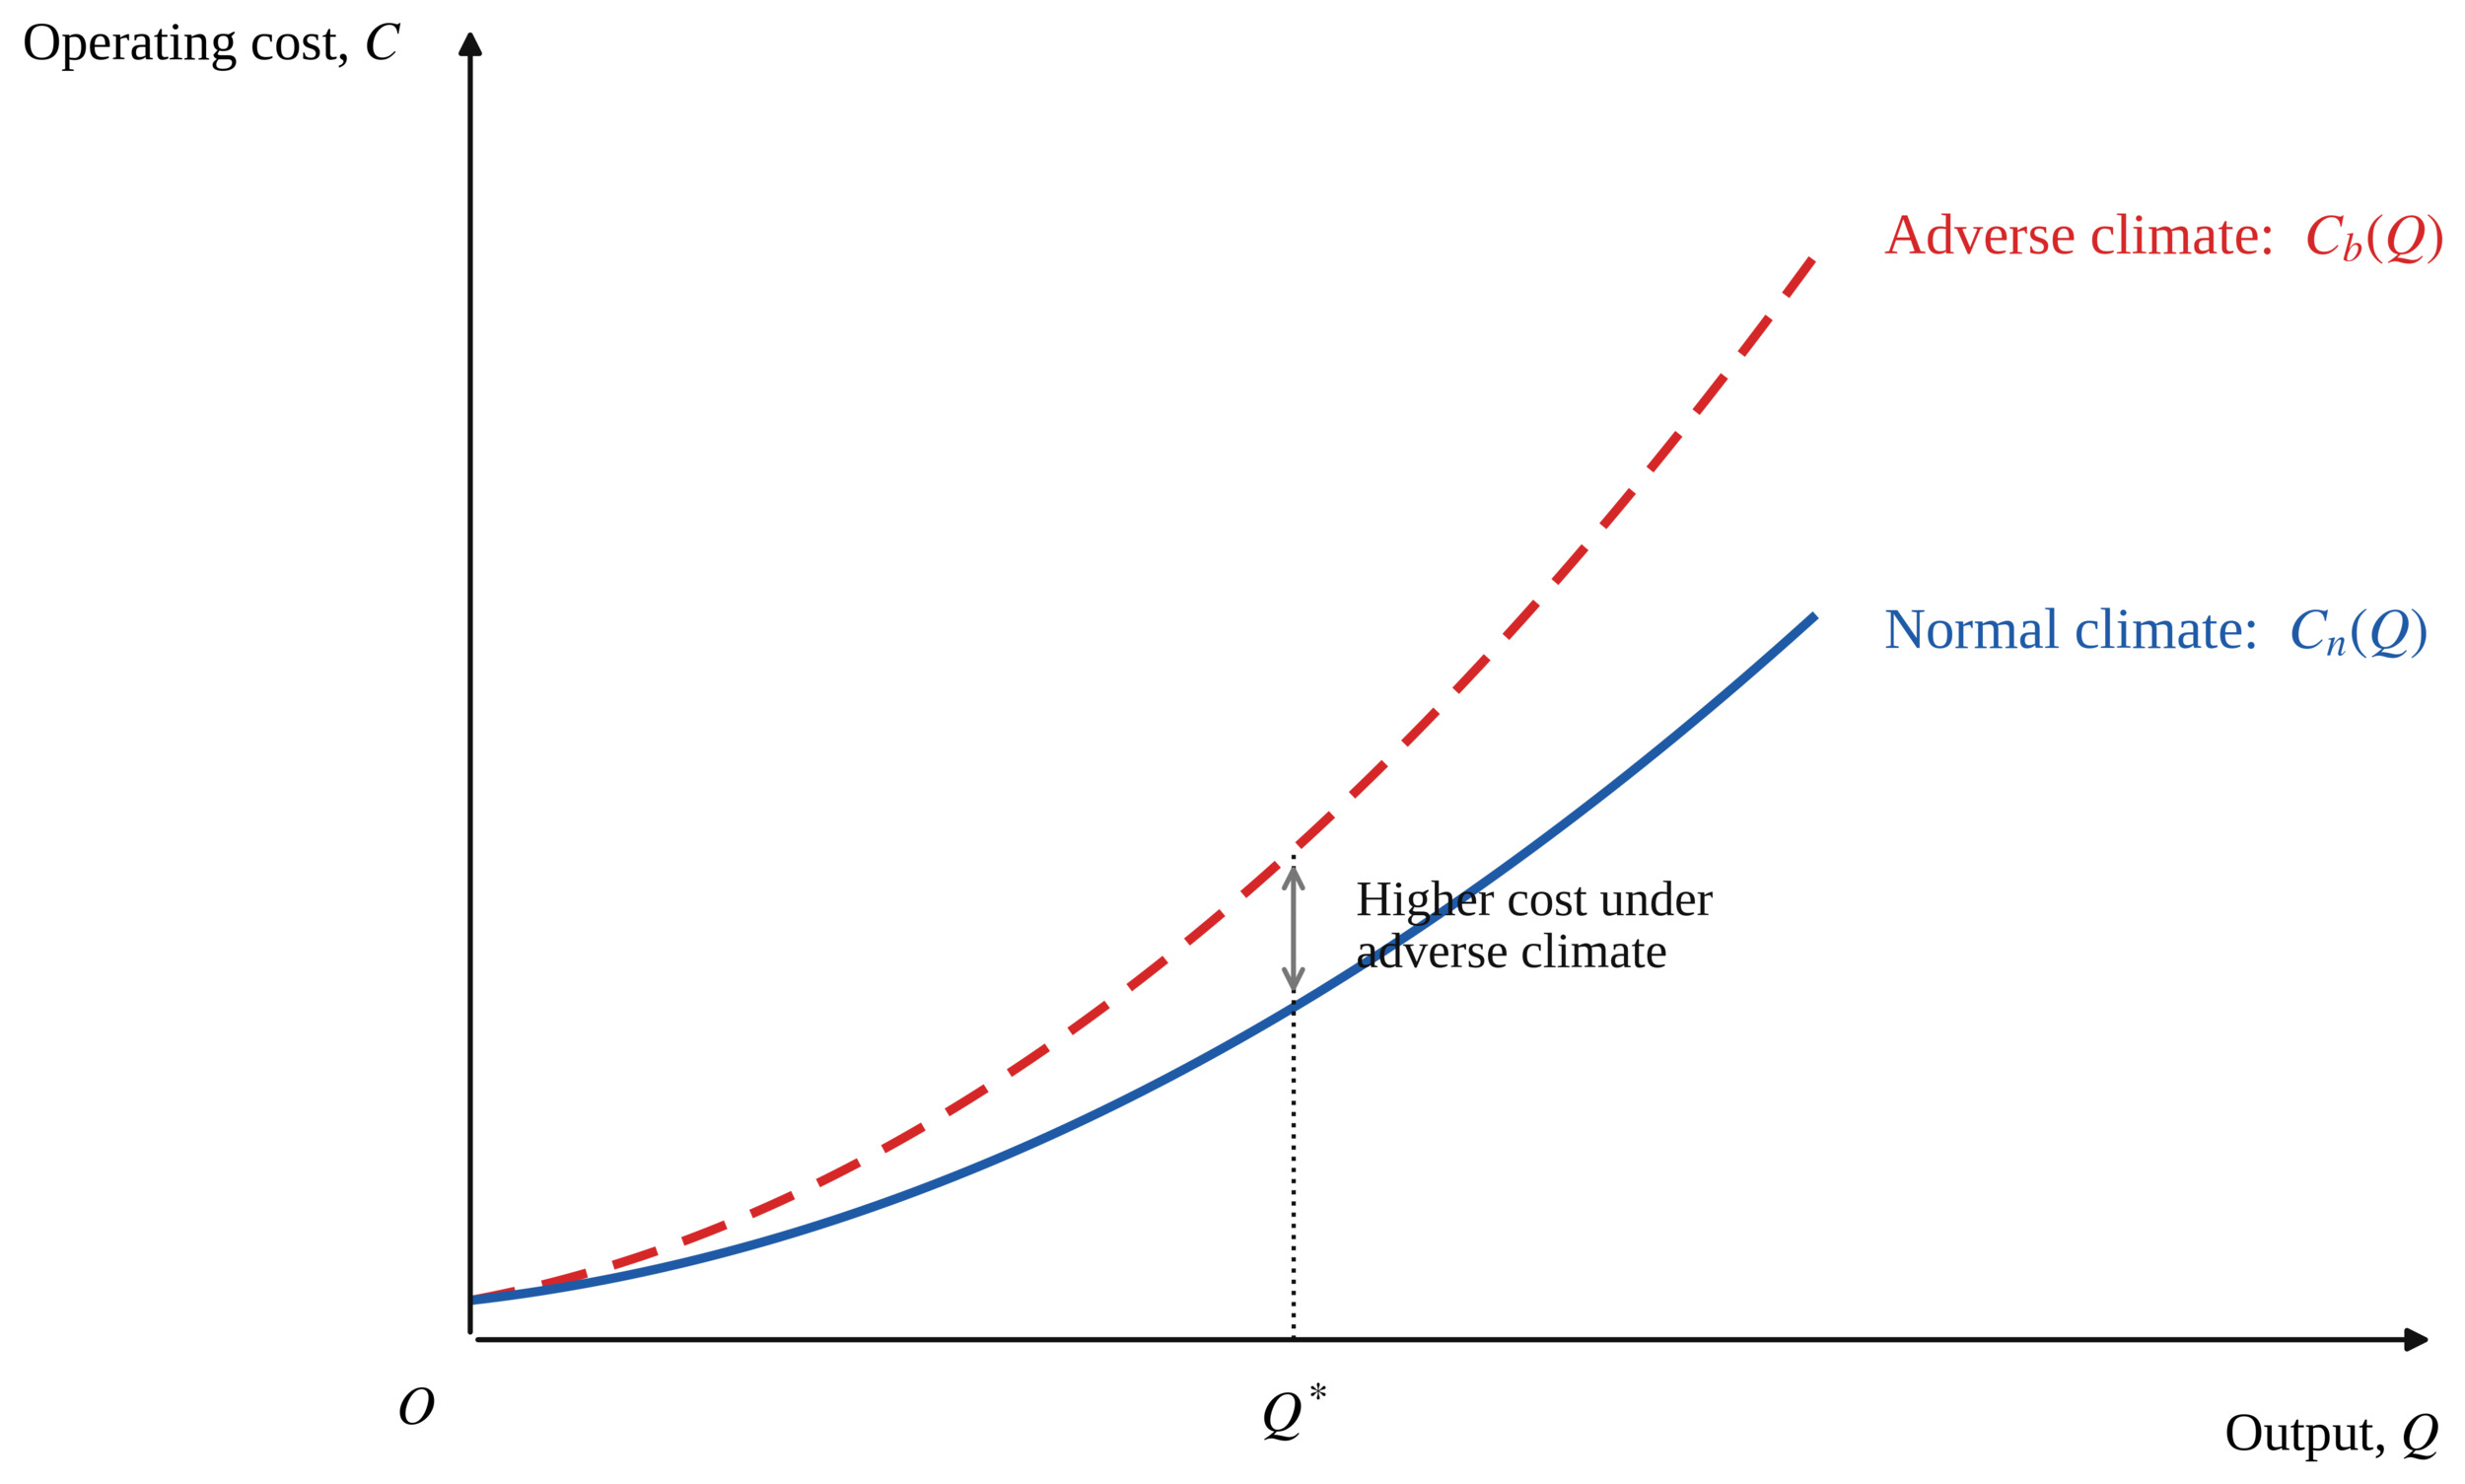
Further consideration is given to corporate cash flow. Assume that the sales price of aquatic products is P, the company’s operating cash expenditure under normal climate conditions is Cn, and the operating cash expenditure under adverse weather conditions is Cb. Because climate shocks increase costs for disease control, facility maintenance, energy consumption, and disaster recovery:
\[C_{b} > C_{n}\]
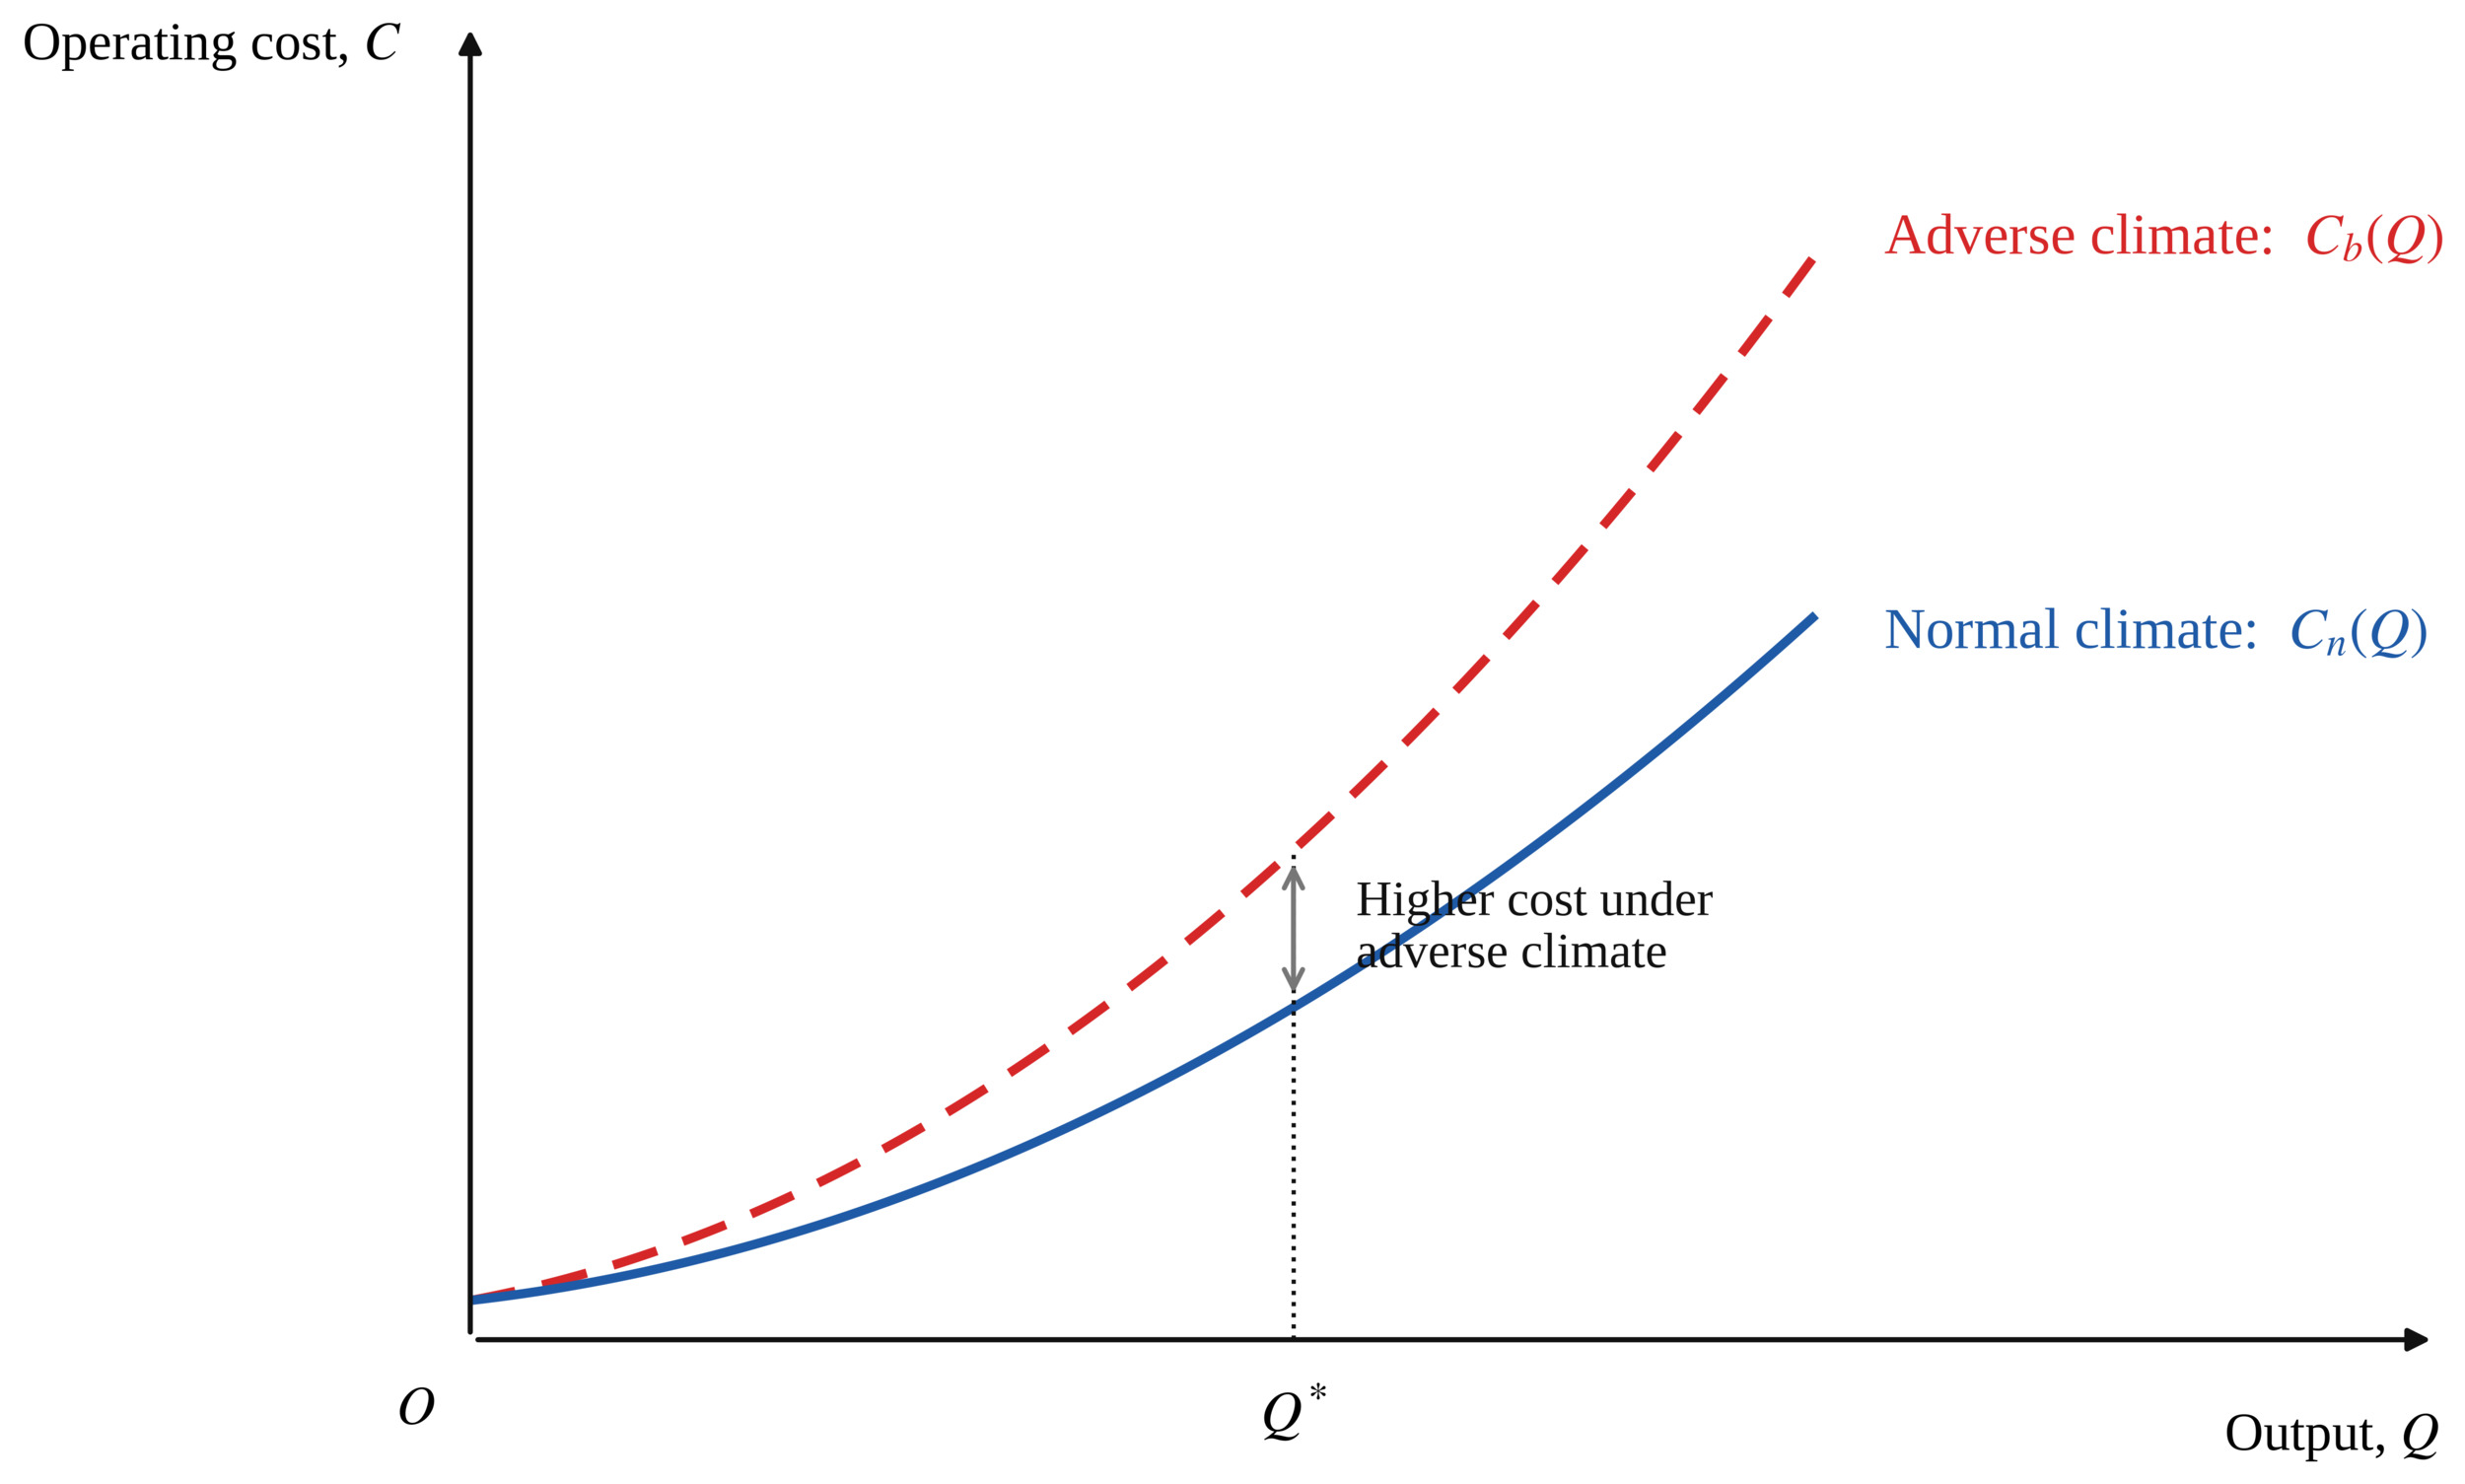
As shown in Figure 2, under the same output level, the operating costs of enterprises under adverse climate conditions are higher than those under normal climate conditions; that is, climate risks will push the enterprise cost-output curve upward.
The operating cash flows formed by the enterprise in the two states are:
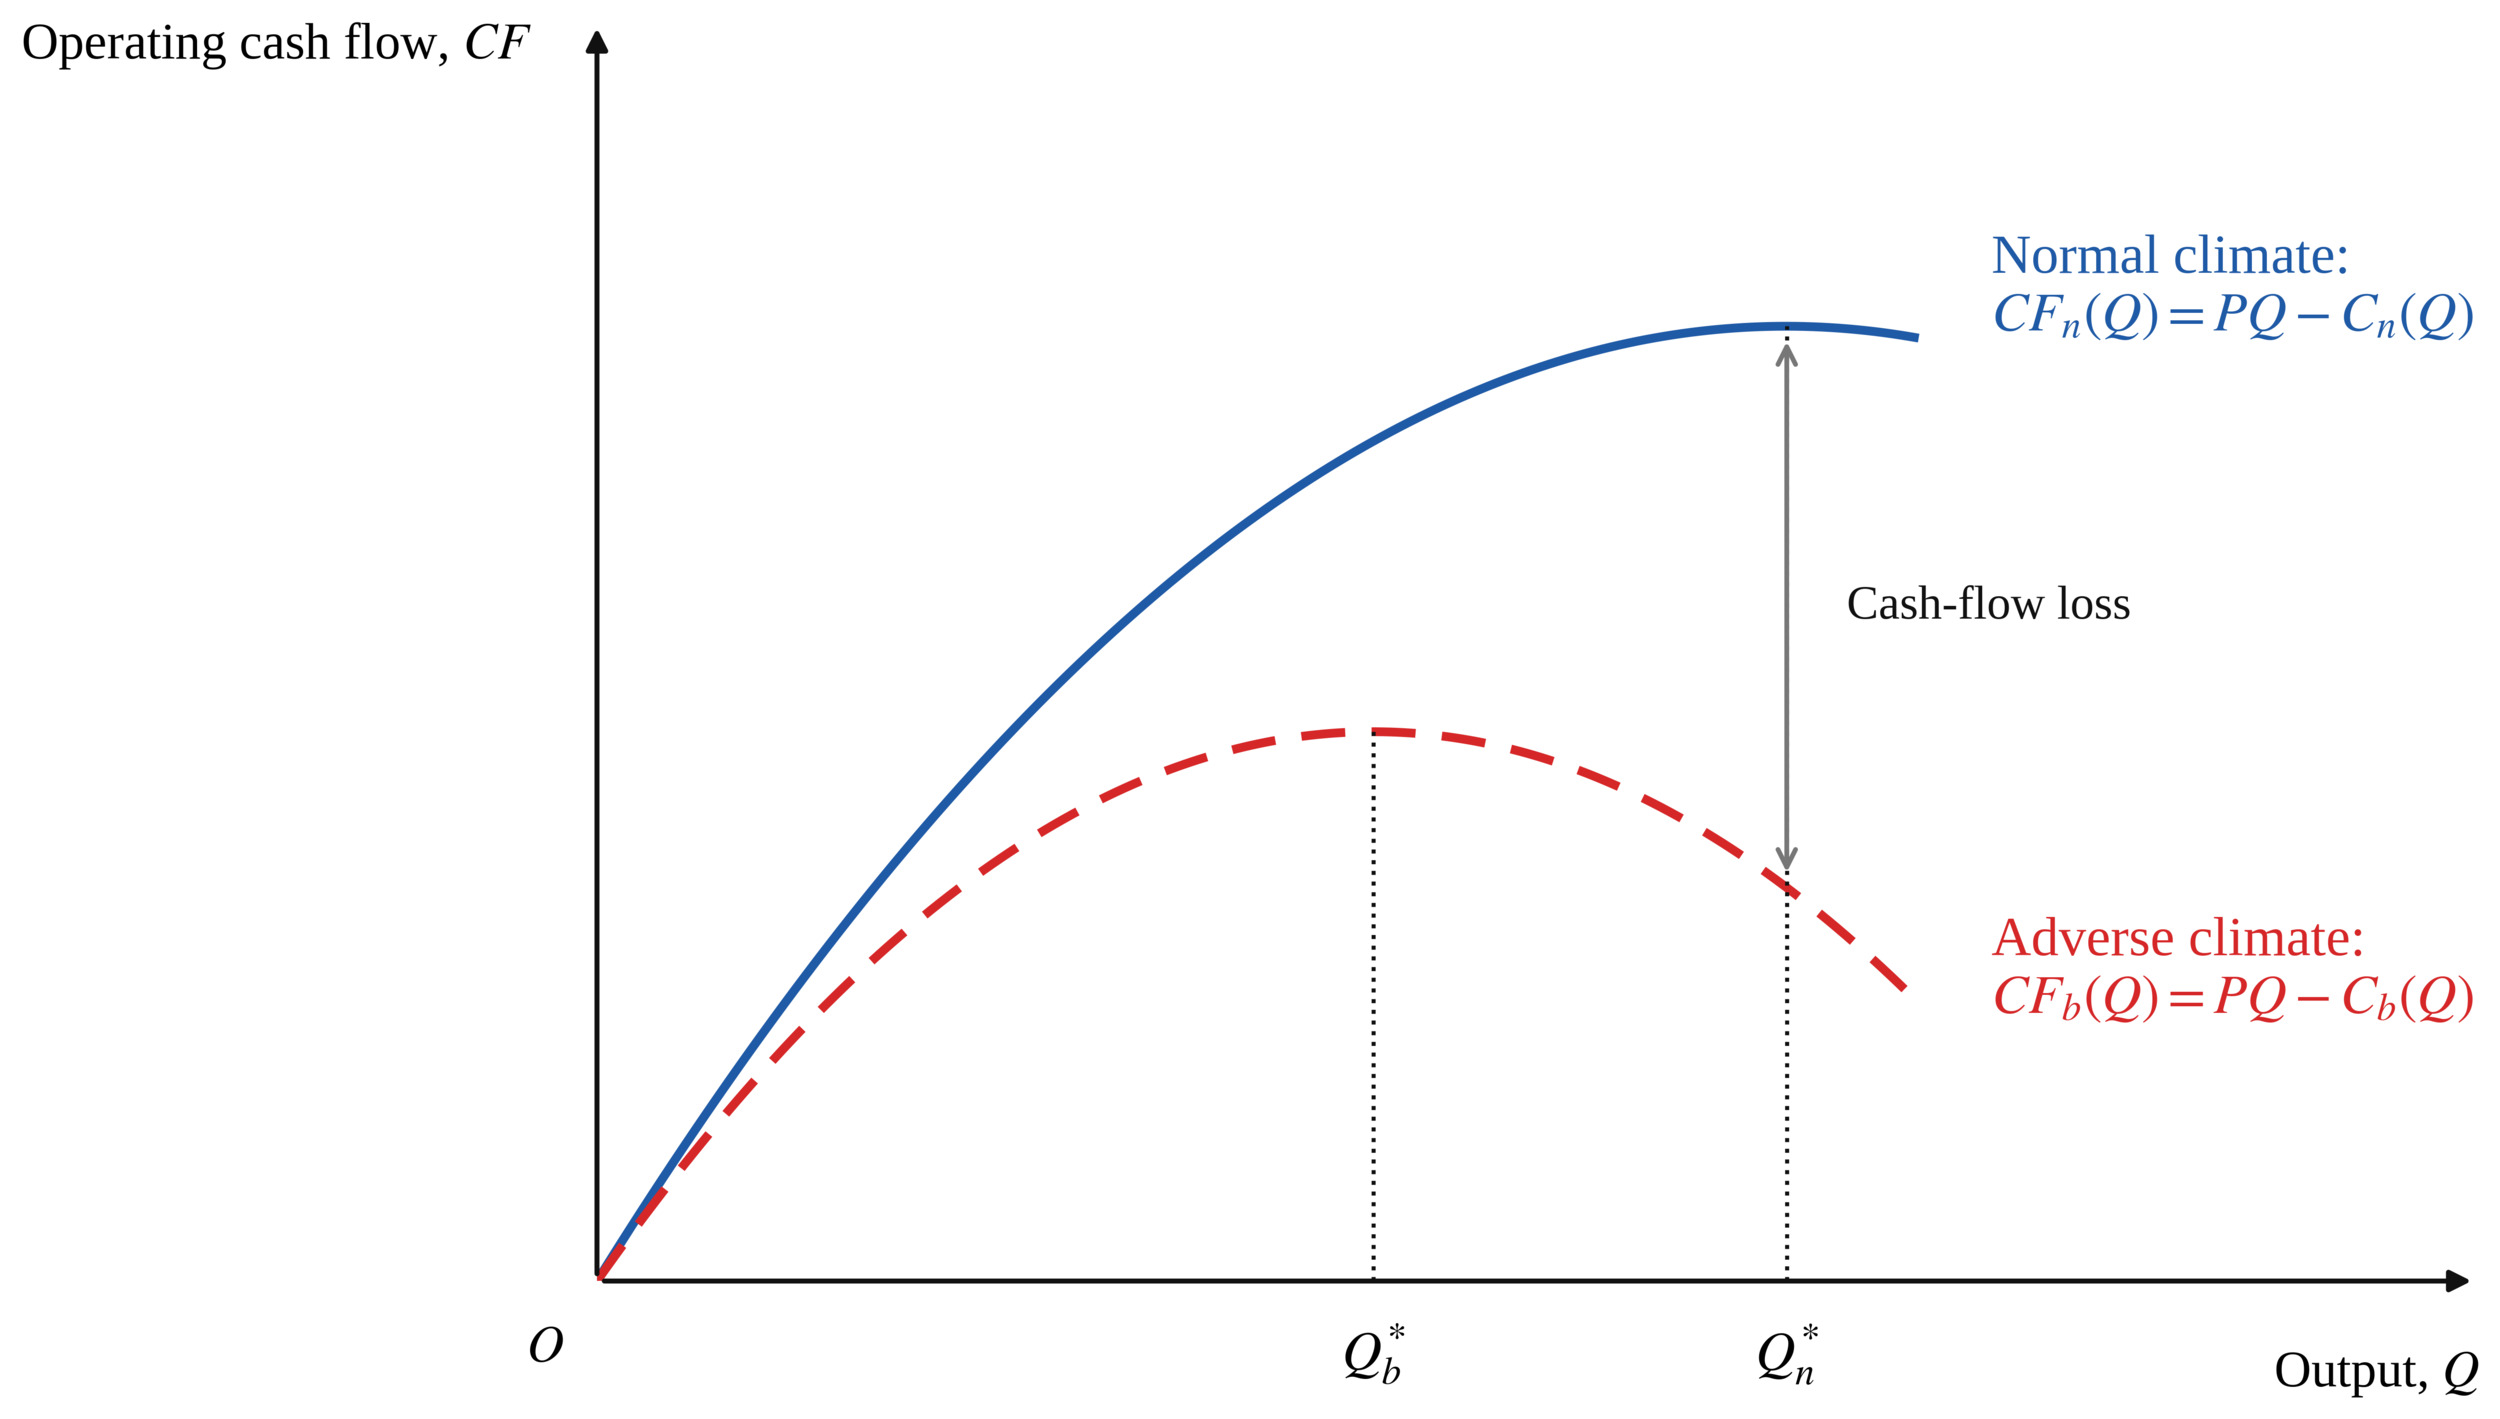
\[CF_{n} = PQ_{n} - C_{n}\]
\[CF_{b} = PQ_{b} - C_{b}\]
because:
\[Q_{b} < Q_{n},\quad C_{b} > C_{n}\]
therefore:
\[CF_{b} < CF_{n}\]
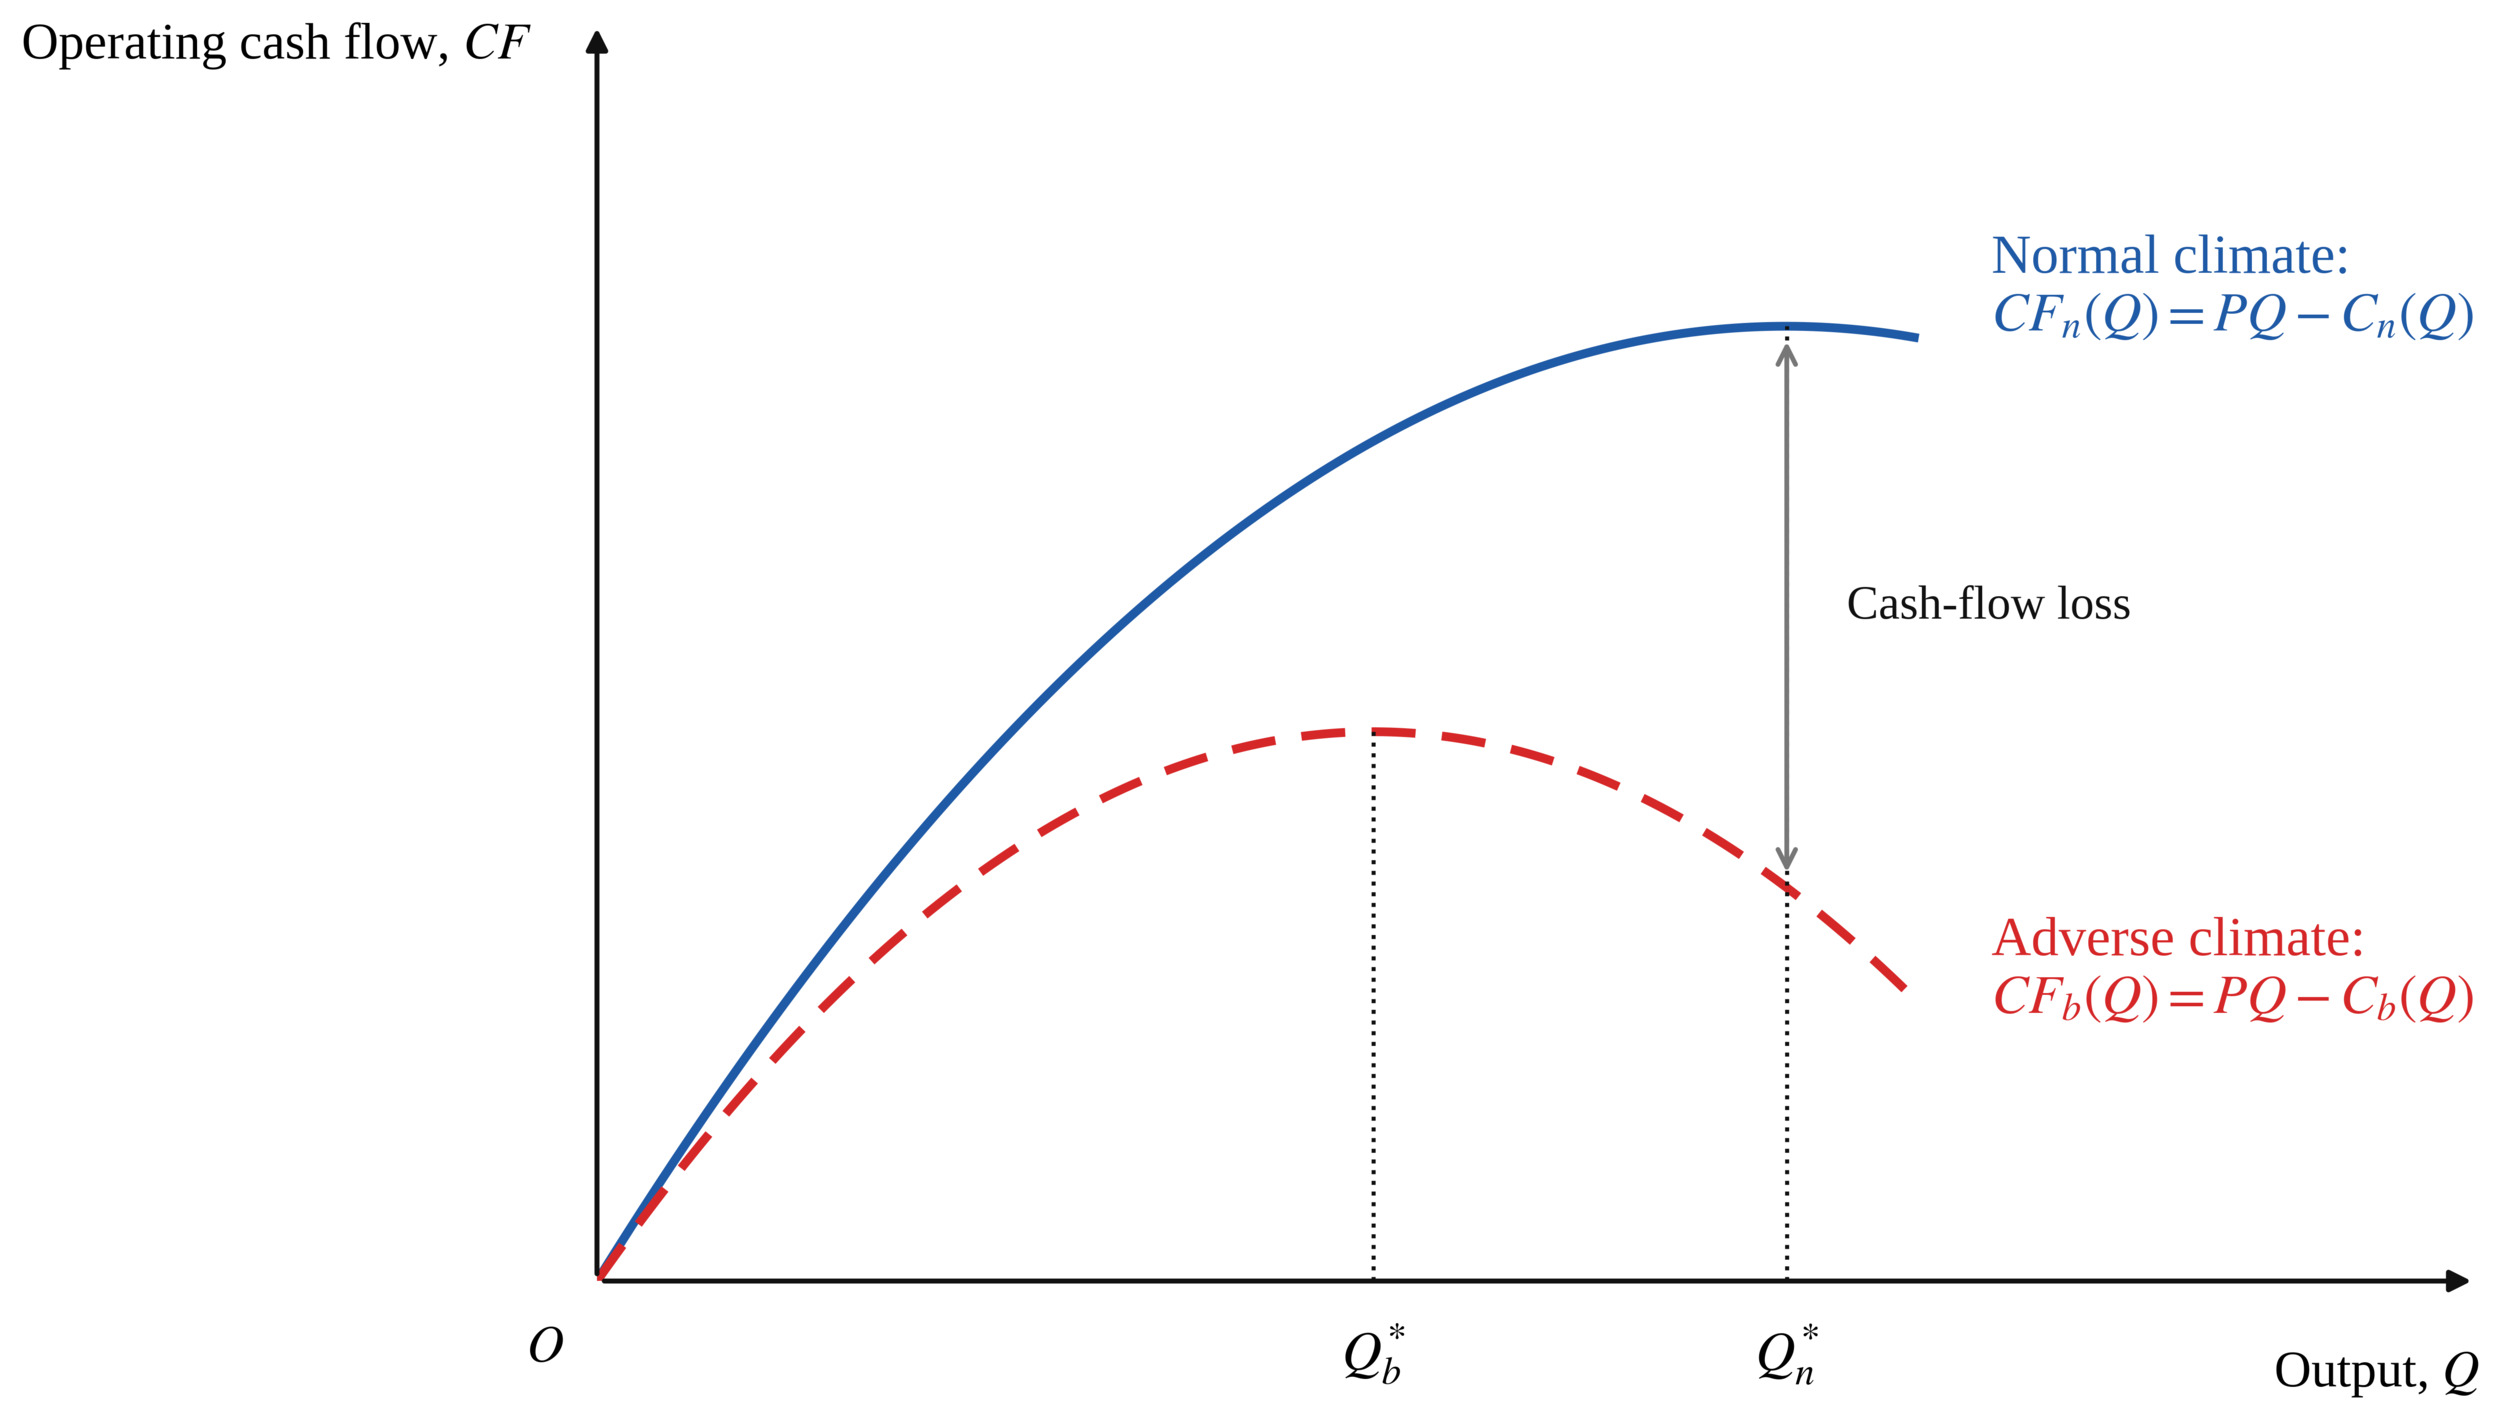
That is, adverse weather conditions will reduce the company’s ability to create operating cash. As shown in Figure 3, the operating cash flow of enterprises under unfavorable climate conditions is lower than that under normal climate conditions, indicating that climate risks weaken enterprises’ cash-flow-generating capacity through the dual channels of “production decline” and “cost increase”.
Furthermore, the expected cash flow of the enterprise can be expressed as:
\[E(CF) = (1 - R)CF_{n} + RCF_{b}\]
Find the partial derivative of R
\[\frac{\partial E(CF)}{\partial R} = CF_{b} - CF_{n}\]
because:
\[CF_{b} < CF_{n}\]
therefore:
\[\frac{\partial E(CF)}{\partial R} < 0\]
The above results indicate that rising climate risks will reduce the expected operating cash flow of listed fisheries companies. The reason is that, on the one hand, climate risks reduce the availability of fishery resources and aquaculture production efficiency, causing corporate output to decline and reduce sales returns; on the other hand, climate risks increase cash expenditures such as production maintenance, disaster prevention and mitigation, and post-disaster recovery, further weakening corporate cash creation capabilities. In addition, considering that fishery products have long production cycles, are perishable and have high storage costs, climate risks may also lead to extended production cycles, inventory backlogs and delays in the collection of accounts receivable, further exacerbating corporate liquidity pressures. Although reduced supply may drive up prices of aquatic products, these price increases are not sufficient to offset cash flow losses from climate shocks because individual companies lack market pricing power, and production losses and reduced product quality are difficult to fully compensate for through price adjustments.
Based on this, the following hypotheses are put forward:
H1: Climate risk significantly reduces the cash-flow level of listed fisheries companies.
4. Research Design and Empirical Results
4.1. Model Specification
In order to test the impact of climate risks on the operating cash flow of listed aquatic companies, this study builds the following model:
\[\begin{align}Cashflow_{i,t}\ = \ & \alpha_{0} + \alpha_{1}ClimateRisk_{i,t} \\&+ \sum_{k}\beta_{k}Control_{k,i,t} + \mu_{i} \\&+ \lambda_{t} + \varepsilon_{i,t}\end{align}\]
Among them, i and t represent the enterprise and year respectively; Cashflowi,t represents the operating cash flow of enterprise i in year t; ClimateRiski,t represents the climate risk faced by enterprise i in year t; Controlk,i,t Represents a series of enterprise-level control variables, including enterprise size (Size), leverage (Lev), return on equity (ROE), enterprise growth (Growth), loss status (Loss), board size (Board), proportion of independent directors (Indep), and audit by the Big Four international accounting firms (Big4).
In addition, μᵢ represents enterprise fixed effects, which are used to control individual differences that do not change over time, such as enterprise resource endowments, business models, management characteristics, and main business structures; λt represents year fixed effects, which are used to control macroeconomic fluctuations, industrial policy adjustments, capital market environment changes, and other common impacts that change over time; εi,t is a random disturbance term, and standard errors are clustered and adjusted at the company level.
4.2. Sample Selection and Data Sources
This study uses Shanghai- and Shenzhen-listed A-share companies in China’s aquatic industry chain from 2010 to 2023 as the research objects. Considering that traditional industry classification may be difficult to completely cover the aquatic industry chain enterprises. Specifically. In addition to companies directly engaged in aquaculture, marine fishing, and other production activities, listed companies whose main business is closely related to aquatic product processing, feed production, aquatic product trade, and other aquatic industry chain links will be included in the research scope to more comprehensively examine the impact of climate risks on the operating cash flow of aquatic industry-related enterprises. The financial data, corporate governance data, and audit agency information for listed companies are primarily sourced from the CSMAR database. For data that is missing or shows obvious discrepancies in the database, supplement it and verify it against the annual reports of listed companies and relevant public disclosure materials. The industry attributes of a company and whether it is a wide-caliber aquatic product company are mainly identified based on the industry classification of listed companies, the main business composition and the business description in the annual report. In terms of sample processing, this study first retains the annual observation values of enterprises belonging to a wide range of aquatic products companies from 2010 to 2023, and deletes samples with missing main research variables, and finally forms unbalanced panel data for empirical testing.
This study selected 2010 as the starting year of the sample interval, mainly for the following two reasons: first, the 2008 global financial crisis had a profound systemic impact on the macro economy and capital markets, and its lag effect may last for several years. If the research starting point is set too early, it will be difficult to effectively strip away the residual interference from the financial crisis on the cash flow of fishery-listed companies, thereby affecting the accuracy of identifying climate risk variables. Starting in 2010, it can largely avoid interference from this confounding factor. Secondly, after 2010, the financial reporting disclosure system of Chinese fishery listed companies has become more perfect, and the availability of key financial data, such as cash flow statements, has significantly improved. The continuity and completeness of data sequences have been guaranteed, providing a reliable data foundation for constructing long-term panel data.
4.3. Variable Definitions
4.3.1. Dependent Variable
The explained variable in this study is operating cash flow (Cashflow). Operating cash flow can reflect the company’s ability to obtain cash through daily production and operating activities, and is an important indicator to measure the company’s business continuity, internal fund supply capabilities and short-term financial stability.
Compared with accounting profits, operating cash flow is less affected by accrual adjustments and accounting policy choices and can more directly reflect the actual cash inflows and outflows generated by an enterprise’s production and operating activities. For aquatic enterprises, their production and operations are easily affected by factors such as water temperature, precipitation, typhoons, floods, diseases, and changes in the marine environment. Climate shocks may simultaneously cause production declines, aquaculture losses, rising raw material prices, transportation obstructions, and damage to production facilities. Related impacts will ultimately be reflected in changes in cash flow from operating activities.
This article matches regional climate risk indicators with the registered business location of enterprises. This design can capture the external physical climate exposure faced by enterprises operating in the same region’s production, logistics, and regulatory environment. This data is sourced from the CSMAR database. Previous research focusing on the corporate level has mostly constructed climate risk indices through management analysis and discussion. However, this approach has two obvious shortcomings: first, MD&A texts essentially reflect management’s subjective perception and willingness to disclose climate risk, rather than the actual level of climate risk faced by the enterprise. In fact, management may deliberately downplay or exaggerate climate risks for reasons such as reputation management, responsibility avoidance, or catering to ESG ratings. The second issue is that MD&A text indicators have obvious endogeneity problems, that is, the climate risk disclosure behavior of enterprises may be influenced by factors such as their financial status and governance level. Therefore, this article adopts a regional-level climate risk index to avoid disclosure bias and estimation bias of reverse causality.
Specifically, this study uses the net cash flow generated by the company’s operating activities, normalized by total assets, to measure operating cash flow. The larger the value of this indicator, the stronger the company’s ability to generate cash from its core business activities; conversely, a lower value indicates a relatively weak ability to generate cash from operating activities.
4.3.2. Control Variables
In order to alleviate the interference of differences in corporate characteristics on operating cash flow as much as possible, this study refers to relevant research in the field of corporate cash flow and the economic consequences of climate risks, and selects control variables from aspects such as corporate size, capital structure, profitability, growth, loss status, corporate governance and external audit. In addition, to mitigate time-invariant perturbations in individual characteristics and potential common shocks within the same period, we control for firm and year fixed effects. See Table 1 for variable definitions.
4.4. Descriptive Statistics
Table 2 reports the descriptive statistics for the variables in model (1). The mean value of cash flow (Cashflow) is 0.0585, and the standard deviation is 0.0644, indicating that the sample enterprises maintain positive operating cash flow overall, though there are differences across enterprises. The mean value of the climate risk index is 45.7459, the standard deviation is 8.2362, and the minimum and maximum values are 25.8066 and 84.3409, respectively, indicating that there are obvious differences in climate risk levels between different regions, which provides a good sample basis for this study to study the economic consequences of climate risks. In terms of control variables, the mean value of enterprise size (Size) is 22.5700, and the mean value of leverage (Lev) is 0.4617, indicating that the sample enterprise as a whole has a certain scale and debt level; the standard deviation of return on equity (ROE) and growth (Growth) is large, indicating that there is great heterogeneity in operating performance and growth capabilities among different listed fisheries companies.
4.5. Spatiotemporal Evolution of the Climate Risk Index
4.5.1. National and Regional Temporal Evolution
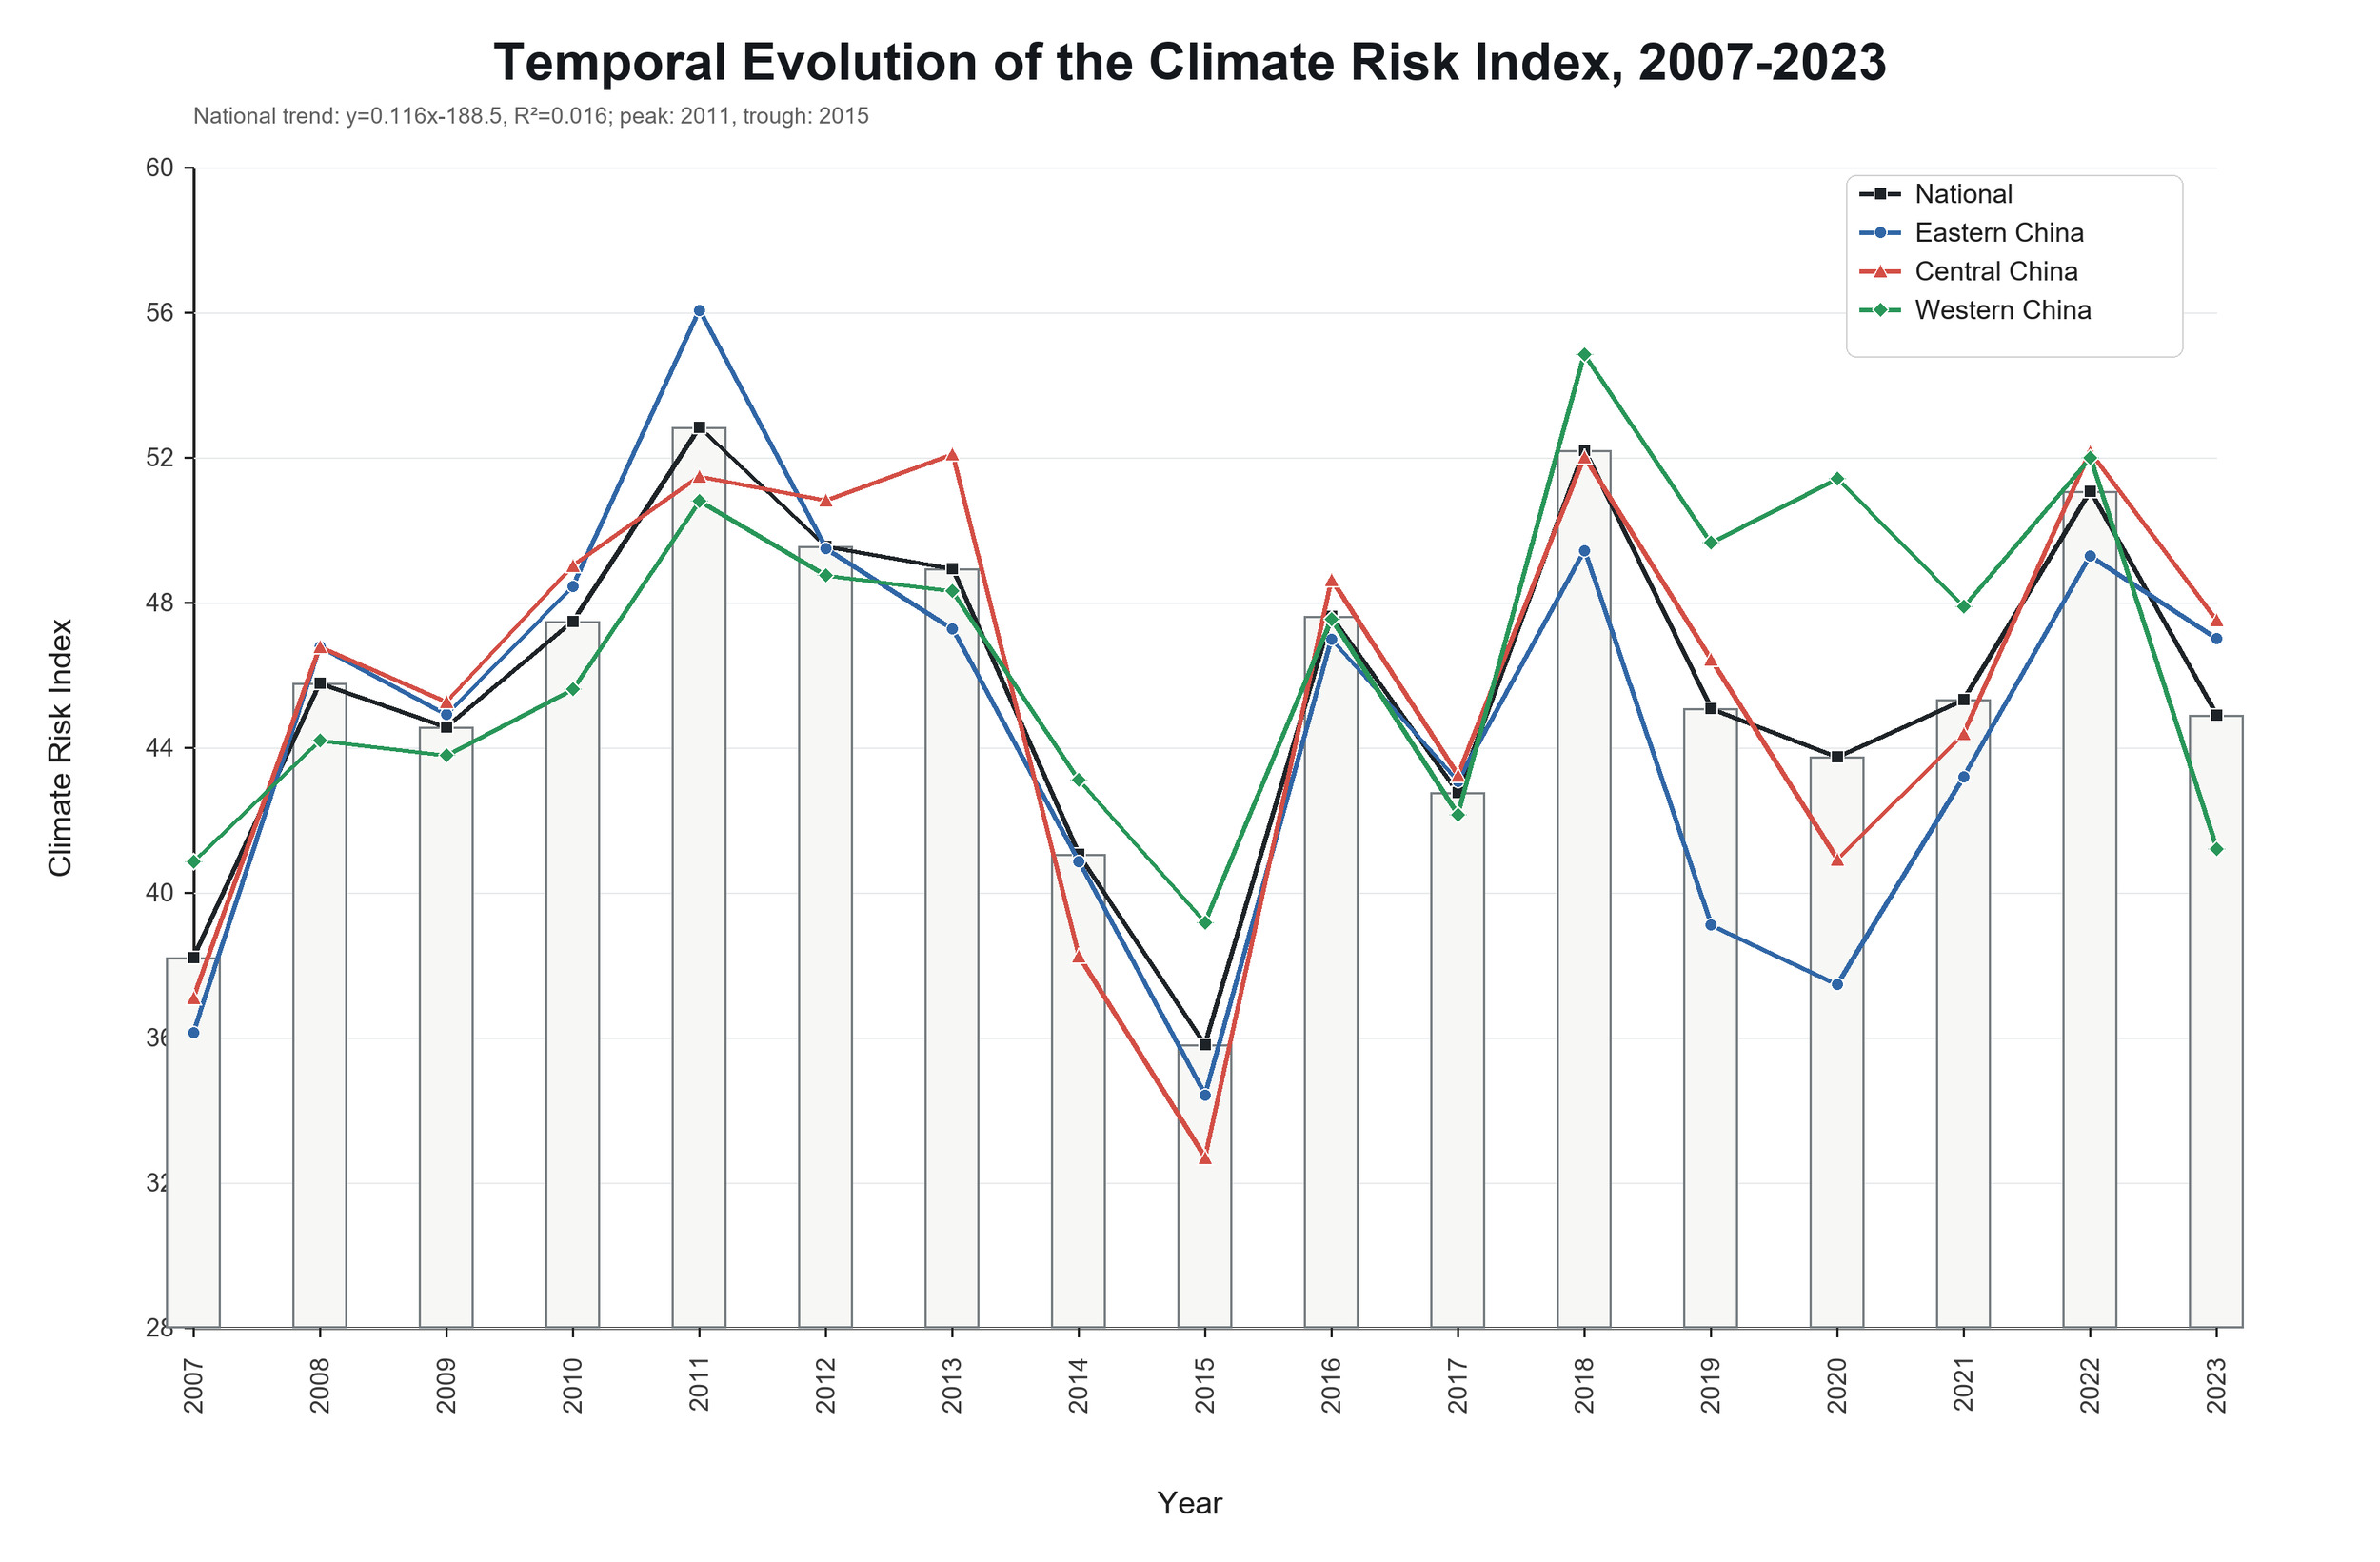
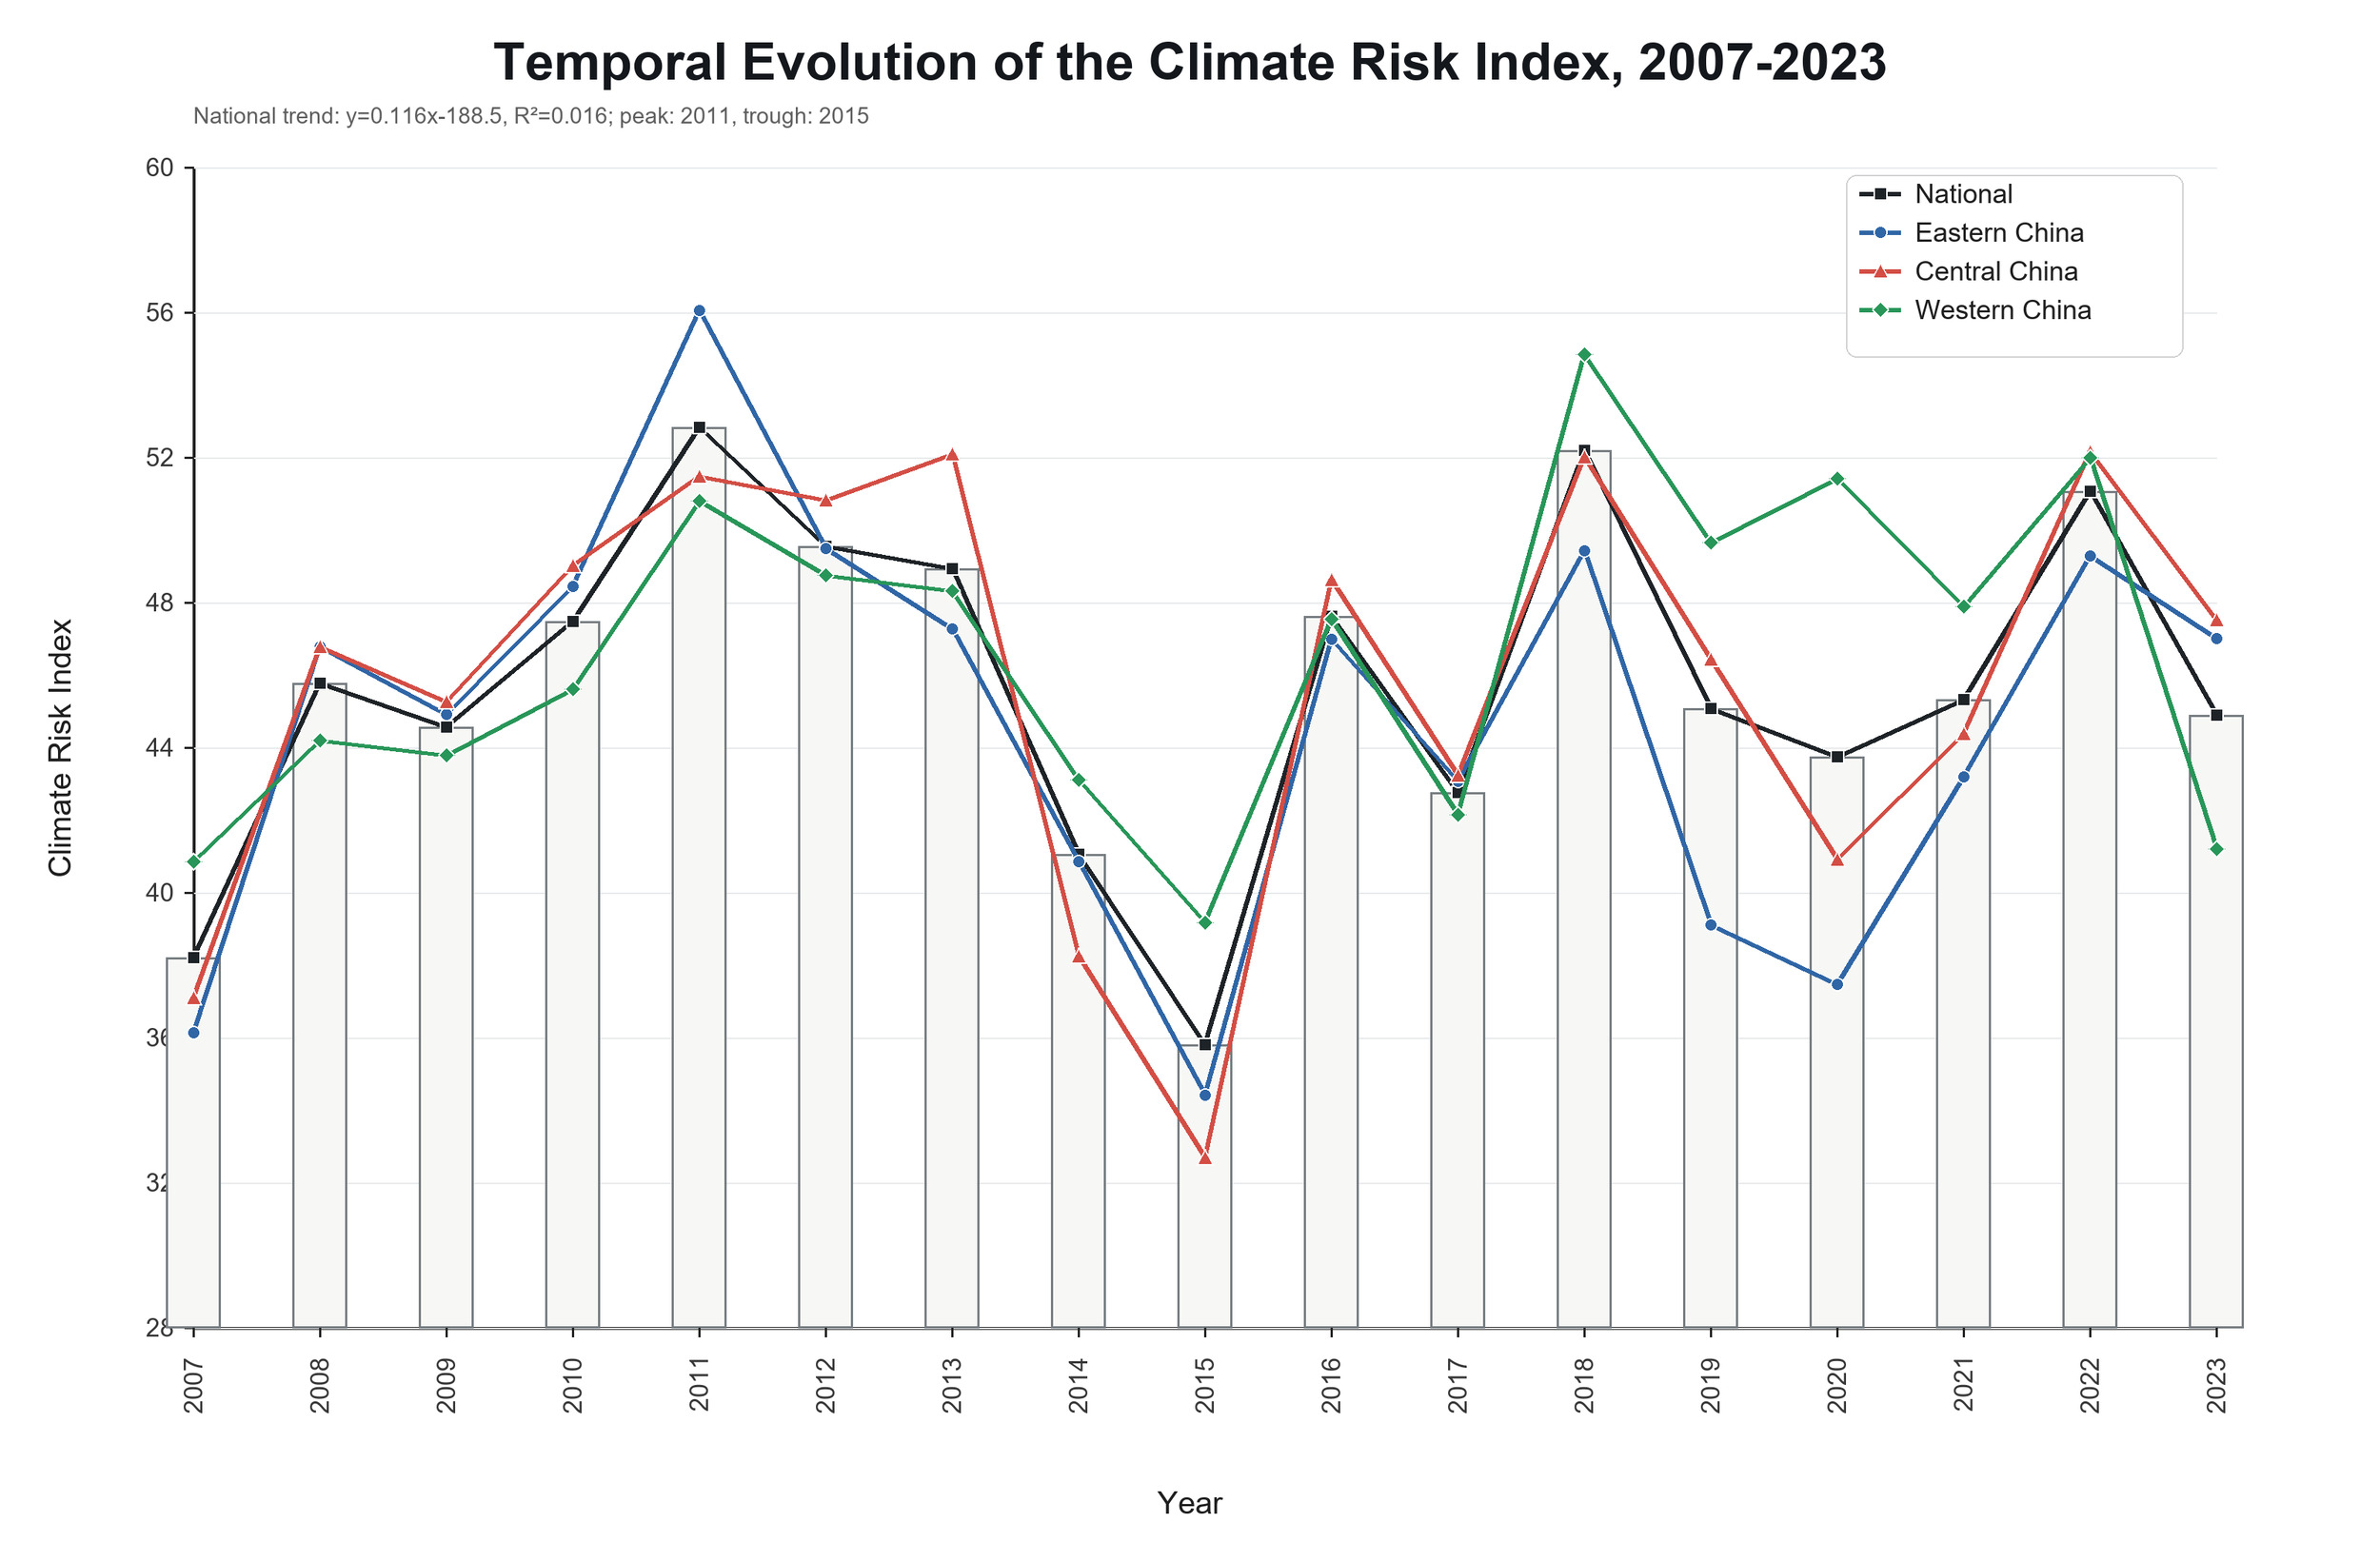
Based on the overall trend, China’s climate risk level fluctuated to some extent during the sample period. The climate risk index increased from 38.21 in 2007 to 44.89 in 2023 (Figure 4), with the highest value in 2011 (52.84) and the lowest value in 2015 (35.81). This change shows that climate risks do not follow a simple linear growth trend but are influenced by extreme climate events and other factors, with significant fluctuations across years.
Looking further at regional differences, there is heterogeneity in climate risk change trends across regions. The climate risk index in the eastern region rose from 36.14 to 47.01, maintaining a high level overall, but the long-term change trend is not obvious; the central region rose from 37.09 to 47.52, showing a relatively stable growth trend; the initial climate risk level in the western region was higher, changing from 40.85 to 41.19, with a smaller overall change, but more obvious fluctuation characteristics. Overall, there are differences in how climate risks evolve across regions, indicating that they have clear regional characteristics.
4.5.2. Kernel Density Evolution
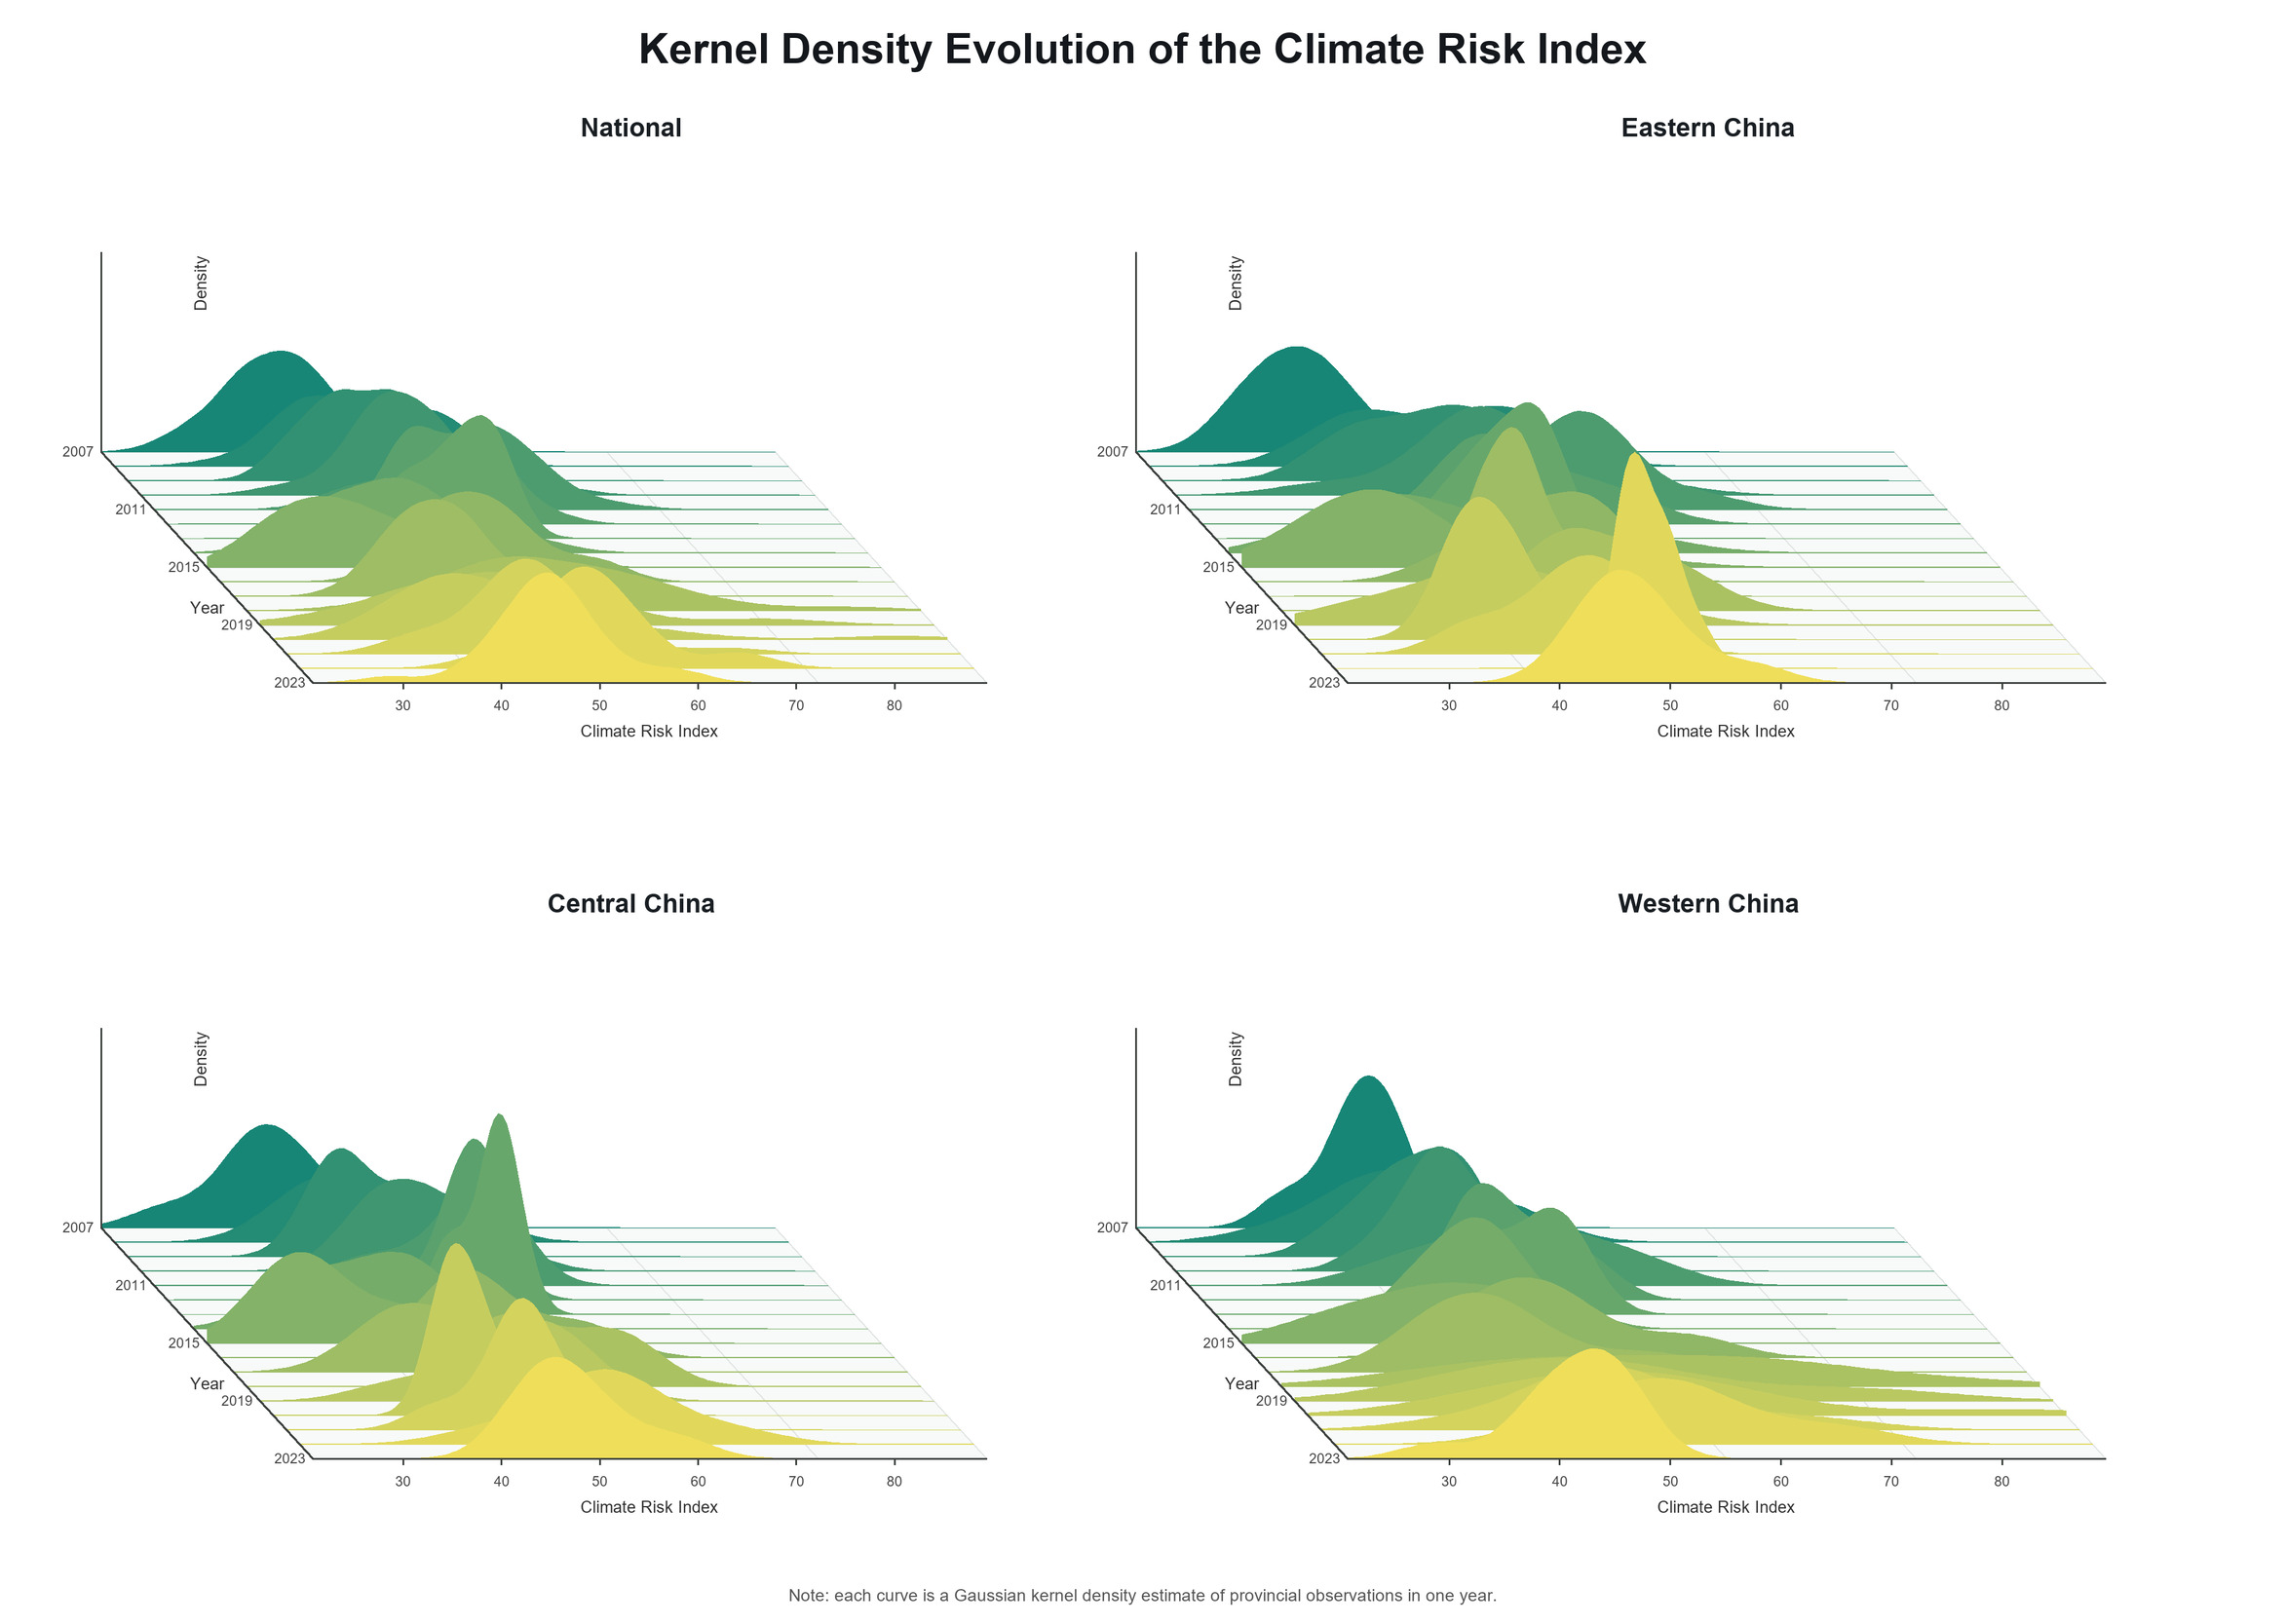
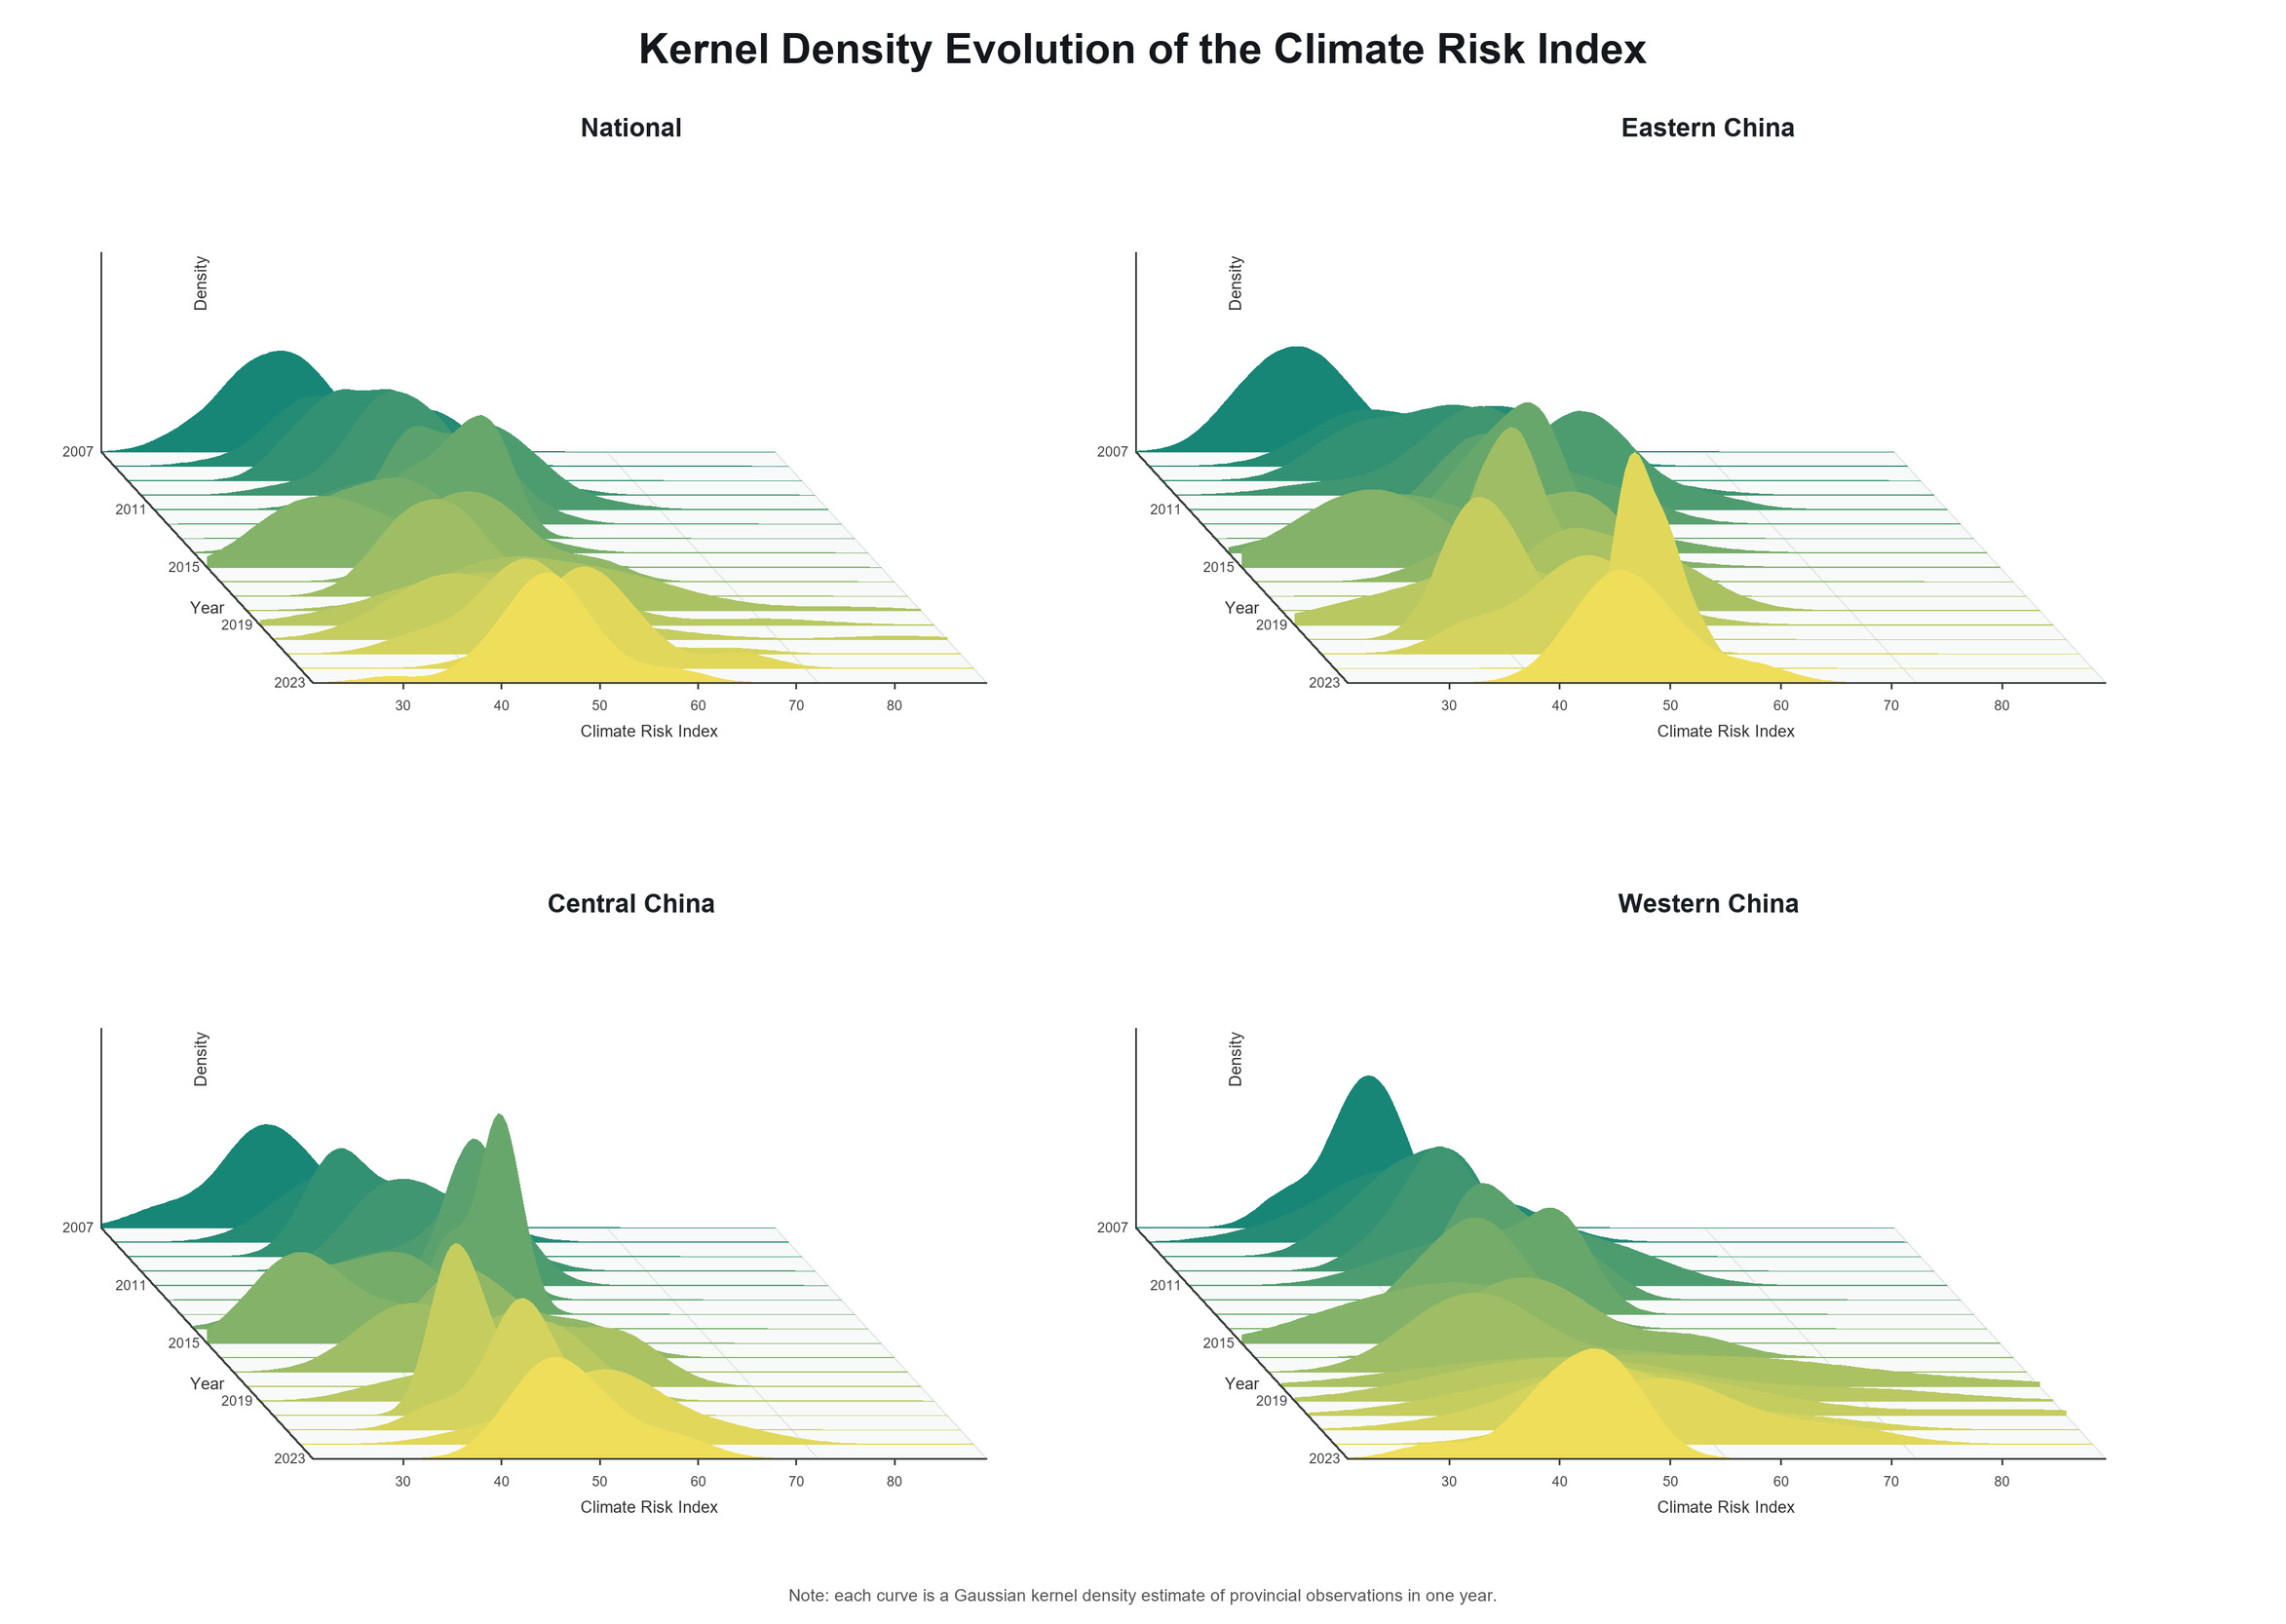
From a regional perspective, there are clear differences in the evolution trends of climate risks across the three major regions (Figure 5). The overall risk level in the eastern region is relatively high, and the distribution range gradually moves toward high values; the risk distribution in the central region changes more obviously, and the proportion of high-risk areas has increased in recent years; although the overall change in the western region is relatively limited, the distribution range is wide, indicating that there are still large risk differences between different provinces.
Overall, climate risks exhibit clear temporal evolution and regional heterogeneity. For listed fisheries companies that rely on the natural environment, the degree of climate impact varies across regions. Therefore, in subsequent empirical analysis, this study further controls for region and year fixed effects to identify the net impact of climate risks on corporate operating cash flows.
4.5.3. Provincial Spatiotemporal Differentiation
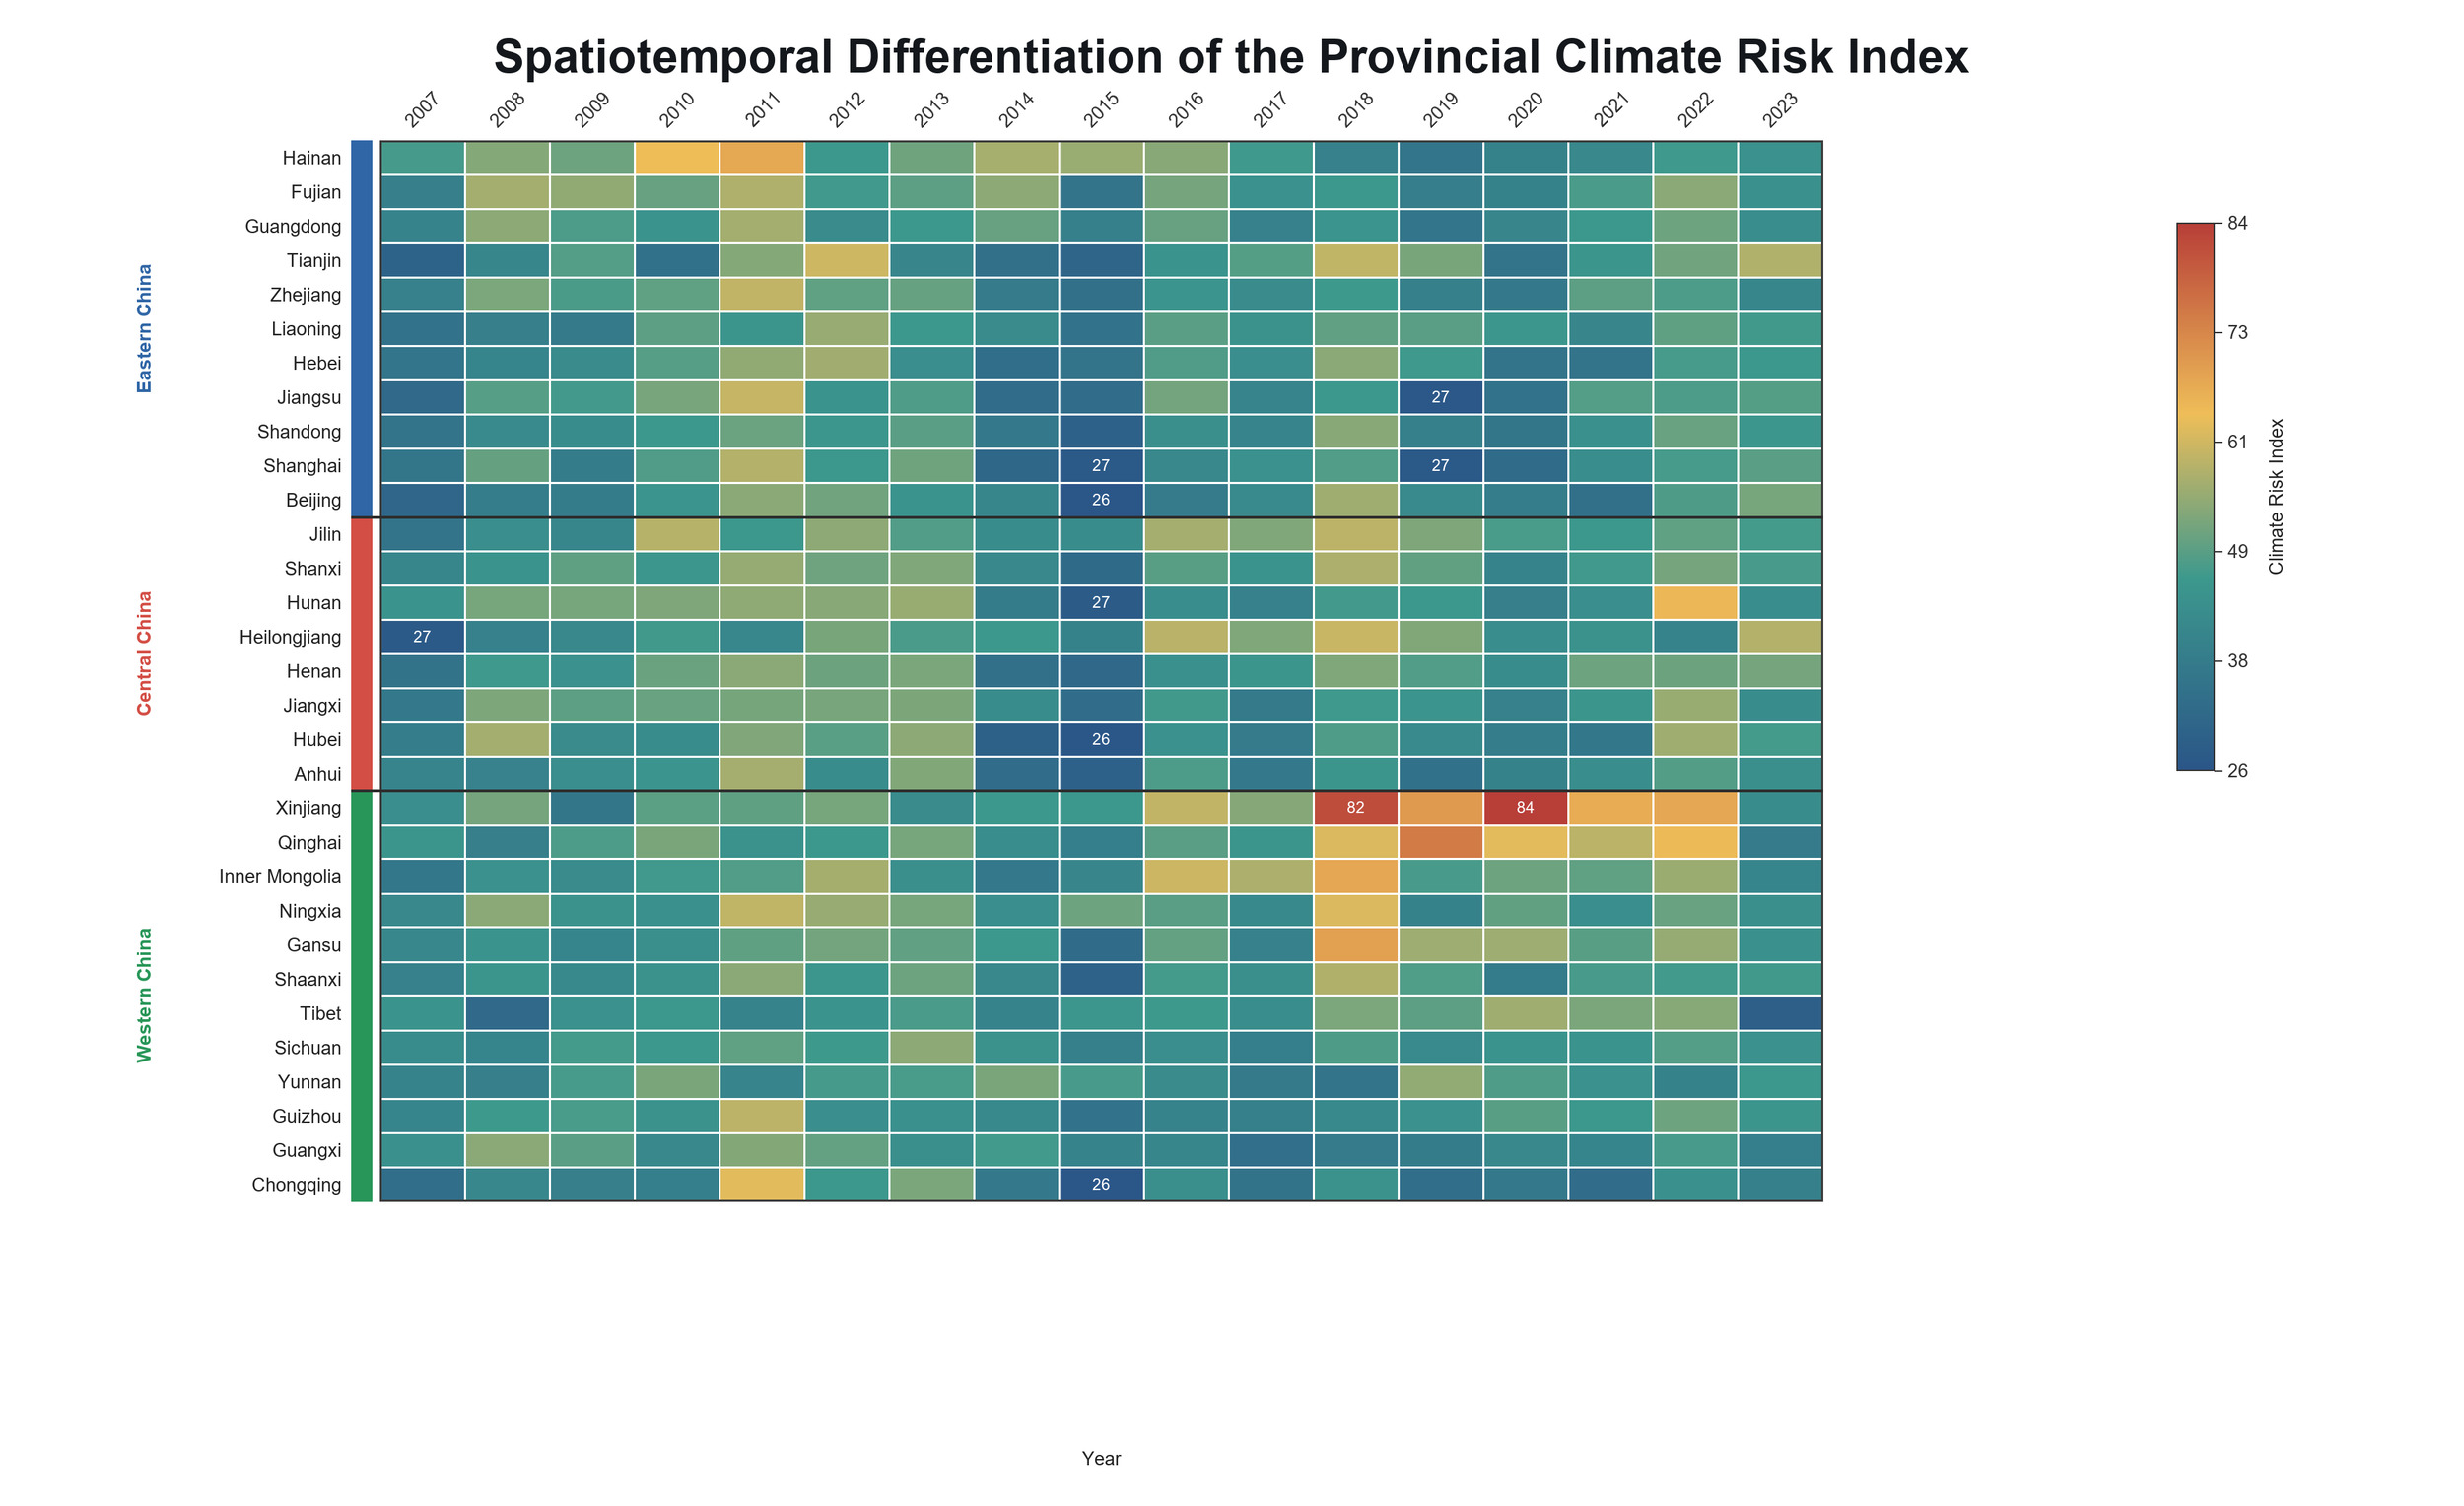
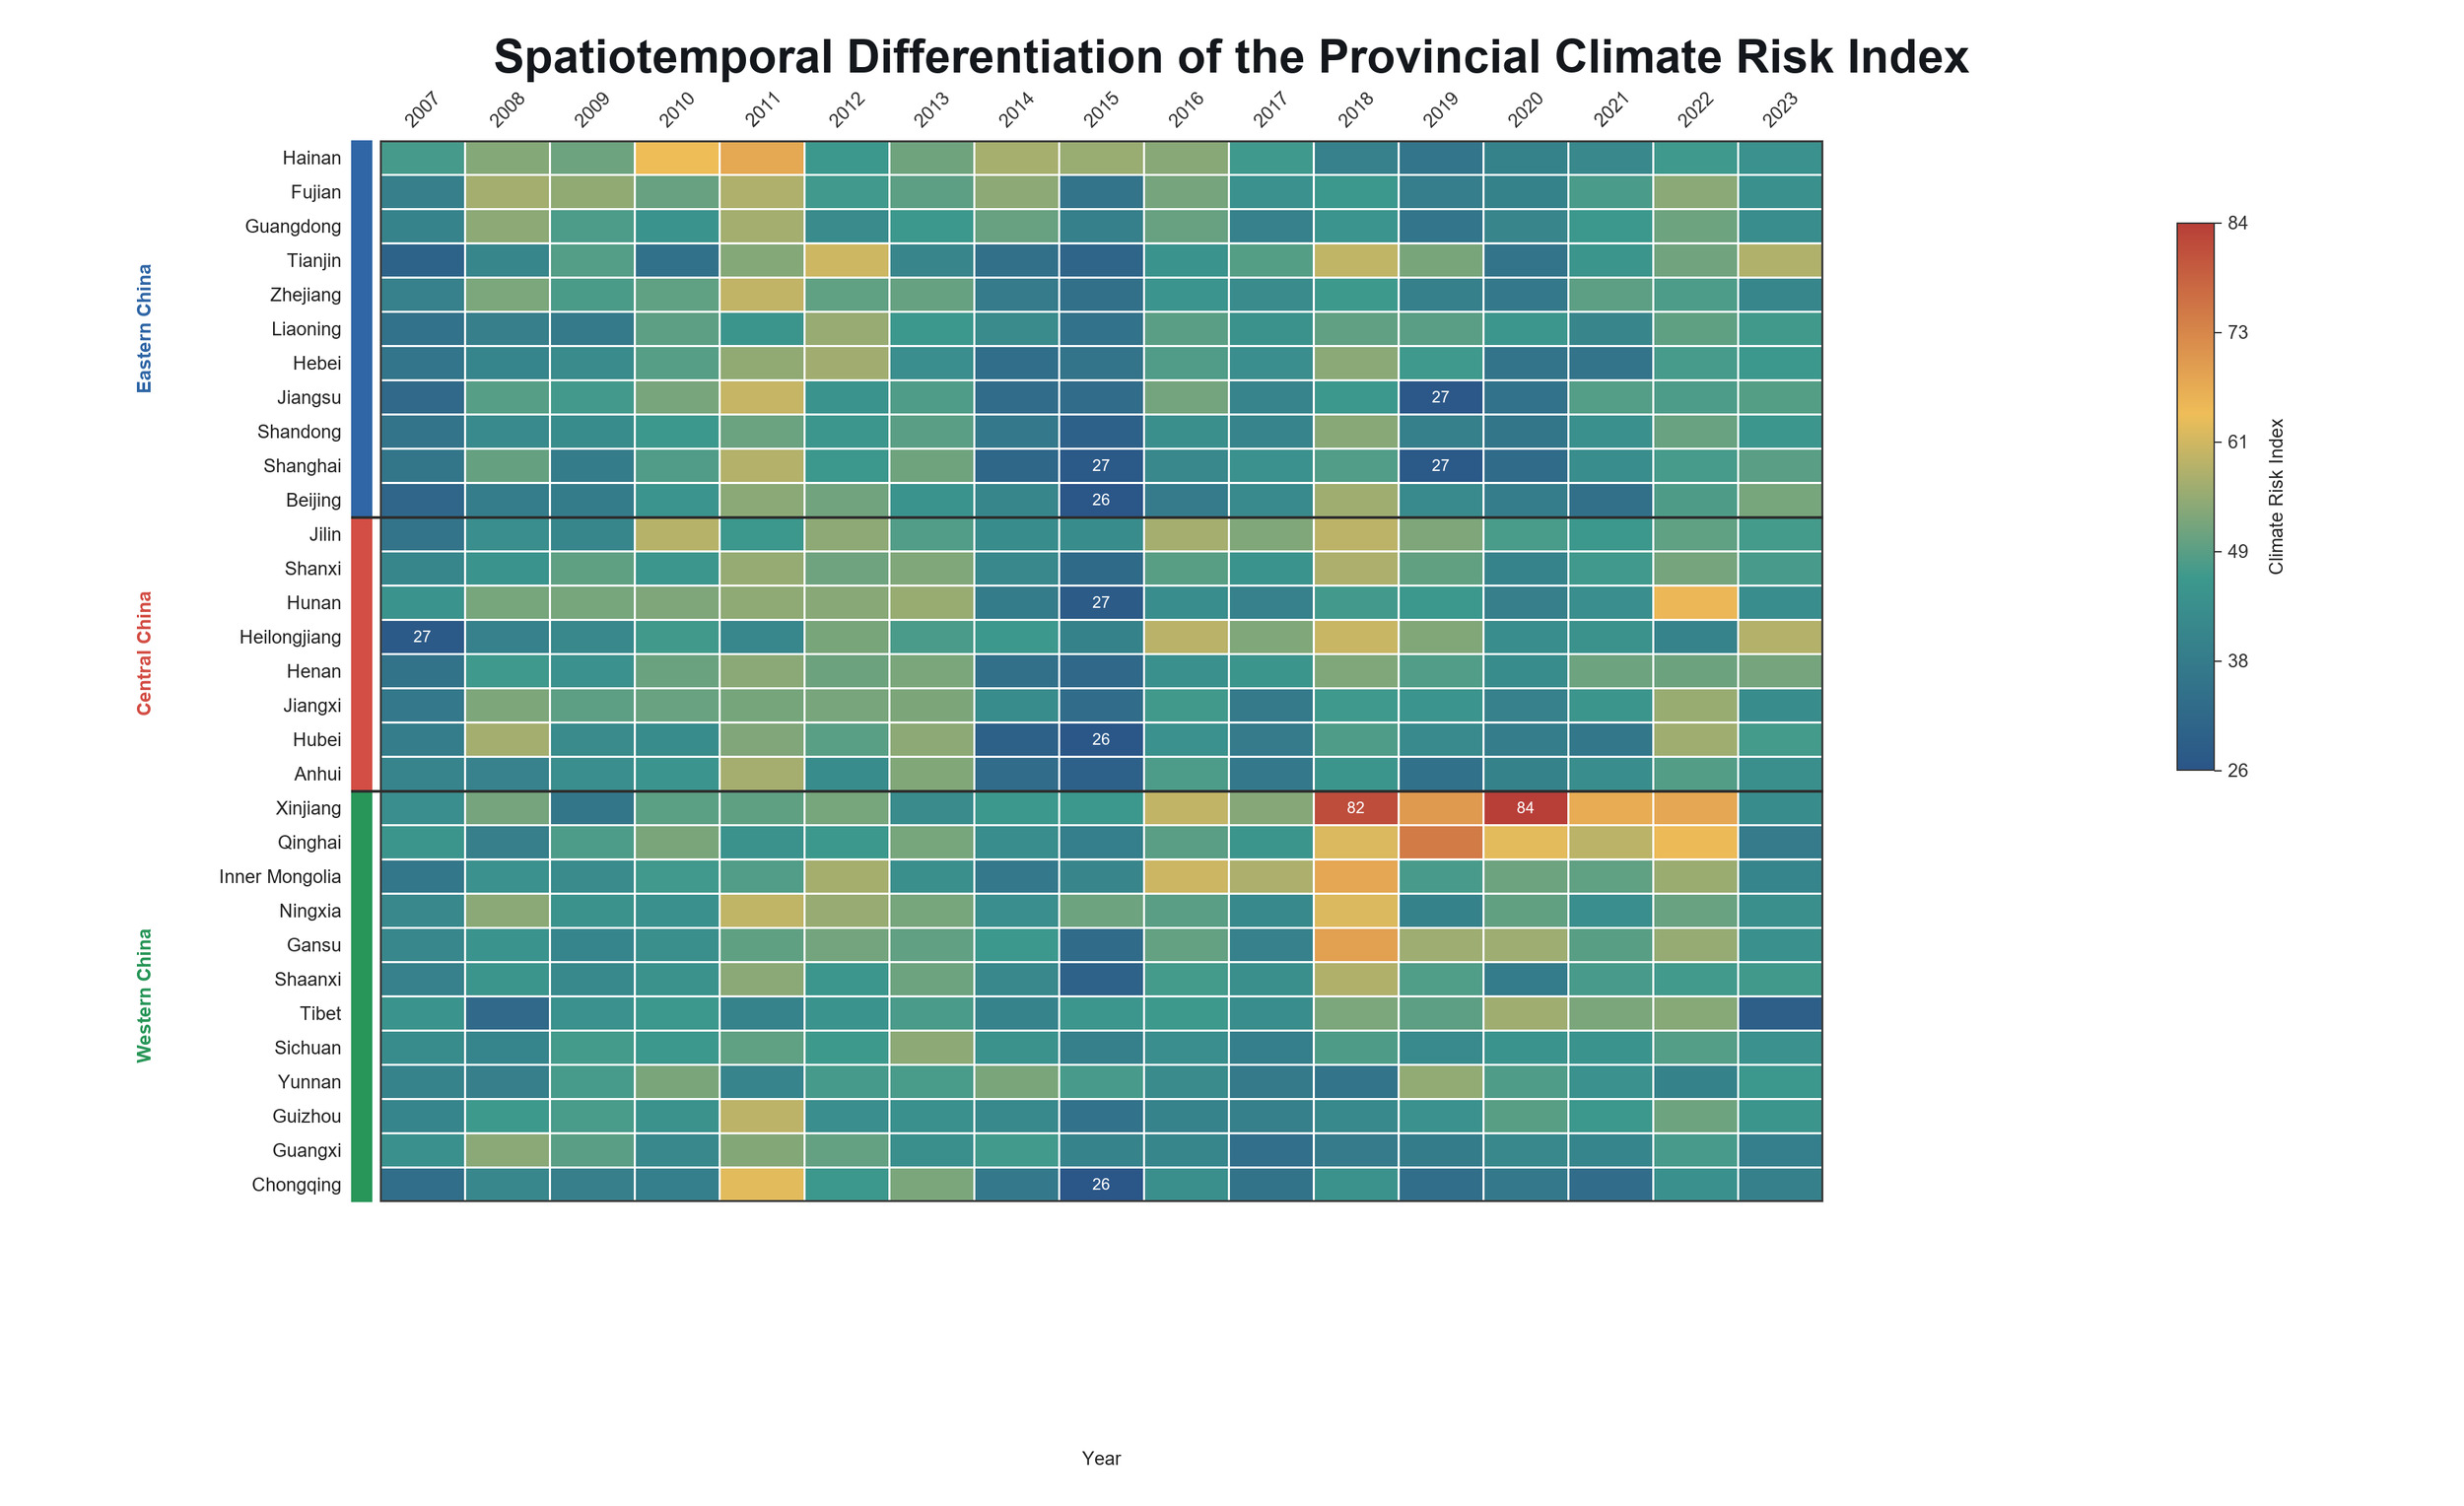
The heat map shows stable differences and annual jumps between provinces (Figure 6). Provinces with higher average risks during the sample period include Xinjiang Uygur Autonomous Region, Qinghai Province, Hainan Province, Inner Mongolia Autonomous Region, and Ningxia Hui Autonomous Region. These provinces have maintained relatively high risk intensity in many years, indicating that their risks may be related to long-term climate exposure, geographical location or frequency of extreme weather. In addition, the same region is not completely consistent, and the risk structure is different in the eastern coastal, northeastern, central and western plateaus or arid areas.
5. Baseline Regression Results
Table 3 reports the baseline estimates of model (1). All specifications include firm and year fixed effects. Column (1), which excludes control variables, shows that the coefficient on climate risk (CR) is negative and significant at the 5% level. After the controls are added in column (2), the coefficient remains negative and becomes significant at the 1% level. The results indicate that climate risk weakens the internal cash-generating capacity of listed fisheries companies and therefore support H1.
To clarify the industry-specific contribution, fisheries differ from manufacturing and energy firms in three respects. First, fisheries depend on biological assets whose growth, survival, and spatial distribution are jointly determined by water temperature, water quality, and ecological conditions; manufacturing firms can generally substitute inputs or relocate production more readily. Second, fisheries face biological production cycles and perishability, which magnify inventory, storage, and delivery losses after a climate shock. Third, fishing and aquaculture sites are tied to particular waters and coastlines, whereas energy and manufacturing firms typically have greater control over production sites and can hedge exposure through input contracts or geographic diversification. The same regional climate shock can therefore translate into a more immediate and persistent loss of operating cash flow for fisheries firms.
6. Robustness and Further Tests
6.1. Lagged Climate Risk
Considering that the impact of climate risks on corporate operating activities may have a certain time lag, and changes in corporate cash flow may in turn, affect regional risk response capabilities to a certain extent, in order to reduce potential reverse causality problems, this study further lags the core explanatory variable climate risk index by one period and re-regresses it. The results are shown in column (1) of Table 4.
The coefficient on one-period-lagged climate risk (L. CR) is −0.0014 and is significant at the 1% level. Thus, regional climate risk continues to reduce the operating cash flow of listed fisheries companies in the subsequent period. The consistency with the baseline results suggests that the estimated adverse effect is not driven solely by contemporaneous disturbances and has persistent economic consequences.
6.2. Quasi-natural Experiment
To alleviate potential endogeneity, this study uses climate-adaptive urban pilot policies to construct a quasi-natural experiment and employs exogenous policy shocks to conduct DID tests. Existing research has shown that constructing a difference-in-differences model based on exogenous policy implementation is an important method for identifying causal relationships and reducing omitted variable bias. Specifically, this study takes whether the enterprise is located in a climate-adaptive urban pilot area as a treatment variable, and constructs a DID variable for estimation.
Column (2) of Table 4 reports the DID test results. The results show that the DID coefficient is 0.0247 and is significantly positive at the 10% level, indicating that the operating cash flow of listed fisheries companies has significantly improved after the implementation of climate-adaptive urban pilot policies. This result is consistent with theoretical expectations. The reason is that climate-adaptive urban construction can improve the region’s ability to cope with climate risks and reduce the adverse impacts of climate shocks on corporate production and operations. For fishery companies that are highly dependent on the natural environment, improving regional climate adaptability can help alleviate the operating pressure caused by climate risks, thereby improving corporate cash flow performance. Therefore, this result further supports the study’s conclusion that climate risks harm corporate cash flows.
6.3. Excluding Other Confounding Factors
Given that China implemented strict prevention and control policies during the COVID-19 pandemic, this may affect the logistics supply chain for aquatic products, thereby interfering with causal inference about climate risks for listed fisheries companies. To rule out these effects, we excluded samples during the pandemic. The results are shown in column (1) of Table 5, showing that the climate risk index is still significantly negative at the 5% level. Similarly, given interference from special-treatment model companies, we further excluded ST companies. The results are shown in column (2) of Table 5. The results are shown in column (2) of Table 5. The main conclusions remain unchanged.
6.4. Other Robustness Tests
To mitigate self-selection bias, we used propensity score matching for testing. The results after matching were well balanced, so the matched samples were used to re-estimate the model. The results are shown in column (1) of Table 6. The climate risk index is significantly negative at the 5% level. In addition, we also performed entropy balance matching, and the results are shown in column (2) of Table 6. The main conclusions are still robust.
To mitigate the influence of extreme values, 1% winsorization is applied. The results are shown in column (3) of Table 6, and the main conclusion remains unchanged.
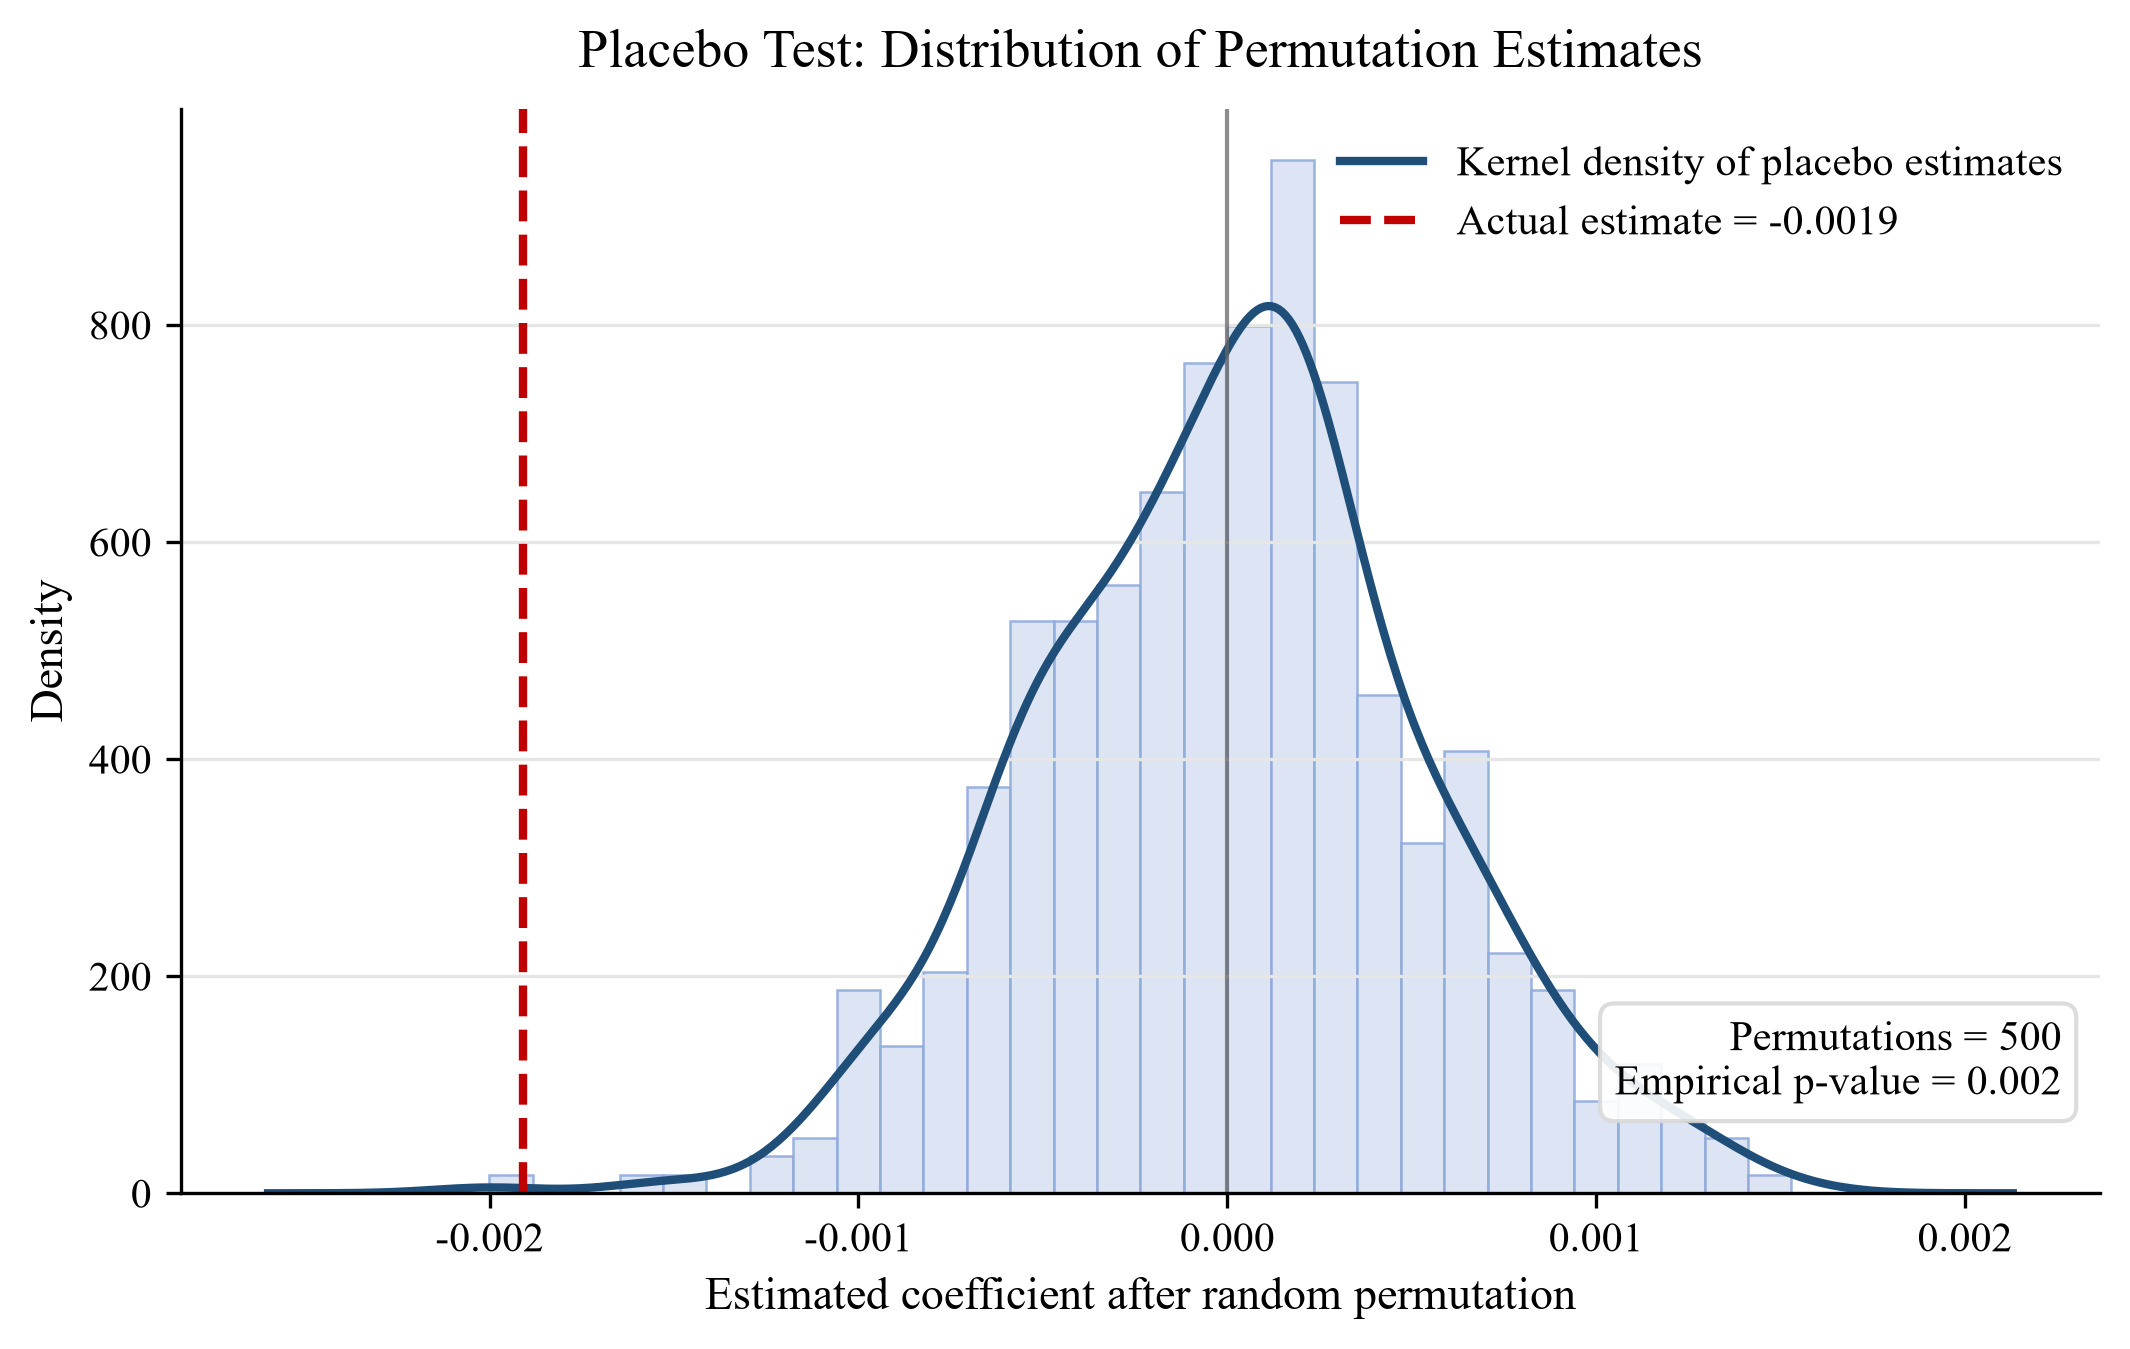
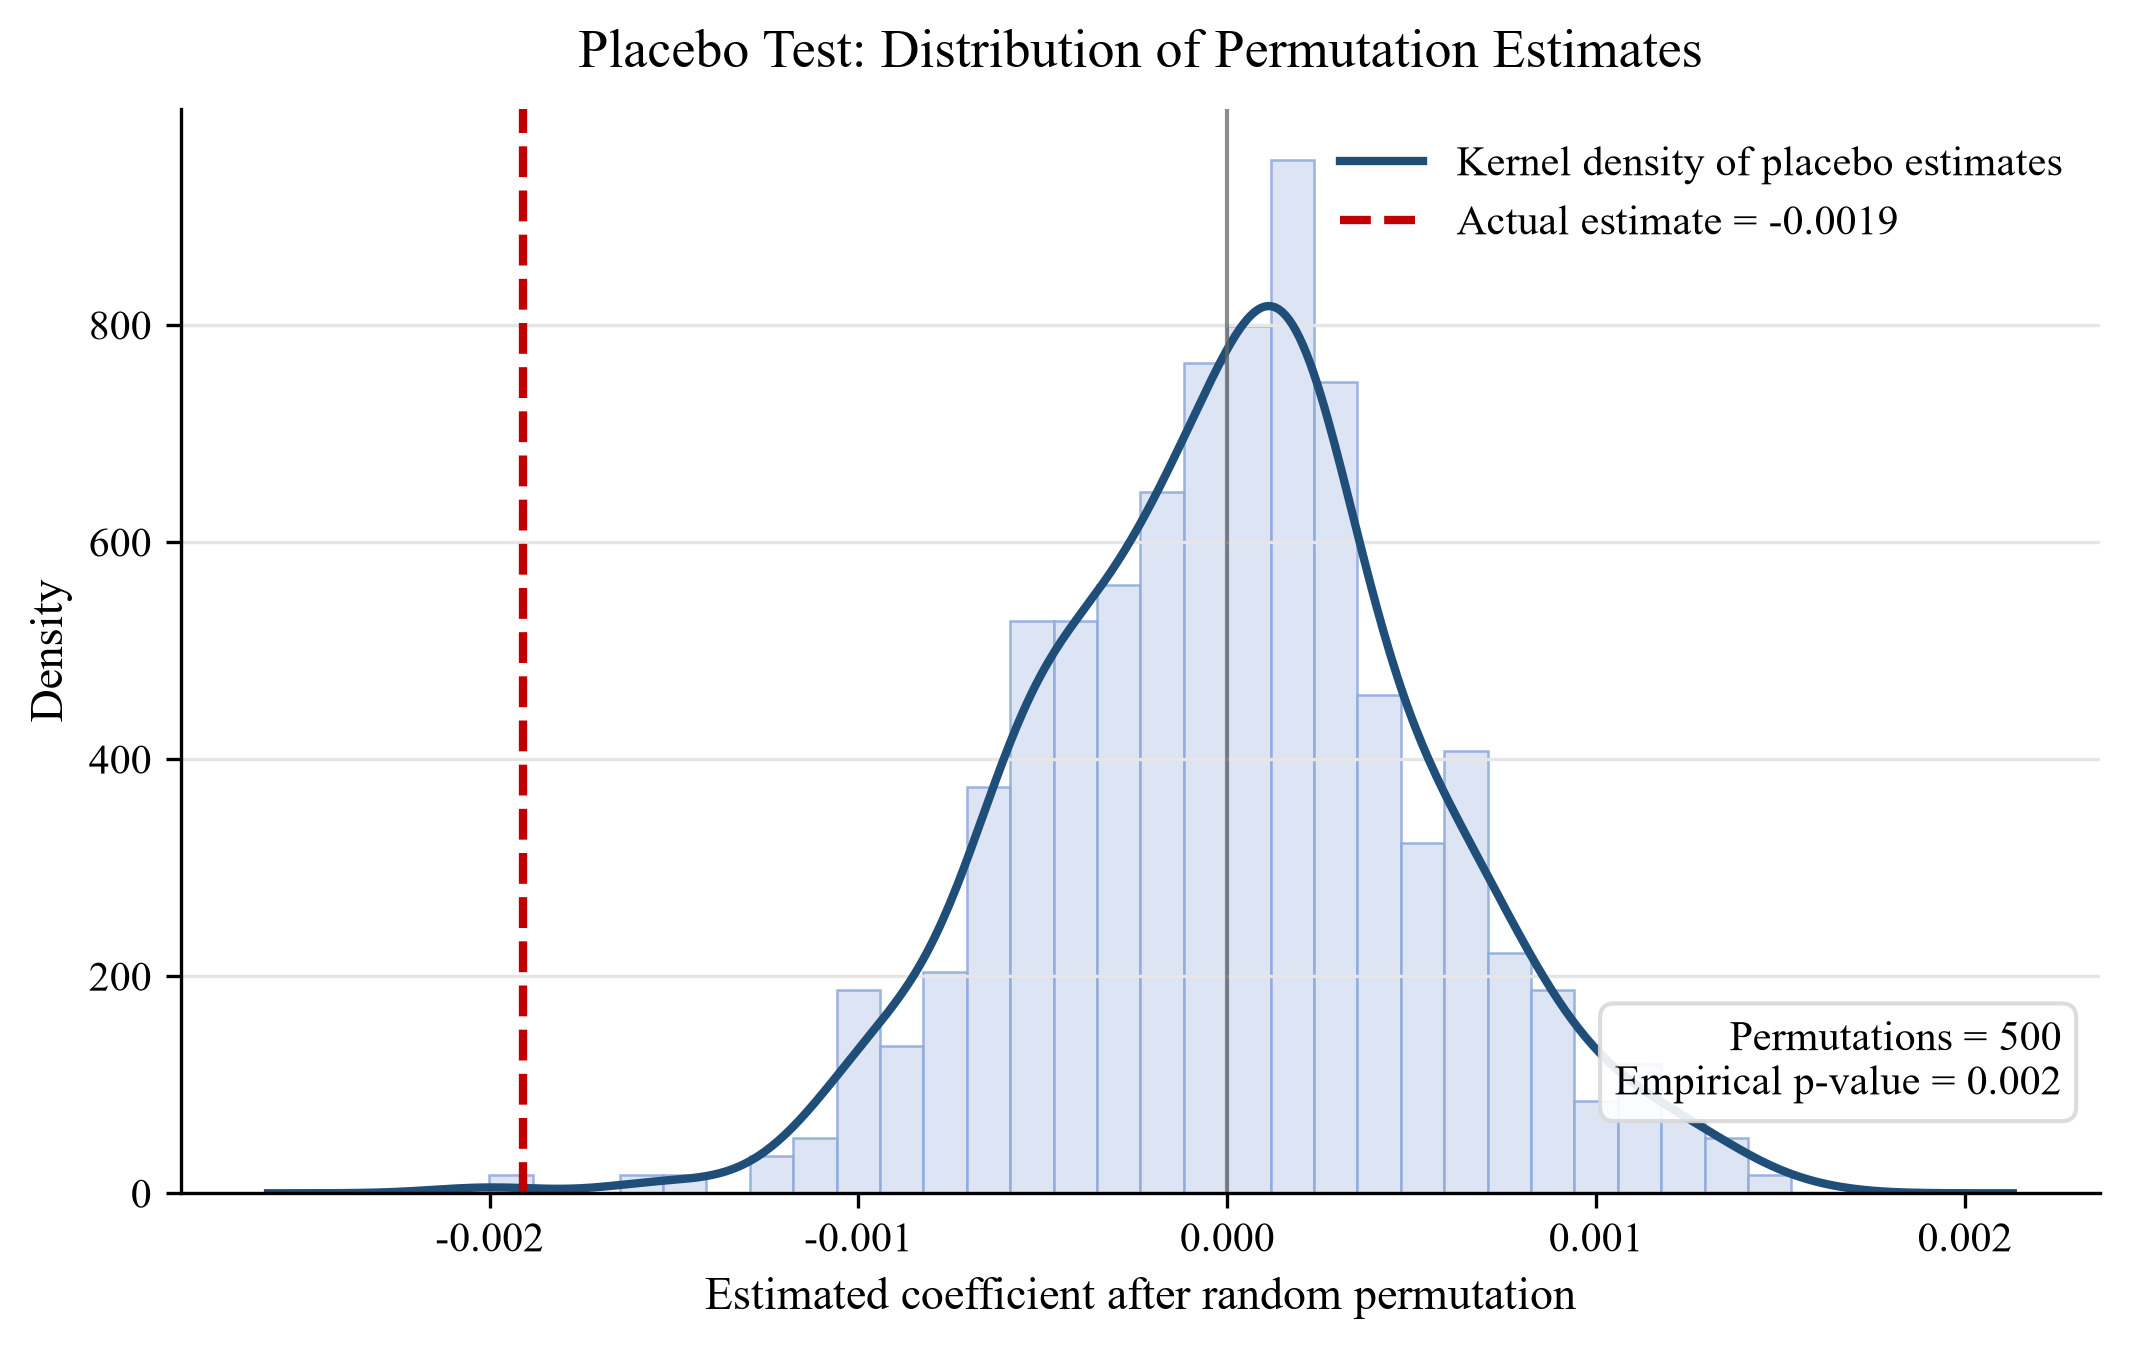
We also conducted a placebo test (Figure 7). The blue distribution in the figure is the estimated coefficient distribution obtained after randomly replacing the climate risk index 500 times within the year; the red dotted line is the true estimated coefficient of the baseline regression (-0.0019). The empirical two-sided p-value is 0.002.
7. Mitigation Mechanisms
7.1. Tests by Climate-risk Dimension
In order to further reveal the impact of different types of climate risks on corporate cash flow, this study further splits the comprehensive climate risk index into four categories of indicators: extreme low temperature, extreme high temperature, extreme rainfall, and extreme drought, and performs regression analysis for each category. The results are shown in Table 7.
The results show that the regression coefficients of the four types of climate risk indicators are all significantly negative. Among them, the coefficients of the proportion of extremely low temperature days, the proportion of extremely high temperature days, the proportion of extremely rainy days, and the proportion of extremely dry days are −0.0888, −0.0820, −0.0274, and −0.0752, respectively, and are all significant at the 1% level. This result shows that the negative impact of regional climate risks on the cash flows of listed fisheries companies does not originate from a single climate factor, but is caused by a variety of extreme climate shocks.
Further analysis found that different types of climate risks may affect fishery business operations through different mechanisms. First, extreme high temperatures can significantly weaken corporate cash flow performance. Fishery production is highly dependent on a suitable water temperature environment. Sustained high temperatures may change the temperature structure of the water body, reduce the growth efficiency of aquatic organisms, and increase the risk of death during the aquaculture process. At the same time, hot weather is often accompanied by problems such as a decrease in dissolved oxygen in water bodies and deterioration of water quality, forcing companies to increase investment in oxygenation, water changes, and disease prevention, leading to an increase in production costs. In addition, high temperatures may also affect the distribution of fishery resources and the stability of fishing activities, thereby reducing corporate operating income.
Secondly, extreme low temperatures will also have a significant impact on the cash flow of fishery companies. Low temperature events may cause the temperature of aquaculture water to drop rapidly, affecting the growth cycle and survival rate of fish and other aquatic products, and even causing yield losses in severe cases. At the same time, low-temperature weather may restrict fishing activities, reduce the company’s product supply capacity, and increase additional operating expenses such as insulation and disaster prevention, thereby exacerbating cash flow pressure.
Thirdly, extreme rainfall affects corporate cash flow by changing the production environment and supply chain stability. Heavy rainfall may cause changes in the water environment in the aquaculture area, including fluctuations in water salinity, temperature and pollutant concentration, increasing aquaculture risks. At the same time, flooding caused by extreme rainfall may damage aquaculture facilities, transportation channels, and production infrastructure, causing direct asset losses. In addition, abnormal rainfall may also affect the transportation and sales of aquatic products and reduce the stability of business operations.
Finally, extreme drought affects fishery production mainly through water resources constraints and ecological environment degradation. Drought may lead to a reduction in aquaculture water resources, a decrease in water exchange capacity, and aggravate water pollution problems, thereby increasing the difficulty of aquaculture management and production costs. For fishery companies that rely on natural water resources, continued drought may also reduce the abundance of fishery resources and weaken the profitability of the company.
Overall, the sub-dimensional test results show that different types of climate risks will significantly reduce the operating cash flow of listed fisheries companies, further verifying the reliability of the comprehensive climate risk indicator regression results. At the same time, this result also shows that the climate risks faced by fishery companies have multi-dimensional characteristics, and any single climate shock may have an adverse impact on corporate cash flow by affecting production conditions, operating costs and supply chain stability.
The previous empirical results show that climate risks significantly reduce the operating cash flow of listed fisheries companies, indicating that extreme weather, hydrological environment changes, and uncertainty in production conditions caused by climate change will have a negative impact on corporate cash flow by affecting corporate production and operation activities, increasing operating costs, and reducing operational stability. However, companies are not completely passive when faced with climate risk shocks. Differences in external resource acquisition capabilities and internal governance levels among companies may lead to differences in their ability to withstand climate risks. Therefore, this study further examines the mitigation mechanisms for climate risks affecting corporate cash flows from the perspectives of external support and internal governance.
7.2. Government Subsidies
As a typical resource-dependent industry, fishery production and operation activities are greatly affected by changes in the natural environment. When extreme weather events occur, listed fisheries companies may face problems such as increased aquaculture losses, rising production costs, and unstable supply chains, which will in turn lead to a decline in operating cash flow. Since climate risks have strong public attributes, their impact not only involves the company’s own operations, but also affects the stability of agricultural production and the protection of ecological resources. Therefore, the government usually helps fishery companies mitigate risks through financial subsidies, industrial support funds, and disaster relief.
From the perspective of resource dependence theory, government subsidies can provide enterprises with additional external resources and alleviate financial pressure stemming from climate risks. On the one hand, subsidy funds can directly improve the short-term liquidity of enterprises and improve their ability to maintain normal production and operation activities; on the other hand, relevant policy support can help fishery enterprises carry out the transformation of aquaculture facilities, upgrade production technology and the construction of risk prevention and control systems, and improve the ability of enterprises to adapt to climate change. Therefore, government subsidies may weaken the adverse impact of climate risks on the operating cash flow of listed fisheries companies.
In order to verify the above effects, this study constructs an interaction term between climate risks and government subsidies for testing. Column (1) of Table 8 reports the results of the moderating effect of government subsidies. The results show that the coefficient of the interaction term between the climate risk index and the amount of government subsidies is 0.0004, and is significantly positive at the 5% level, indicating that government subsidies can significantly mitigate the negative impact of climate risks on the cash flows of listed fisheries companies. This result shows that government policy and resource support can enhance fishery companies’ ability to withstand climate shocks and improve the resilience of corporate operating cash flows.
7.3. Corporate Governance
In addition to external policy support, internal corporate governance capabilities affect the ability of listed fisheries companies to manage climate risks. Since fishery production is highly uncertain, companies need to continue to invest funds in aquaculture management, equipment maintenance and production adjustments. In the context of increasing climate risks, whether an enterprise can effectively allocate limited resources and take timely risk response measures largely depends on the efficiency of internal governance.
Higher agency costs may lead to management’s short-sighted behavior and reduced resource allocation efficiency, making it difficult for companies to respond in a timely manner to the operating pressures brought about by climate change. For example, when faced with extreme weather or changes in the ecological environment, companies with low governance efficiency may be unable to adjust production plans, optimize resource allocation, or strengthen risk prevention in a timely manner, thereby further amplifying the negative impact of climate risks on cash flow. On the contrary, companies with lower agency costs have more effective supervision mechanisms and resource allocation capabilities, which can improve the efficiency of business decision-making and reduce losses caused by climate shocks through technological investment, production adjustment, and supply chain optimization.
Therefore, this study further examines the moderating role of agency costs in the process of climate risks affecting the cash flow of listed fisheries companies. The results in column (2) of Table 8 show that the coefficient of the interaction term between the climate risk index and the agency cost indicator is −0.0002 and is significant at the 5% level, indicating that lower agency costs can weaken the adverse impact of climate risks on corporate operating cash flows. This result shows that good internal governance mechanisms can improve the climate risk adaptability of listed fisheries companies and enable them to maintain stronger operational stability in the face of external environmental shocks.
8. Conclusions and Policy Implications
8.1. Conclusion
This study uses listed fisheries companies as research subjects to examine the impact of regional climate risks on corporate operating cash flows and the mechanisms for mitigating these risks. The study mainly draws the following conclusions: First, regional climate risks significantly reduce the operating cash flow of listed fisheries companies. Fishery production and operations are highly dependent on natural environmental conditions such as temperature and precipitation. Rising climate risks will increase uncertainty and cost pressures in corporate production and operations, which will, in turn, negatively impact operating cash flow. Second, government subsidies can mitigate the negative impact of climate risks on the operating cash flow of listed fisheries companies, indicating that government financial and policy support can enhance their ability to withstand climate risks. Third, lower agency costs can also play a mitigating role. Good corporate governance can improve corporate resource allocation efficiency and risk-response capabilities, thereby reducing the adverse impact of climate risks on operating cash flow.
8.2. Discussion
The conclusion of this study on the significant negative impact of climate risks on fisheries is logically consistent with existing research on the impact of climate risks on fisheries production: Free et al.1 confirmed that ocean warming between 1930 and 2010 had led to a significant increase in the decline in sustainable catch of fish in several key global sea areas. Holst and Yu21 also conducted an empirical analysis of inland aquaculture in China, noting that temperature fluctuations significantly increase production risks. Islam et al.22 found that climate-related disasters have caused huge economic losses to the aquaculture industry in Bangladesh. However, this study differs from existing research that mainly focuses on biomass loss at the production end, regional capacity adjustment, or macroeconomic losses in industries. Instead, this study extends the transmission chain of climate physical risks to the corporate finance level by quantifying the negative effects of production shocks on the cash flows of listed fishery enterprises. To a certain extent, it fills the research gap in the mechanism from “physical damage” to “financial performance”.
In addition, it should be pointed out that this study is limited by the availability of data. This article uses only listed fishery companies as its research sample and fails to cover the vast number of small and medium-sized private aquaculture operators, who often face more severe financing constraints. Because financial data from small and medium-sized fishery enterprises are usually not publicly disclosed, this sample bias is difficult to eliminate within the existing framework. Future research can obtain first-hand data through field surveys and other methods to further expand the conclusions of this study.
8.3. Practical Implications
Based on the above findings, this study puts forward the following targeted policy recommendations:
First, establish a tiered, whole-chain climate risk monitoring and early-warning system aligned with cash-flow management. Instead of a one-size-fits-all warning mechanism, design differentiated early warning indicators for different links of the aquatic industrial chain: for aquaculture and fishing producers, integrate monitoring of sea surface temperature, red tides, extreme rainfall and drought to issue production risk alerts; for upstream feed producers and downstream processing & trading firms, release synchronized warnings on raw material supply contraction and logistics disruption, and push alerts directly to corporate finance and operation departments. Set up a three-level (blue/yellow/red) response framework, where each tier corresponds to predefined operating cash-flow contingency plans, such as emergency working-capital deployment under red alerts. Promote data sharing among meteorological, maritime, and agricultural authorities to reduce duplicate monitoring costs for enterprises.
Second, implement targeted financial support tools tailored to cash flow vulnerabilities across the chain. Move from blanket subsidies to precise, risk-exposure-based fiscal support: prioritize subsidies for production recovery, disaster-resilient facility renovation and climate adaptability investment in firms with high climate exposure, and earmark funds to replenish operating cash flows. Expand climate-aligned financial instruments: launch special working capital loans for aquatic firms with interest subsidies, and promote supply chain bills and accounts receivable financing to ease payment delays caused by climate shocks for processing and trading enterprises. Extend weather-indexed aquaculture insurance from the production segment to feed, processing, and trade links, and align insurance payouts with operating cash flow gaps to speed up relief disbursement.
Third, guide enterprises to embed climate risk into internal cash flow governance. Require key listed aquatic firms to conduct quarterly climate-risk cash-flow stress tests, assess operating cash-flow gaps under extreme scenarios, and set aside dedicated risk reserves. Encourage firms to diversify supply chain layouts—for example, cross-regional raw-material sourcing for feed and processing enterprises—to reduce the transmission shock from climate disasters in a single production area. Incorporate climate risk response performance and operating cash flow stability into management performance appraisal to strengthen incentives and constraints, reduce agency costs, and improve resource allocation efficiency.
In general, a three-pronged climate risk response system integrating government monitoring and early warning, targeted financial support, and corporate internal governance should be established across the entire aquatic industrial chain to fundamentally stabilize operating cash flows and improve the overall climate resilience of listed fisheries enterprises.
Acknowledgments
This research received no specific grant from any funding agency in the public, commercial, or not-for-profit sectors.
CRediT - Authors’ Contribution
Formal Analysis: Qinqin Zou (Equal), Shixuan Lin (Equal), Lei Yang (Equal). Investigation: Qinqin Zou (Equal), Shixuan Lin (Equal). Writing – original draft: Qinqin Zou (Lead). Supervision: Shixuan Lin (Lead). Conceptualization: Yujing Wu (Lead). Writing – review & editing: Yujing Wu (Equal), Lei Yang (Equal). Funding acquisition: Yujing Wu (Equal), Lei Yang (Equal). Methodology: Lei Yang (Lead). Resources: Lei Yang (Equal).
Competing of Interest – COPE
No competing interests were disclosed.
Ethical Conduct Approval – IACUC
This study uses Chinese listed fishery companies as the research sample. The research does not involve any animal experiments, plant experiments, or human trials. All data employed in this study were obtained from financial reports voluntarily disclosed by the listed companies in accordance with information disclosure regulations. As these data are publicly accessible information resources and do not involve any personal privacy or trade secrets, this study raises no ethical concerns.
Informed Consent Statement
All authors and institutions have confirmed this manuscript for publication.
Data Availability Statement
All are available upon reasonable request.