
Introduction
Aquaculture nutrition research increasingly evaluates plant-derived additives as possible alternatives to routine antimicrobial growth promoters. Essential oils are of interest because their volatile constituents can interact with feed characteristics, host tissues, and microbial communities; however, responses depend on compound identity, inclusion level, fish species, and culture conditions.1–3
The intestinal microbiota of teleosts is associated with digestion, mucosal function, and host–environment interactions. Its composition can also be influenced by water, feed, life stage, and tank conditions, making causal interpretation difficult in small feeding trials.4–6 Amplicon sequencing can describe bacterial community patterns, but it does not directly demonstrate pathogen status, metabolite production, or effects on host physiology.
Lemongrass (Cymbopogon citratus) essential oil (LEO) contains citral, a mixture dominated by the geometric isomers geranial and neral. These monoterpene aldehydes have antimicrobial activity in laboratory systems, but they are volatile and susceptible to oxidation during feed manufacture and storage.7,8 In Nile tilapia, Al-Sagheer et al. tested lemongrass essential oil at 0, 200, 400, and 600 mg/kg for 63 days and reported changes in performance and in the intestinal microbiota.9 A previous red-tilapia challenge study used the same nominal range of 0, 200, 300, and 400 mg/kg,10,11 whereas recent work with aqueous lemongrass material tested much higher gram-per-kilogram additions and included feed-utilization endpoints.12 These studies show that responses depend on preparation, exposure, and experimental context; they also preclude treating an intermediate dose as intrinsically novel or optimal.
The present work addressed a narrower gap: tank-level growth and exploratory responses of gut bacterial communities to 200–400 mg/kg nominal C. citratus essential oil in approximately 90-g red tilapia over eight weeks. Red tilapia are commercially important hybrids, but the precise parental composition of the stock used here was not genetically verified. We hypothesized that LEO inclusion would be associated with diet-related changes in growth and bacterial-community composition. The objectives were to assess growth at the tank level and to characterize bacterial communities from a single pooled midgut sample per tank. Growth–microbiota correlations and causal mechanisms were neither prespecified nor tested.
Materials and Methods
Experimental fish and culture conditions
Red tilapia (Oreochromis sp.) were obtained from the National Center for Freshwater Aquaculture Breeding in the Southern Region, Vietnam, and acclimated for 14 days on the basal diet. The fish were not genetically characterized beyond the hatchery designation “red tilapia.” Sex was not recorded; therefore, the male:female ratio remained unknown. One hundred twenty apparently healthy fish were assigned by initial-weight strata to 12 glass tanks (working vilume 70 L; 10 fish/tank) to balance initial size distributions.
Each tank had an independent, continuously operated water-circulation loop; culture water was not shared among tanks or treatments. Aeration was continuous, and approximately 20% of the water in each tank was replaced daily to remove wastes and replenish water quality. Thus, the three tanks assigned to each diet were independent experimental units. Initial biomass density averaged 12.9–13.5 kg/m3 among treatments (tank range 11.5–14.4 kg/m3), and final density averaged 23.6–25.3 kg/m3 (tank range 21.2–28.0 kg/m3). Fish were maintained under a 12 h light:12 h dark photoperiod and hand-fed to apparent satiation twice daily at 08:00 and 16:00 for 56 days.
Water temperature, pH, and salinity were measured daily, whereas dissolved oxygen (DO) and nitrate (NO₃-) were measured once weekly. On scheduled measurement days, observations were made at 09:00 and 17:00. The available summarized values were used descriptively because tank-by-time raw measurements were not retained in the analysis file. Treatment summaries are presented in Table 1.
Lemongrass essential oil and experimental diets
Commercial LEO was obtained from Heber Vietnam Co., Ltd. Gas chromatography–mass spectrometry of the undiluted oil reported 55.2% geranial and 44.8% neral. The basal feed was Uni-President UP Tilapia Feed manufactured by Uni-President Vietnam Co., Ltd. According to the product label, the feed contained 30% crude protein, 2% lipid, 15% crude fiber, and 10% moisture.
The same feed batch was used for all treatments. Absolute ethanol was added at 100 mL/kg of feed to every diet, including the control, thereby keeping the carrier volume constant. Target LEO additions were 0 (control), 200, 300, and 400 mg/kg feed, designated Control, S200, S300, and S400 (Table 2). The solution was sprayed uniformly onto pellets and mixed, following the carrier volume used for phytogenic compounds in tilapia diets.13 Diets were air-dried in the dark at room temperature for 24 h, packed in airtight bags, and stored at 4°C.1 Geranial, neral, or total citral was not quantified in the finished diets. The treatment concentrations are therefore nominal inclusion levels and do not establish the amount consumed or retained during storage.
Growth measurements
Fish were fasted for 24 h before weighing at weeks 0, 2, 4, 6, and 8. Each fish was weighed individually and recorded within its tank. Individual measurements were used to calculate each tank mean; the 30 fish within a treatment were not treated as independent replicates. Weight gain (WG) and specific growth rate (SGR) were calculated from tank mean body weights:
WG (g)=Wf−Wi
SGR (%/day) = [ln(Wf)−ln(Wi)]/t×100
where Wi and Wf are initial and final tank mean body weights and t is 56 days. Feed offered, uneaten feed was not quantified. Cconsequently, feed conversion ratio (FCR), feed efficiency, and protein efficiency ratio (PER) could not be calculated.
Tank-level pooling and sample collection
After the final 24 h fast, three fish were randomly selected from each tank and deeply anesthetized with an overdose of MS-222.14 External surfaces were disinfected with 70% ethanol. The intestinal tract was aseptically removed, and midgut digesta and mucosal scrapings from the three fish in the same tank were pooled into a single composite sample. This produced one independent microbiota sample per tank: three samples per diet, for a total of 12 samples from 36 fish. Samples were flash-frozen in liquid nitrogen and stored at −80°C. Pooling aligned the microbiota sample with the tank experimental unit but prevented estimation of within-tank, fish-to-fish variation.
DNA extraction and 16S rRNA amplicon sequencing
DNA was extracted from 200 mg of each composite sample with the DNeasy PowerSoil Pro Kit (Qiagen, Hilden, Germany). Concentration and purity were measured using Qubit and NanoDrop instruments (Thermo Fisher Scientific). The xGen 16S Amplicon Panel v2 (Integrated DNA Technologies) was used to prepare multiplexed libraries. Libraries were quantified by qPCR using the KAPA Library Quantification Kit and sequenced as paired-end 2 × 150-bp reads on the MGI DNBSeq-G99 platform. DNA and library quality-control records are reported in Supplementary Tables S1 and S2.
Bioinformatics
Adapters and primers were removed with Cutadapt v2.10, and low-quality bases were filtered with Trimmomatic v0.39.15,16 Reads were processed in QIIME 2 v2019.10.17 DADA2 was used for denoising, dereplication, chimera removal, paired-read merging, and amplicon sequence variant (ASV) inference.18 Taxonomy was assigned using classify-consensus-blast against SILVA v138 SSURef Nr99.19
Alpha-diversity metrics were standardized to 21,356 reads/sample, the lowest retained depth. Observed ASVs, Shannon diversity, Chao1 richness, and Pielou evenness were calculated. Jaccard and Bray–Curtis distances were visualized by principal coordinates analysis (PCoA). Because of the limited tank replication and compositional nature of relative-abundance data,20 unadjusted LEfSe outputs were removed from the primary evidence, and PICRUSt2 predictions were not used to infer measured functions.
Statistical analysis
The tank was the experimental unit for all growth and microbiota analyses (n=3 tanks/diet). For each growth endpoint, residual patterns and group variances were inspected; because normality and equal-variance assumptions are difficult to establish with three tanks/group, treatment effects were evaluated using a one-way permutation ANOVA with 99,999 label permutations. Initial body weight was assessed separately. Final tank mean weight was additionally analyzed by analysis of covariance (ANCOVA) with initial tank mean weight as a covariate and diet as a fixed effect; a Freedman–Lane permutation test with 99,999 permutations evaluated the diet term. The treatment-by-initial-weight interaction was examined as a sensitivity analysis but was not significant. No post hoc growth comparisons were performed because the omnibus treatment tests were not significant.
Alpha-diversity indices were summarized as mean±SD and tested using the Kruskal–Wallis test, followed, where appropriate for transparency, by pairwise rank tests with Benjamini–Hochberg false-discovery-rate (FDR) adjustment. Community composition was evaluated by PERMANOVA with 9,999 permutations,21 and multivariate dispersion was tested by PERMDISP.22 Pairwise PERMANOVA contrasts were FDR-adjusted. With only three tanks/diet, all microbiota analyses were treated as exploratory. No growth–microbiota correlations were performed because the total sample size was 12 tank-level observations and no integrative hypothesis was prespecified. Analyses were performed in R v4.0.3 using independent verification scripts; a two-sided p<0.05 was the nominal threshold.
Results
Growth and water quality
No mortality was recorded. Descriptive water-quality means were similar in magnitude among treatments, with no obvious treatment-related pattern recorded (Table 1). The corrected tank-level growth analysis found no effect of diet on initial weight (permutation p=0.878), final weight (p=0.793), WG (p=0.743), or SGR (p=0.773; Table 3). S300 had the highest numerical final weight and WG, whereas S400 had the highest numerical SGR; variation among the three tanks within each treatment was substantial. After adjustment for initial tank mean weight, estimated final weights were 170.08, 167.16, 171.92, and 172.38 g for Control, S200, S300, and S400, respectively, and the diet term remained non-significant (partial F₃,₇=0.355, permutation p=0.784). The initial-weight×diet interaction was not significant (F₃,₄=3.676, p=0.120).
Sequencing and alpha diversity
Across the 12 tank-level composite samples, 2,051,126 reads passed quality control (mean 170,927/sample). Retained depth ranged from 21,356 reads in S300_3 to 244,565 reads in S400_2, and Q30 exceeded 86%. Rarefaction curves approached plateaus (Supplementary Figure S1); all alpha-diversity comparisons were made after standardization to 21,356 reads/sample.
No alpha-diversity index differed significantly among diets (Table 4). S300 showed a numerical combination of lower observed richness and Chao1 with higher Shannon diversity and Pielou evenness. This pattern is mathematically possible because richness counts the number of detected ASVs, whereas Shannon diversity also reflects the distribution of reads among ASVs and Pielou evenness standardizes that distribution by richness. Thus, fewer detected ASVs can coexist with a more even relative-abundance distribution. However, no pairwise comparison was significant after FDR adjustment (Supplementary Table S3), so the pattern should not be interpreted as a stable treatment effect.
Community composition and taxonomic profile
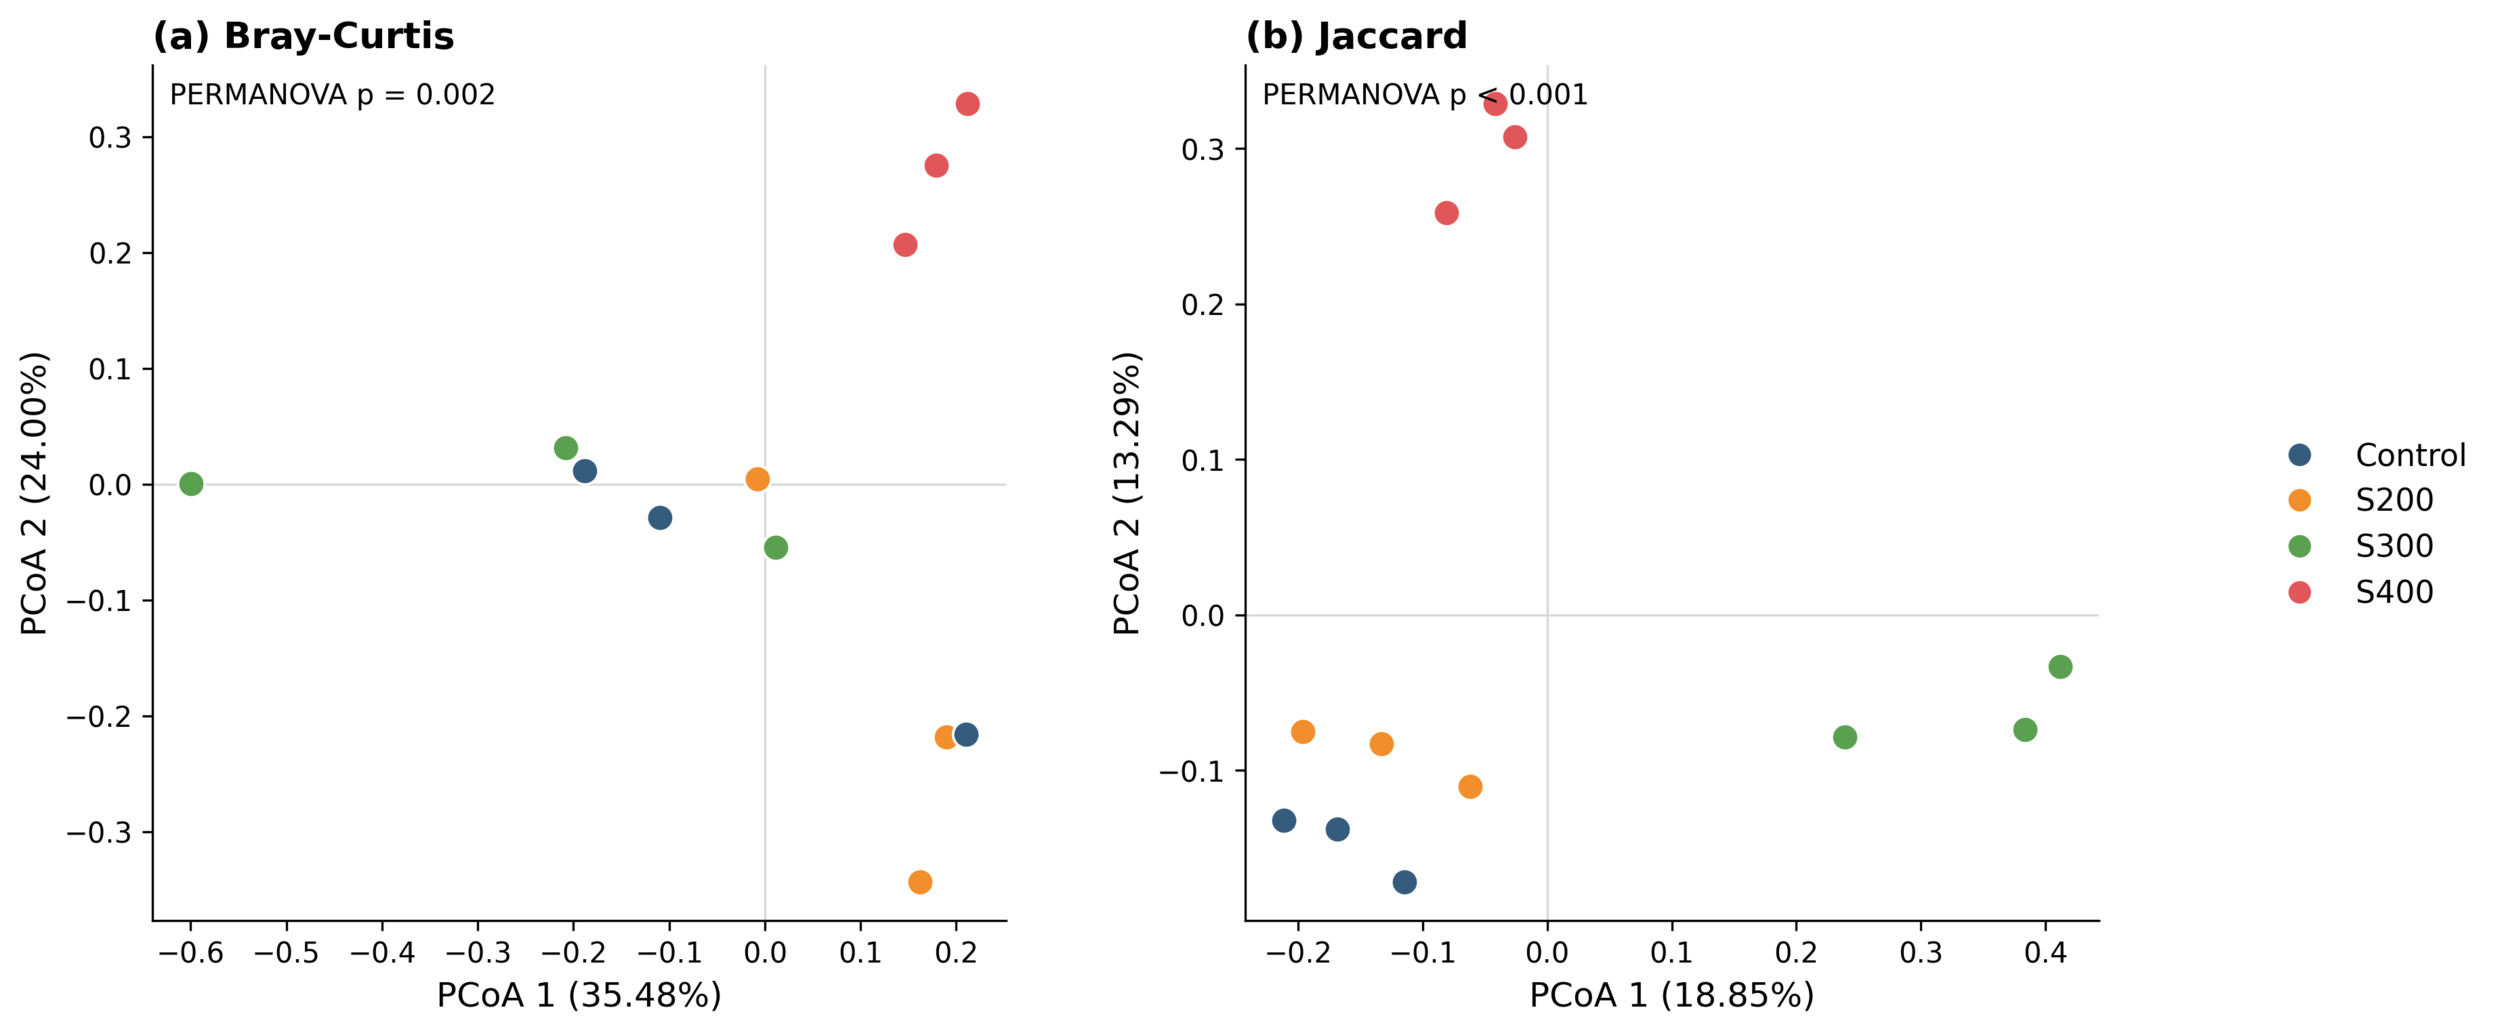
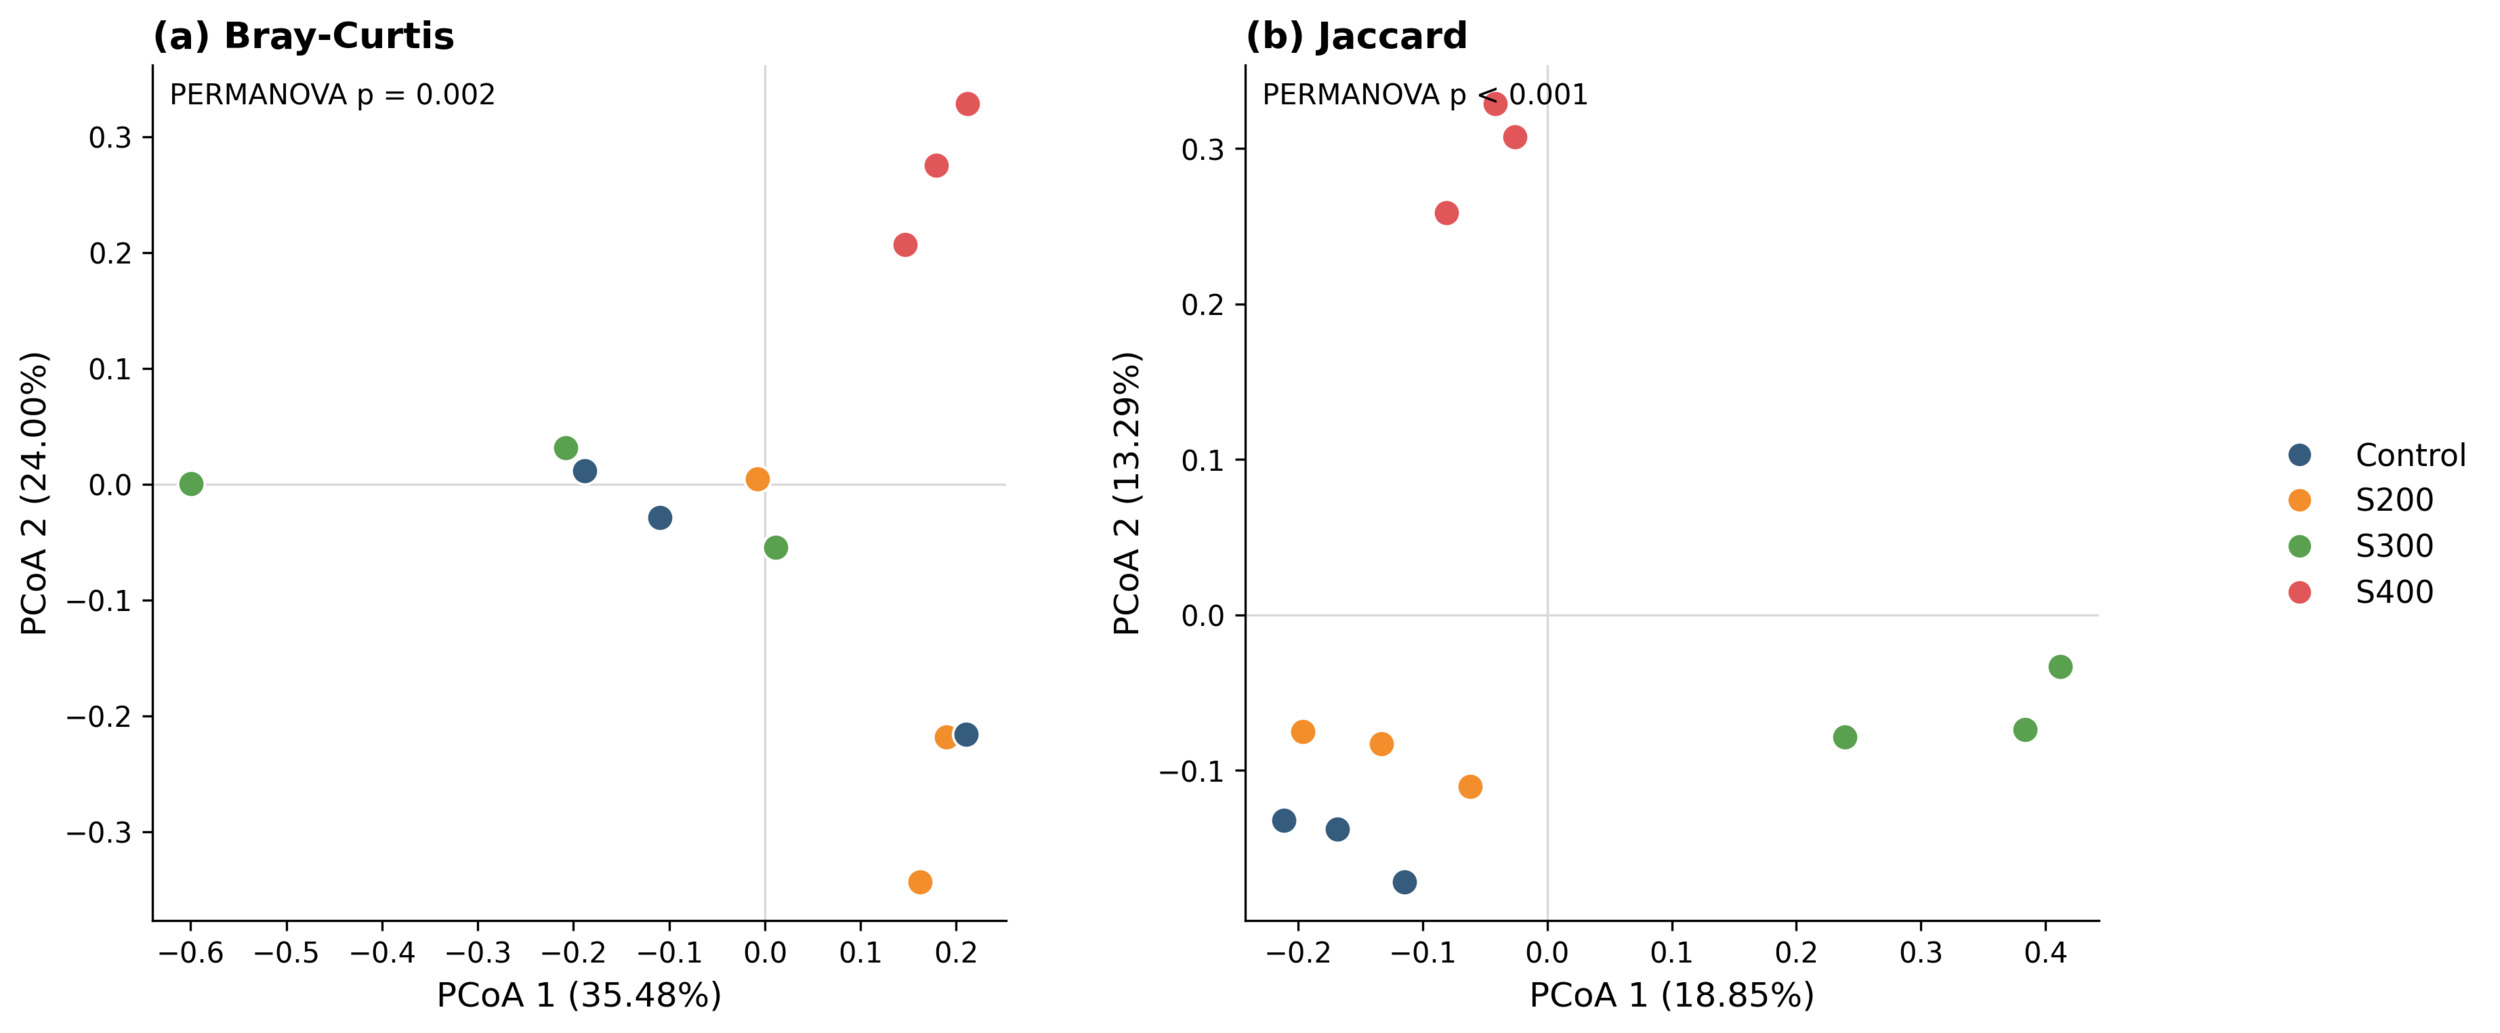
PCoA showed separation patterns among some samples (Figure 1). Omnibus PERMANOVA detected a diet-associated difference for Bray–Curtis dissimilarity (pseudo-F=2.615, p=0.0024), while PERMDISP was not significant (F=7.764, p=0.0747). Jaccard PERMANOVA was also significant (pseudo-F=1.939, p=0.0001), but Jaccard dispersion differed among diets (F=12.118, p=0.0440), so the location effect cannot be separated cleanly from dispersion. No pairwise PERMANOVA contrast was significant after FDR adjustment (Supplementary Table S4). These findings support an omnibus community-level signal, not a resolved dose-specific effect.
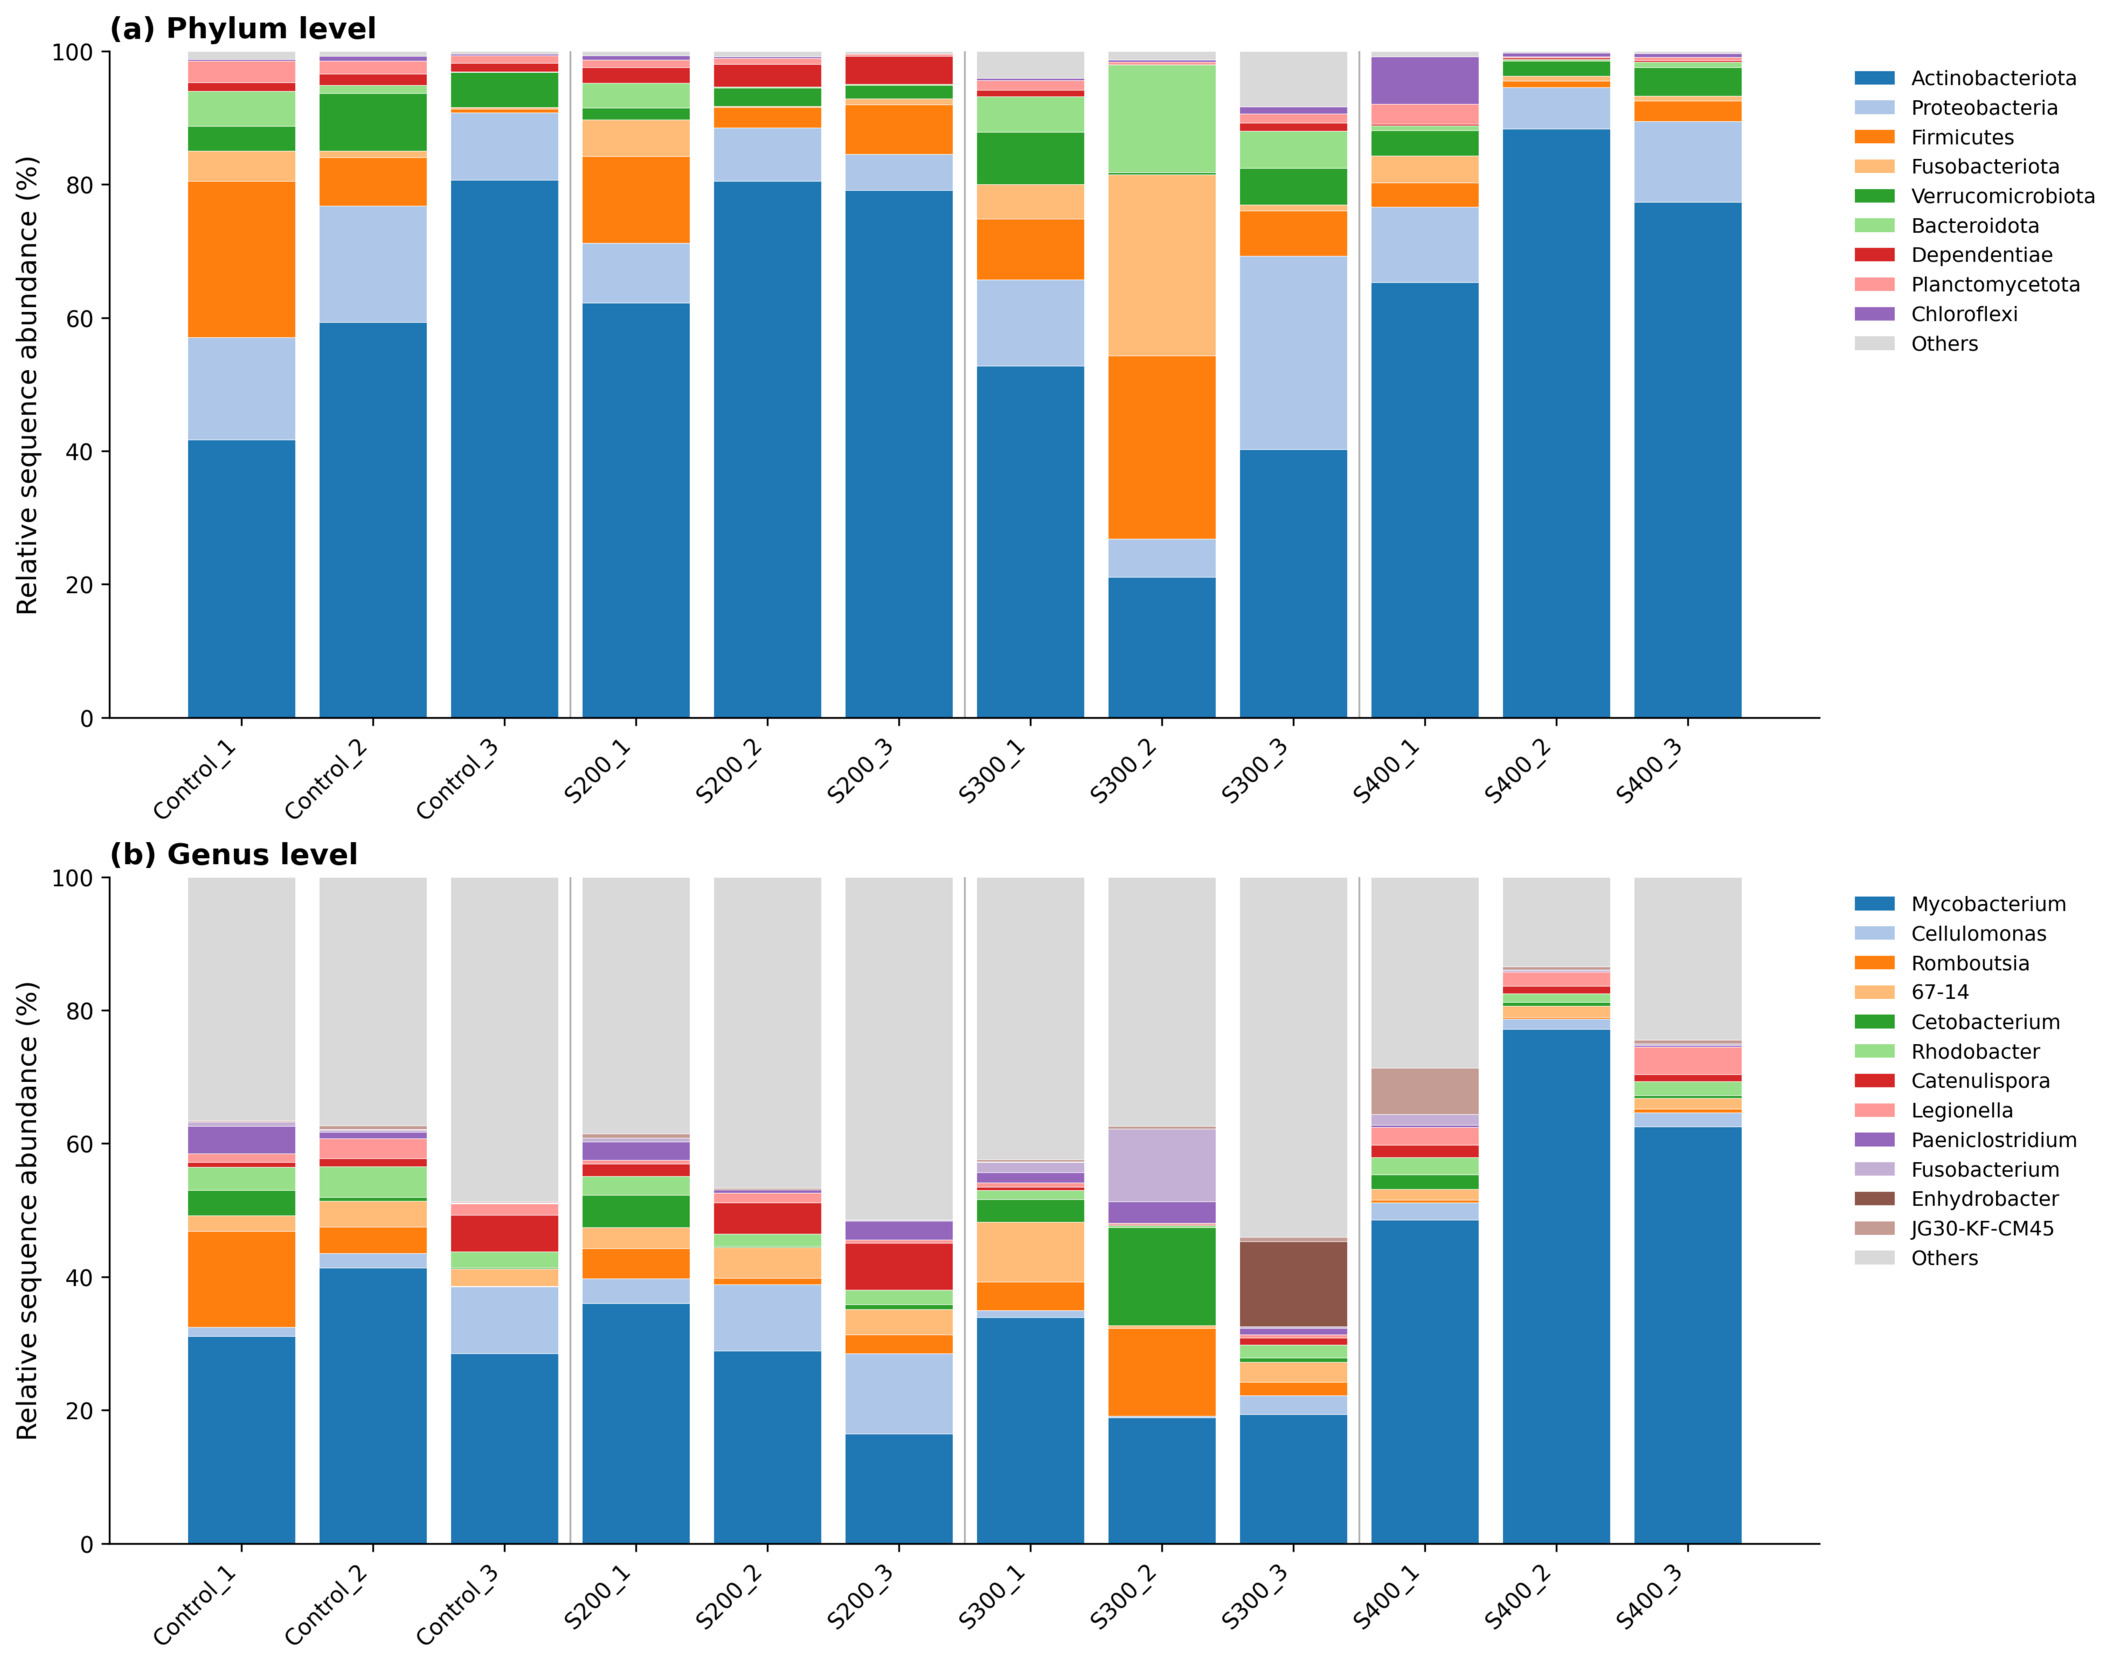
Proteobacteria, Firmicutes, Actinobacteriota, Fusobacteriota, and Bacteroidota were prominent phyla, with substantial variation among individual tank pools (Figure 2). At genus level, reads assigned to Cetobacterium, Romboutsia, Mycobacterium, Cellulomonas, and other genera varied among samples. These are compositional relative-abundance data. In particular, reads assigned to the genus Mycobacterium do not identify a pathogenic species, viable organisms, tissue infection, or disease risk. Given n=3 tanks/diet and the large number of taxa screened, unadjusted LEfSe features were removed from the main results and are not presented as biomarkers.
_phylum_and_(b)_genus_levels.png)
Discussion
Growth response and dietary exposure
All four diets supported survival and substantial weight gain, but nominal LEO supplementation did not confer a detectable growth advantage during the eight-week trial. No mortality was recorded, and the permutation analyses found no dietary effect on final body weight, weight gain, or specific growth rate. S300 had the highest final body weight and weight gain, whereas S400 had the highest specific growth rate; therefore, the ranking of treatments was inconsistent across growth endpoints and did not form a monotonic dose-response pattern. Adjustment for initial tank mean weight produced closely grouped estimated final weights (167.16-172.38 g) and likewise showed no diet effect. Under these conditions, the observed numerical differences are better interpreted as variation among replicate tanks than as evidence of an optimal LEO inclusion level.
The neutral growth response adds useful context to the variable literature on phytogenic additives in cultured fish. Previous studies have reported growth, physiological, or intestinal responses to essential oils, but outcomes differ with the botanical preparation, chemical profile, dose, fish species, size class, basal diet, and duration of exposure.1,2,9,12,23 Al-Sagheer et al. tested 0, 200, 400, and 600 mg/kg lemongrass essential oil in Nile tilapia, whereas the earlier red tilapia challenge study using 0-400 mg/kg focused mainly on post-challenge hematological responses.9,10 More recent work using aqueous lemongrass material applied gram-per-kilogram additions and included feed-utilization endpoints, making direct dose comparison with an essential-oil coating inappropriate.12 The present fish began the trial at approximately 90 g, so their response may also differ from that of smaller juveniles. In addition, the exact hybrid ancestry and sex ratio of the red tilapia were not characterized, which limits the generalizability of the present result to other red tilapia stocks or production stages.
The dietary preparation controlled the ethanol carrier effectively: every diet, including the control, received 100 mL absolute ethanol/kg feed. Consequently, variation in carrier volume cannot account for the lack of a consistent growth pattern among LEO treatments. The nominal exposure itself is less certain. The undiluted oil contained 55.2% geranial and 44.8% neral, but these compounds were not measured in the finished pellets after drying or storage. Citral-rich oils are volatile and oxidation-sensitive, and their concentration may change during feed preparation and storage.8 Thus, the experiment directly evaluates diets prepared with nominal additions of 0-400 mg LEO/kg, rather than chemically verified concentrations consumed by the fish. This distinction may partly account for differences between the present result and studies using other formulations or freshly prepared diets.
The body-weight data demonstrate that LEO at the tested nominal concentrations neither enhanced nor visibly impaired somatic growth under the conditions examined. However, body-weight endpoints alone do not reveal whether LEO affected voluntary intake, palatability, digestibility, or nutrient-use efficiency. Feed offered and uneaten feed were not quantified, so feed conversion ratio, protein efficiency ratio, and economic return could not be evaluated. The absence of mortality and a negative growth response is reassuring at the production level, but it should not be interpreted as a comprehensive safety assessment, as physiological, histological, and metabolic endpoints were outside the scope of the trial.
Bacterial-community findings
Dietary LEO did not produce a statistically detectable change in within-sample bacterial diversity after sequencing depth was standardized to 21,356 reads per sample. Observed ASVs, Chao1 richness, Shannon diversity, and Pielou evenness all remained non-significant across diets. The S300 indicates lower observed richness combined with higher Shannon diversity and evenness, but these indices describe different properties of a community: richness counts detected ASVs, whereas Shannon diversity and Pielou evenness also reflect how reads are distributed among those ASVs. The numerical S300 profile therefore describes a community with fewer detected ASVs and a more even relative abundance distribution; it does not, by itself, indicate improved diversity or intestinal condition. Because no omnibus or FDR-adjusted pairwise alpha-diversity test was significant, this pattern should be considered descriptive.
The clearest microbial signal was an overall association between diet and abundance-weighted community structure. Bray-Curtis PERMANOVA detected an omnibus difference among the four diets (pseudo-F=2.615, p=0.0024), while the corresponding dispersion test was not significant (p=0.0747). This result suggests that the four-diet design captured community-level heterogeneity that was not explained solely by a statistically detected difference in Bray-Curtis dispersion. Nevertheless, no pairwise comparison remained significant after FDR adjustment, so the analysis does not identify which LEO concentration differed reproducibly from the control or from another dose. Jaccard PERMANOVA was also significant, but Jaccard dispersion differed among diets (p=0.0440); the presence-absence result may therefore reflect both centroid location and within-group variability. Taken together, the beta-diversity results support an exploratory overall community signal rather than a resolved dose-specific response.
The taxonomic profiles were broadly consistent with the heterogeneous intestinal communities described in freshwater fish, with Proteobacteria, Firmicutes, Actinobacteriota, Fusobacteriota, and Bacteroidota prominent across tank pools.3,5,6 Reads assigned to Cetobacterium, Romboutsia, Mycobacterium, and Cellulomonas varied among samples. Isolates related to Cetobacterium and Romboutsia have metabolic capacities of potential nutritional interest in tilapia, but those activities were not measured in the present fish.24,25 Moreover, 16S rRNA profiles are compositional: a higher relative abundance can arise from a decline in other taxa without an increase in the absolute abundance of the taxon concerned.20 Genus-level reads assigned to Mycobacterium likewise do not establish species identity, viability, infection, or pathogenicity. The taxonomic observations therefore identify patterns for targeted follow-up, not validated beneficial or pathogenic organisms.
Considered together, the growth and microbiota findings suggest that variation in bacterial community organization can occur without a detectable improvement in short-term somatic growth. The study was not designed to establish whether microbial variation mediated host performance, and no growth-microbiota correlation was conducted because only 12 independent tank observations were available. Similar descriptive water-quality means across treatments and the use of independent circulation loops make a marked treatment-related abiotic imbalance unlikely, but raw tank-by-time water-quality observations and feed- and water-microbiota data were unavailable. Environmental sources of the detected intestinal taxa, therefore, cannot be separated fully from host-associated responses. Pooling three fish within each tank preserved the correct tank-level experimental unit, although it necessarily removed information on fish-to-fish variation within tanks.
Interpretive scope and directions for confirmation
The practical implication is that nominal supplementation with 200-400 mg LEO/kg feed cannot presently be recommended to improve growth in approximately 90-g red tilapia. This conclusion does not imply that lemongrass compounds lack biological activity; rather, it defines the strength and scope of the evidence generated under this particular formulation, size class, duration, and level of replication. The overall bacterial-community signal provides a rationale for further testing, but it does not identify a microbiologically or nutritionally optimal dose. A confirmatory experiment should increase the number of independent tanks, verify geranial and neral concentrations in freshly prepared and stored diets, quantify feed intake and feed conversion, and, where feasible, use fish with a documented genetic background and sex. Parallel sampling of feed, water, and individual fish, together with absolute bacterial quantification and direct measurements of host or metabolites, would determine whether any reproducible microbial response is biologically linked to nutrition or growth.
Conclusion
Nominal dietary supplementation with 200–400 mg lemongrass essential oil/kg feed did not significantly affect final body weight, weight gain, or specific growth rate of red tilapia during the eight-week feeding trial. Alpha-diversity indices were also comparable among diets. Although the omnibus beta-diversity analyses indicated an overall association between diet and bacterial community composition, no pairwise comparison remained significant after false-discovery-rate adjustment, and the Jaccard result was influenced by unequal multivariate dispersion. Therefore, the observed community-level variation cannot be attributed reproducibly to a specific LEO inclusion level. Collectively, the findings do not support an optimal dose or a practical recommendation for LEO supplementation under the conditions examined. Nevertheless, the overall bacterial community signal provides a basis for further investigation with greater tank replication, chemically verified LEO concentrations in finished diets, complete feed intake and feed utilization measurements, and parallel characterization of feed, water, and intestinal microbiota.
Acknowledgments
The authors are especially grateful to the Biology Faculty at Ho Chi Minh University of Education for providing facilities for this research.
Authors’ Contribution - CRediT
Conceptualization: Bich-Dung Mai (Equal), Van-Thanh Vo (Equal), Thi-Huong To (Equal). Methodology: Bich-Dung Mai (Equal), Van-Thanh Vo (Equal), Thi-Huong To (Equal). Investigation: Bich-Dung Mai (Lead). Data curation: Bich-Dung Mai (Lead). Formal Analysis: Bich-Dung Mai (Equal), Thi-Huong To (Equal). Visualization: Bich-Dung Mai (Equal), Thi-Huong To (Equal). Writing – original draft: Bich-Dung Mai (Lead). Writing – review & editing: Bich-Dung Mai (Equal), Van-Thanh Vo (Equal), Thi-Huong To (Equal). Validation: Van-Thanh Vo (Equal), Thi-Huong To (Equal).
Competing of Interest – COPE
No competing interests were disclosed.
Ethical Conduct Approval – IACUC
No institutional animal-use protocol number was issued for this aquaculture nutrition trial. Procedures followed the animal-welfare principles of the Basel Declaration and guidance of the International Council for Laboratory Animal Science. Fish were acclimated before the trial, water quality was monitored daily, and deep MS-222 anesthesia was used before dissection to minimize suffering.
Informed Consent Statement
Not applicable to this animal study. All authors approved the manuscript and its submission.
Data Availability Statement
The raw paired-end 16S rRNA gene amplicon sequencing data generated in this study have been deposited in the NCBI Sequence Read Archive (SRA) under BioProject accession PRJNA1520507 and SRA study accession SRP731620. The 12 individual sequencing runs have been assigned accession numbers SRR40409241–SRR40409252. Additional data supporting the findings of this study are provided within the article and its Supplementary Materials.