
1. Introduction
Tilapia (Oreochromis niloticus) ranks as the world’s second-most farmed freshwater fish, with global production exceeding 4.5 million tonnes annually.1 Intensive aquaculture systems (e.g., pond culture, recirculating aquaculture systems [RAS]) significantly increase microbial load and nutrient accumulation during critical developmental stages such as egg incubation.2 The underdeveloped immune defenses of teleost eggs, including those of tilapia, render them highly susceptible to bacterial pathogens — a vulnerability exacerbated in high-density farming.3
Among emergent pathogens, Pseudomonas aeruginosa (Gram-negative, ubiquitous in aquatic environments) causes severe infections in cyprinids like Cyprinus carpio and Labeo rohita.4,5 Its virulence arsenal—exotoxins, elastases, biofilm formation, and quorum-sensing systems—enables opportunistic pathogenesis.6,7 Similarly, non-O1/O139 Vibrio cholerae strains persist in freshwater ecosystems, and may harbor virulence-associated genes despite lacking ctxAB.8,9 These strains have triggered outbreaks in crustaceans and amphibians,10,11 yet their impact on teleost eggs remains uncharacterized. At the same time, it can also cause sporadic cases of gastroenteritis and extraintestinal infections in humans, and has become a public health issue.
Critically, mixed bacterial infections in intensive systems may amplify pathogenicity through synergistic mechanisms—quorum-sensing crosstalk, immunosuppression, and epithelial barrier disruption. Despite this threat, embryonic-stage co-infections are poorly documented, impeding disease management in hatcheries. We hypothesize that when Pseudomonas aeruginosa and non-O1/O139 Vibrio cholerae are present simultaneously in tilapia eggs, the lethal effect of the co-infection system differs from the lethal effects of monoinfections with either strain alone. In this study, the Bliss independent model and the four-parameter log-logistic model were employed to fit the dose-response curves for each of the two isolates separately.12,13 Building on this, a dual-model quantitative assessment framework was established through cross-validation by applying the Loewe additive model as an auxiliary tool (using the combination index CI as the criterion, where CI < 1 is defined as synergy).14
2. Materials and Methods
2.1. Study Site and Sample Collection
This study was conducted at a commercial tilapia hatchery in Hainan Province, China. In 2023, mortality events occurred in all three batches of eggs at the facility. Many eggs were not scattered individually but were clustered; the dead eggs turned white and gradually dissolved, resulting in a hatch rate of less than 10%. The affected eggs were collected under sterile conditions for pathogen isolation and subsequent analysis. Healthy tilapia eggs were collected from a batch at the same hatchery that was unaffected by the mortality events. These healthy eggs were plump, uniform in color, and had intact, transparent egg membranes; no signs of whitening or dissolution were observed, and embryonic development was normal. They were used for subsequent artificial infection experiments. To prevent the spread of pathogens, the artificial infection experiments were conducted using these healthy eggs in a controlled, recirculating laboratory aquaculture system rather than directly in the hatchery environment. During the experiment, water quality parameters in the hatching water were maintained at a temperature of 30 ± 1 °C, a pH of 8.2 ± 0.5, dissolved oxygen of 5 ± 1 mg/L, total ammonia (NH₃/NH₄) < 0.3 mmol/L, and salinity of 4‰.
2.2. Bacterial Pathogen Isolation and Purification
Approximately 1.0 ± 0.1 g of infected tilapia eggs (equivalent to ~50 eggs) were rinsed three times with sterile phosphate-buffered saline (PBS, pH 7.4) to remove surface contaminants. The eggs were then homogenized in 1 mL of sterile PBS using a pre-chilled, sterile mortar and pestle on ice. A 100-μL aliquot of the resulting homogenate was subjected to ten-fold serial dilutions in sterile PBS, yielding dilutions from 10-1 to 10-6. Aliquots (100 μL) of the 10-2, 10-3, and 10-4 dilutions were spread onto separate Luria-Bertani (LB) agar plates. All plates were incubated at 37°C for 24 hours. Two distinct colony morphotypes that were predominant—defined as morphologically uniform colonies constituting ≥40% of the total colony count on the 10-3 dilution plate—were selected. To obtain pure cultures, each morphotype was subcultured by streaking onto fresh LB agar plates three times consecutively, and purity was confirmed by Gram staining and microscopic examination.
2.3. Molecular Identification of Pathogens
Genomic DNA was extracted from each isolate using a bacterial genomic DNA extraction kit (Tiangen Biotechnology (Beijing) Co., Ltd.). The full-length 16S rRNA gene was amplified using primers 27F and 1492R. PCR conditions were pre-denaturation at 95°C for 5 min; 35 cycles of 95°C for 1 min, 55°C for 30 s, and 72°C for 1 min; followed by a final extension at 72°C for 10 min and a 16°C hold. The PCR system (25 μL) consisted of 13 μL LA Taq, 1 μL of each primer, 1 μL DNA template, and 9 μL ddH₂O. Amplicons were sequenced by BGI Shenzhen. Sequence analysis was performed using BLAST, and phylogenetic trees were constructed using MEGA 7.0.
2.4. Virulence Testing
To assess the relative pathogenicity of the isolated strains against tilapia eggs and select the two most virulent isolates for subsequent LD₅₀ determination, the experiment comprised nine treatment groups (eight experimental groups and one negative control group), with three independent biological replicates per group; each replicate contained 50 healthy eyed-spot stage eggs. During the challenge phase, eggs from each experimental group were placed in sterile 250-mL glass beakers and immersed in 100 mL of the corresponding bacterial suspension at a concentration of 1.0 × 10⁸ CFU/mL under gentle aeration for a 2-hour bath exposure. The control group underwent an identical 2-hour immersion in 100 mL of sterile phosphate-buffered saline (PBS). Following the challenge, all eggs were immediately transferred to a small-scale recirculating hatching system with strictly controlled water quality parameters for a 7-day observation period. Water quality in the hatching system was maintained at a temperature of 30 ± 1 °C, pH of 8.2 ± 0.5, dissolved oxygen of 5 ± 1 mg/L, total ammonia nitrogen (NH₃/NH₄+) < 0.3 mmol/L, and salinity of 4‰. Egg mortality was recorded daily as complete opacification and whitening of the egg, accompanied by the absence of an embryonic heartbeat, observed under a dissecting microscope. Based on the 7-day cumulative mortality rate, the two most virulent strains were selected for dose-response experiments.
2.5. Physiological and Biochemical Characterisation
The two most virulent strains (TLV-01 and LHV-07) were identified using the HuanKai Microbial Identification Kit (Guangdong Huan Kai Microbiology Technology Co., Ltd.). The testing parameters included carbohydrate fermentation (glucose, lactose, inositol), enzyme activity (lysine decarboxylase), gelatin hydrolysis, and DNA hydrolysis. The results were compared against Bergey’s Manual of Systematic Bacteriology.
2.6. Typing of Vibrio cholerae LHV-07
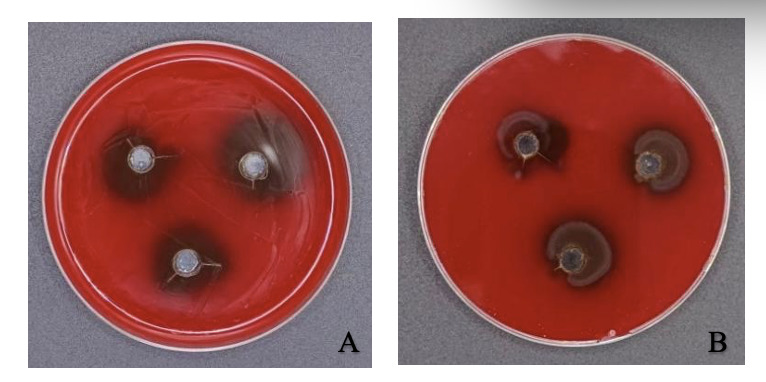
Hemolytic Activity: The strain was streaked onto 5% sheep blood agar plates (Solarbio) and incubated at 30°C for 24 hours. Haemolysis was classified as α, β, or γ, and the diameter of β-haemolysis zones was measured with a Vernier calliper.
Serum Agglutination Test: The strain in the logarithmic growth phase was resuspended in sterile PBS to 1.0 × 10⁸ CFU/mL. Ten microlitres of this suspension were mixed with 10 μL of O1/O139 Vibrio cholerae antiserum (Guangzhou Siyue Biotechnology Co., Ltd Catalog No.HN1001, Lot No. 20250109) on a microscope slide. Agglutination was assessed within 60 seconds under bright-field microscopy; a positive result was defined as the formation of distinct, macroscopic clumps against a clear background, while weak or peripheral granular aggregation without central clearing was considered negative. PBS served as the negative control, and agglutination was observed.
Virulence Gene PCR: Six virulence genes (ctxA, toxR, wbeO1, *wbfO139, VcO1, and VcO139) (Table 1) were detected by PCR. The reaction system (20 μL) contained 10 μL 2× Taq Master Mix, 0.8 μL of each primer (10 μM), 2 μL DNA template, and 6.4 μL ddH₂O. PCR conditions: 95°C pre-denaturation for 5 min; 30 cycles of 95°C for 1 min, 55°C for 30 s, and 72°C for 45 s; and a final extension at 72°C for 10 min. Products were visualised on 1.5% agarose gels.
Primers VcO1 and VcO139 were designed in this study based on conserved sequences within the O1- and O139-specific O-antigen gene clusters, respectively, retrieved from GenBank reference genomes (NC_002505 for O1, NC_012668 for O139). Specificity was verified in silico using BLASTn against the NCBI nr database to ensure no cross-reactivity with non-target Vibrio species or other common aquaculture pathogens. Due to institutional biosafety restrictions prohibiting the handling of pandemic O1/O139 strains, experimental validation employed negative controls and confirmed the absence of amplification.
2.7. Artificial Infection Experiments
Single infection: The two most virulent isolates identified in the preliminary screening (TLV-01 and LHV-07) were evaluated separately to establish dose-response relationships. For each strain, five final bacterial concentrations were tested: 2.0 × 10⁴, 2.0 × 10⁵, 2.0 × 10⁶, 2.0 × 10⁷, and 2.0 × 10⁸ CFU/mL. Three independent biological replicates were performed for each concentration, with each replicate containing 50 healthy eyed-spot-stage eggs. The challenge was performed by immersing the eggs in 100 mL of the corresponding bacterial suspension in sterile glass beakers under gentle aeration for 2 hours; the PBS control group was processed in parallel. After the 2-hour challenge, the eggs were transferred to the aforementioned recirculating hatching system for a continuous 7-day observation period. Water quality in the small-scale hatching system was maintained as in the virulence testing. Daily mortality was recorded and 7-day dose-response curves were constructed to estimate the LD₅₀ values with their 95% confidence intervals. Dead eggs were randomly selected, homogenized, and subjected to pathogen re-isolation and molecular confirmation to fulfill Koch’s postulates.
Mixed infection: To evaluate the combined pathogenicity of TLV-01 and LHV-07 in mixed infection, suspensions of the two strains were combined at a 1:1 volume ratio. The total bacterial concentration in the mixed suspensions was set at 2.0 × 10⁴, 2.0 × 10⁵, 2.0 × 10⁶, 2.0 × 10⁷, and 2.0 × 10⁸ CFU/mL, corresponding to a final concentration of 1.0 × 10⁴, 1.0 × 10⁵, 1.0 × 10⁶, 1.0 × 10⁷, and 1.0 × 10⁸ CFU/mL for each individual strain, respectively. For each total concentration, three independent biological replicates were prepared, each containing 50 healthy eyed-spot-stage eggs. The challenge procedure was identical: eggs were immersed in the mixed suspension for 2 hours, then transferred to the controlled recirculating hatching system for a 7-day observation period. Water quality in the small-scale hatching system was maintained as in the virulence testing. Daily mortality was recorded, and the 7-day LD₅₀ for the mixed challenge was estimated from the data. Pathogen re-isolation and molecular confirmation were performed on dead eggs as described for the single-infection experiments to verify the co-involvement of both pathogens.
To quantitatively evaluate the combined lethal effects of co-infection with TLV-01 and LHV-07, and to circumvent the dose mismatch arising from the fact that the actual inoculation concentration of each strain in the co-infection groups (1.0×10⁴–1.0×10⁸ CFU/mL) was only half of that in the corresponding single-infection groups (2.0×10⁴–2.0×10⁸ CFU/mL), direct point-to-point comparisons were avoided. Instead, a dual-model quantitative framework based on dose-response curve fitting was established, with the Bliss independent model serving as the primary quantitative assessment method and the Loewe additive model providing supplementary cross-validation. Firstly, using the log10-transformed inoculation concentration as the x-axis and the 7-day mortality rate (%) as the y-axis, four-parameter log-logistic (LL.4) dose-response curves were fitted to the monogonal infection data for TLV-01 and LHV-07. The model equations are as follows12:
\[E = c + \frac{d - c}{1 + \exp\left\lbrack b\left( \log_{10}(C) - \log_{10}\left( {EC}_{50} \right) \right) \right\rbrack}\]
Where E is the mortality rate (%), C is the inoculation concentration (CFU/mL), b is the slope factor, EC₅₀ is the median effective concentration, and c and d represent the lower and upper asymptotic limits, respectively. For TLV-01, the fitted parameters were: c≈5.2% (lower asymptote), d≈94.8% (upper asymptote), b≈−0.6 (slope factor), and EC₅₀ ≈ 2.0×10⁷ CFU/mL. For LHV-07, the fitted parameters were: c≈3.8%, d≈96.2%, b≈−1.2, and EC₅₀ ≈ 5.0×10⁶ CFU/mL. Fitting was performed using the drm function of the drc package (v3.0-1) in R software (v4.0.0) via the least-squares method.
Based on the fitted curves, forward interpolation was applied to derive the expected single-strain mortality rates EA (TLV-01) and EB (LHV-07) at each co-infection concentration gradient (1.0×10⁴, 1.0×10⁵, 1.0 × 10⁶, 1.0 × 10⁷, 1.0 × 10⁸ CFU/mL). The interpolated results for EA were 13.80%, 17.80%, 30.18%, 38.49%, and 46.29%, respectively; for EB, they were 17.09%, 30.09%, 36.10%, 54.47%, and 71.79%, respectively. The expected combined mortality rate was then calculated according to the general Bliss mortality formula16:
\[E_{\text{expected}} = E_{A} + E_{B} - E_{A} \times E_{B}\]
The calculated Eexpected values at the five concentration points were 28.53%, 42.53%, 55.38%, 72.00%, and 84.85%, respectively. If the observed mortality rate Eobs is higher than Eexpected, a synergistic trend is indicated; if close to Eexpected, an additive effect is indicated; if significantly lower than Eexpected, the deviation is interpreted as a high-density saturation effect due to microenvironmental resource limitations. For statistical evaluation, based on three independent replicates (N=150 per concentration point), the observed mortality frequencies were compared with the expected mortality frequencies based on Eexpected using the Chi-square (χ2) test, with p<0.05 considered statistically significant.
As a complementary validation, the Loewe additivity model was also employed. Using the observed mortality rate Eobs as the target effect level, the equivalent single-agent concentrations DA (TLV-01) and DB (LHV-07) required for each strain alone to achieve this mortality level were derived by log-linear interpolation on the fitted curves17:
\[ \begin{align} \log_{10}(D) &= \log_{10}\left( C_{1} \right) + \frac{E_{1} - E_{\text{obs}}}{E_{1} - E_{2}} \\&\quad\times \left\lbrack \log_{10}\left( C_{2} \right) - \log_{10}\left( C_{1} \right) \right\rbrack \end{align} \]
When Eobs fell outside the known data range, linear extrapolation using the terminal slope was applied. The Combination Index (CI) was then calculated as: Where dA and dB are the actual final inoculation concentrations of TLV-01 and LHV-07 in the co-infection groups (both at 1.0 × 10⁴, 1.0 × 10⁵, 1.0 × 10⁶, 1.0 × 10⁷, and 1.0 × 10⁸ CFU/mL, respectively). CI < 1 indicates a synergistic trend, CI ≈ 1 indicates additivity, and CI > 1 indicates a deviation trend. The 95% confidence intervals of the CI values were estimated by bootstrap resampling (1000 resamples, with experimental replicates as sampling units). The Loewe model results were used solely as cross-validation references for the primary Bliss model conclusions.14
2.8. Antibiotic Susceptibility Testing
In accordance with the guidelines of the Clinical and Laboratory Standards Institute (CLSI, 2024), antimicrobial susceptibility testing was performed using the disc diffusion (Kirby-Bauer) method. A bacterial suspension at a concentration of 1.0 × 10⁸ CFU/mL was prepared and evenly spread onto Mueller-Hinton (M-H) agar plates (Beijing BioDee Biotechnology Co., Ltd.). Antibiotic discs (Hangzhou Microbial Reagents Co., Ltd.) were placed on the plates, which were then incubated at 37°C for 18–24 hours. The diameter of the inhibition zone was measured (to the nearest 0.1 mm) and classified into three categories—sensitive (S), moderately sensitive (I) or resistant (R)—in accordance with CLSI standards. Each antibiotic was tested in triplicate. The use of antibiotic discs containing substances prohibited or suspended for use in aquaculture in China was strictly for laboratory research and not for any commercial applications. It should be noted that the incubation temperature of 37°C was selected to align with standard clinical protocols for human pathogens as defined by CLSI; however, this differs from the typical growth temperature (25-30°C) of these vibrios in aquaculture environments. Consequently, the interpretive criteria (breakpoints) applied herein are those established for clinical isolates and may not fully reflect the in situ antimicrobial response under fish farming conditions.
2.9. Efficacy Assessment of Antimicrobial Agents on Tilapia Egg Hatching
During this outbreak of fish egg disease, we collected fish eggs specifically for this purpose and incubated them alongside various common commercial antimicrobial agents, including environmental disinfectants and therapeutic antibiotics, to identify emergency interventions. Six treatment groups were established, each with three replicates: control (CT, PBS), enrofloxacin (EN, 4 mg/L), iodine (PO, 20 mg/L), bromochlorohydrin (DI, 10 mg/L), chloramine-T (LT, 4 mg/L), and tetracycline (TE, 4 mg/L). Each replicate consisted of ~300 eggs in 30 mL of water in the hatching chamber of a recirculating system connected to a 1.25 L reservoir. Disinfectants were continuously applied for 2 days, with 50% water changes daily. Hatching rates were calculated after 7 days.
\[\text{Hatching rate (%)} = \frac{\text{Number of surviving fry}}{\text{Total number of eggs}}\times 100 \text{%}\]
2.10. Data Processing and Analysis
Experimental data in this study were analyzed and plotted using SPSS 27.0 (IBM Corp., Armonk, NY, NY, USA) and GraphPad Prism 10.0.1 (GraphPad Software, San Diego, CA, USA). Probit regression analysis was performed to estimate the median lethal dose (LD₅₀) and its 95% confidence interval for the Pseudomonas aeruginosa TLV-01 single-infection group, the Vibrio cholerae LHV-07 single-infection group, and the co-infection group, respectively. The differences in survival curves between groups were compared using the Log-rank (Mantel-Cox) test. For the Bliss model, synergy was assessed by comparing observed and expected mortality frequencies at each concentration using the Chi-square (χ2) test. For the Loewe model, the statistical reliability of CI values was evaluated by estimating 95% confidence intervals via bootstrap resampling (1000 resamples, with experimental replicates as sampling units). P < 0.05 was considered statistically significant.
3. Results
3.1. Isolation of Pathogens
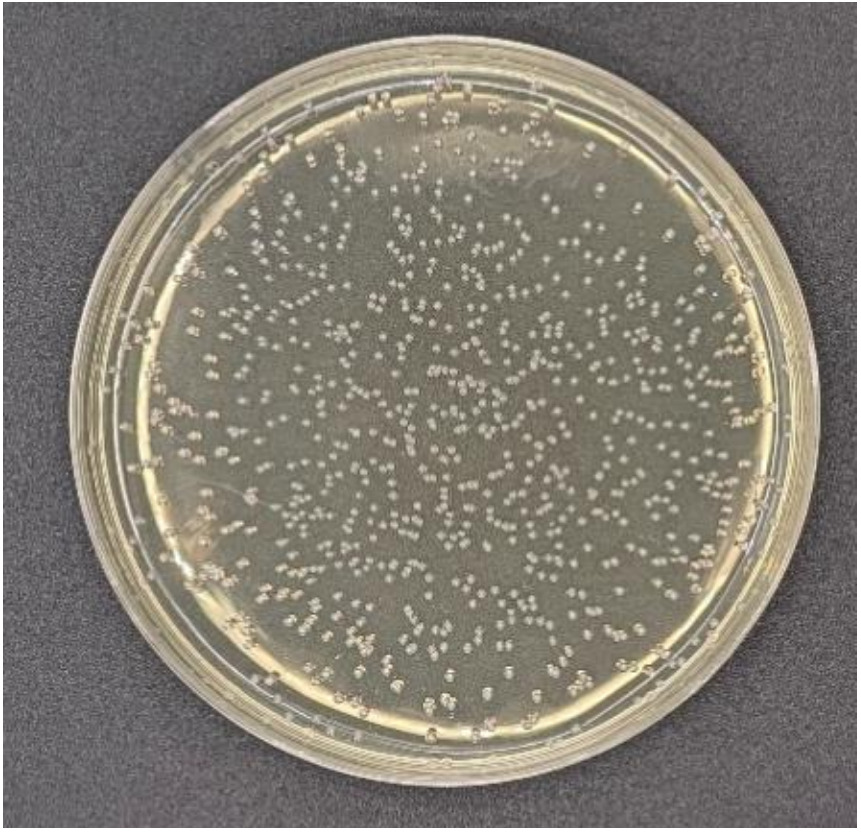
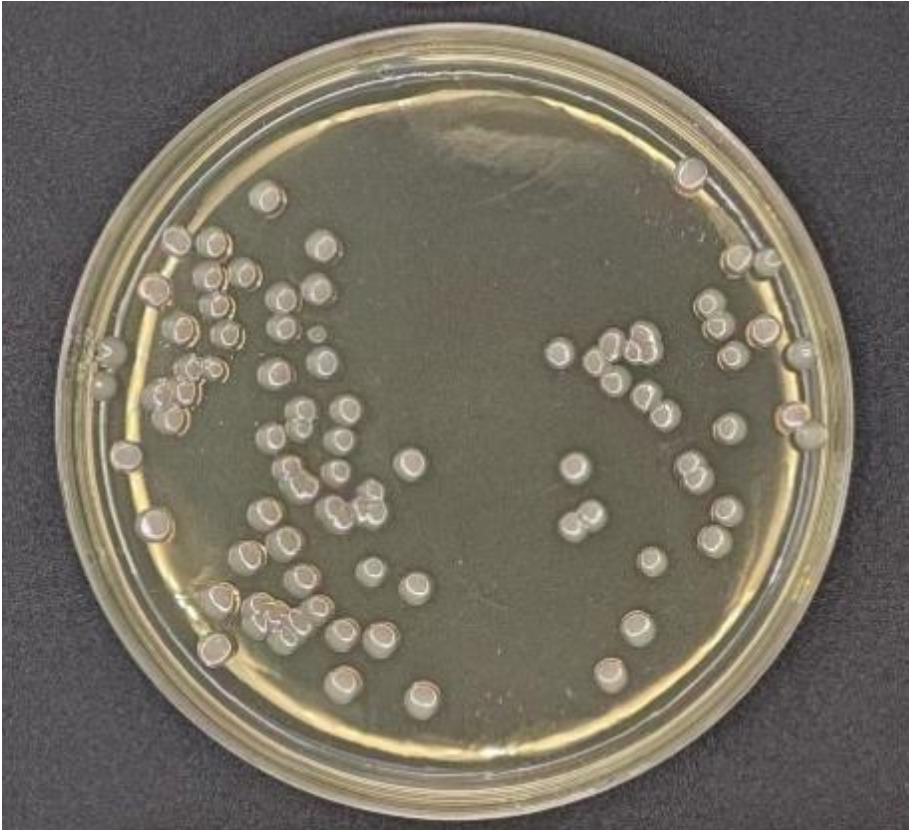
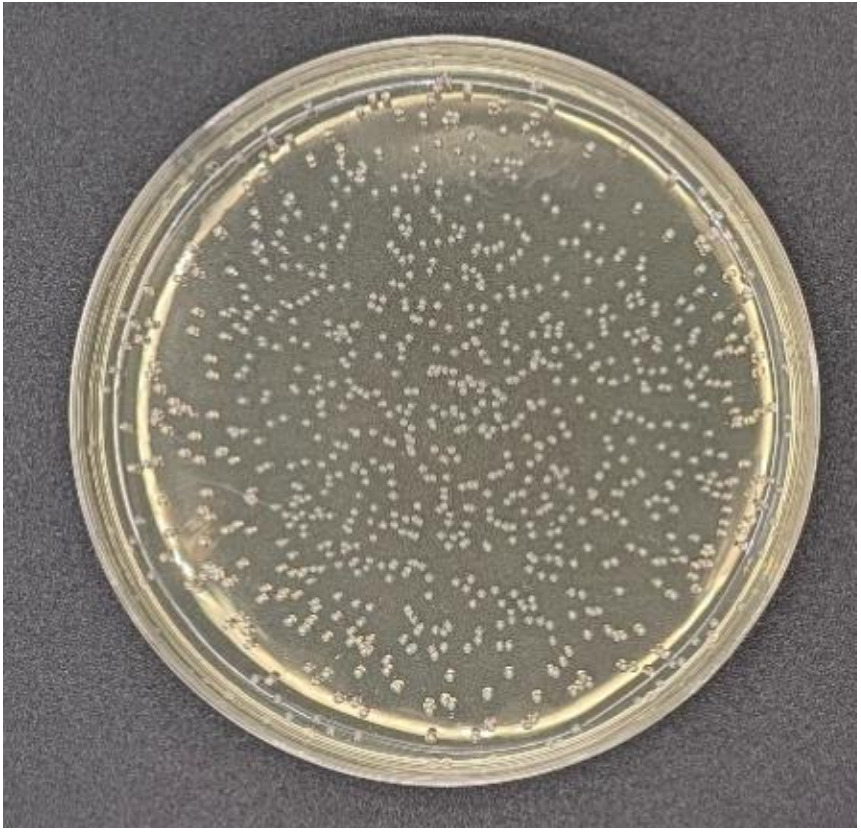
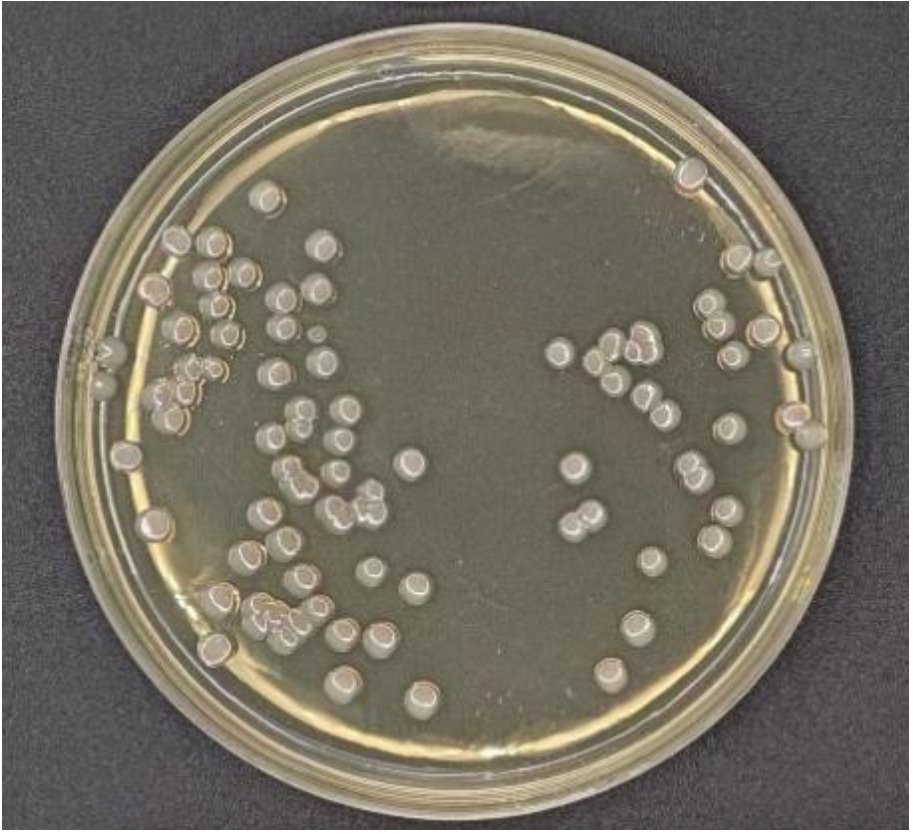
After 24 hours of incubation on LB agar, multiple morphologically distinct colonies were observed. Two colony types predominated:
-
colonies with a slightly raised centre, circular shape, moist surface, relatively small size, and a noticeable odour (Fig. 1);
-
colonies that were smooth, moist, flat, translucent, larger, and with well-defined margins (Fig. 2).
Four colonies were selected from each colony type, yielding eight isolates in total. These isolates were designated TLV-01, TLV-02, TLV-03, TLV-04, LHV-05, LHV-06, LHV-07, and LHV-08.
3.2. Pathogen Identification
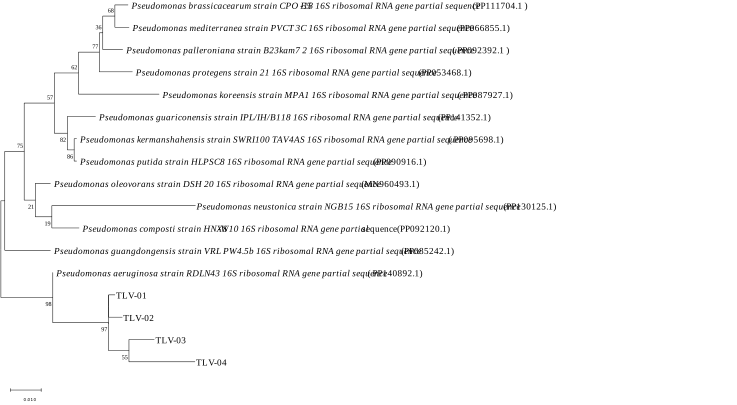
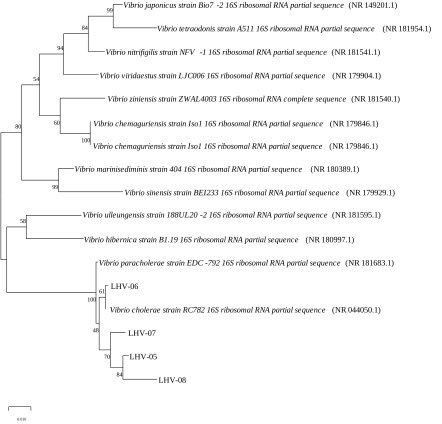
PCR amplification using universal 16S rRNA primers produced ~1500 bp fragments from all eight isolates. BLAST analysis confirmed taxonomic identity as follows:
-
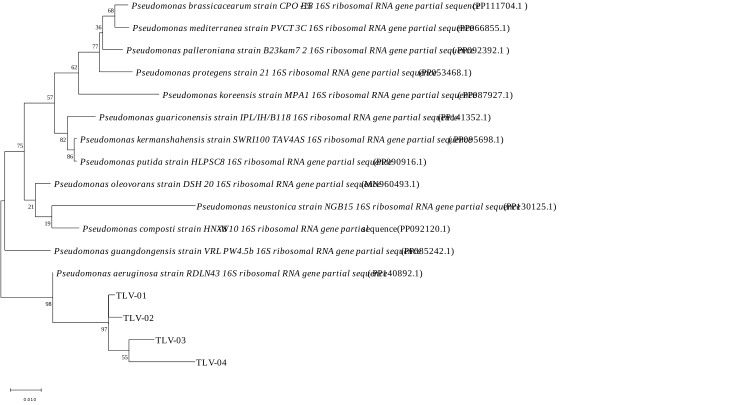
TLV group (4 strains): >97.50% similarity with Pseudomonas aeruginosa
-
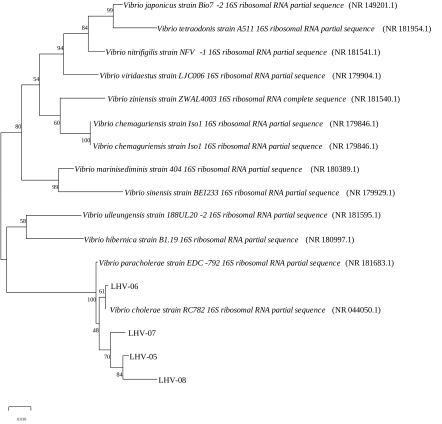
LHV group (4 strains): >98.95% similarity with Vibrio cholerae
Phylogenetic analysis further supported these results. TLV isolates grouped with P. aeruginosa strain RDLN43 (Fig. 3), while LHV isolates clustered with V. cholerae strain RC782 (Fig. 4).
3.3. Pathogenicity Testing
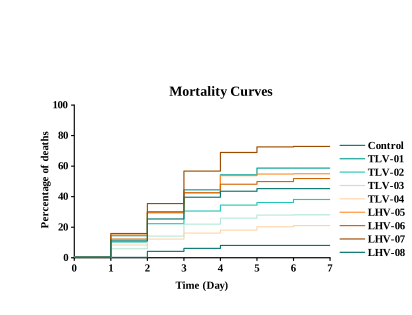
All eight isolates (TLV-01, TLV-02, TLV-03, TLV-04, LHV-05, LHV-06, LHV-07, and LHV-08) caused mortality in tilapia eggs. The most virulent strains, TLV-01 and LHV-07, were selected as representative strains for the LD₅₀ artificial infection assay. These correspond to the dominant isolates of Pseudomonas aeruginosa and Vibrio cholerae, respectively. The morphological and biochemical characteristics of the re-isolated strains were fully consistent with those of the original inoculum. Furthermore, all re-isolated strains were also confirmed by 16S rRNA gene sequencing, thus fulfilling the Koch’s postulates. (Fig. 5).
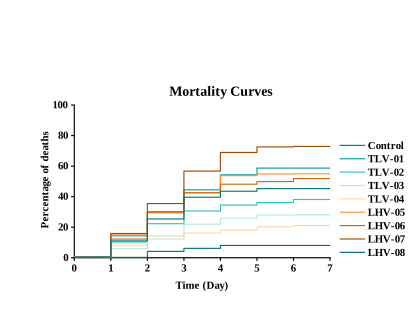
Fig.5 The 7-day mortality rate in tilapia eggs infected with different bacterial isolates.
3.4. Biochemical Profiling
Biochemical assays showed that both bacterial groups fermented glucose, lactose, maltose, sucrose, sorbitol, and silicon and were positive for gelatine and cellobiose hydrolysis. Neither group utilized xylose, maltose, or β-galactosidase, nor showed activity for Simon’s citrate, lysine decarboxylase, or ornithine decarboxylase. A distinguishing feature was inositol utilization: TLV-01 did not utilize inositol; LHV-07 did, which aligns with the biochemical characteristics of Pseudomonas aeruginosa and Vibrio cholerae, respectively.
3.5. Typing of Vibrio cholerae
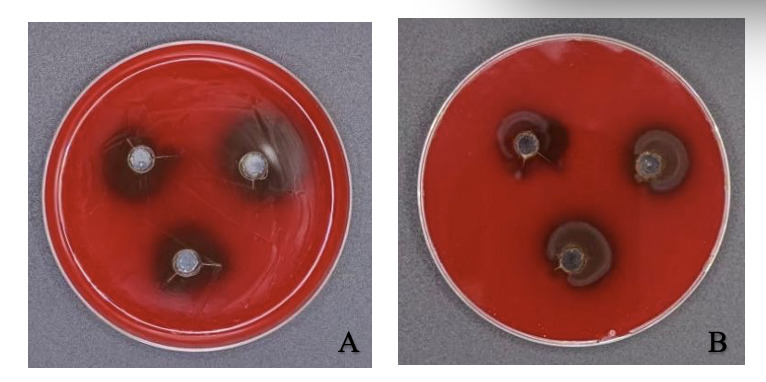
Both pathogens produced β-haemolysis on blood agar. Haemolytic zones measured 2.05 + 0.08 cm for TLV-01 (Fig. 6A) and 1.60 + 0.05 cm for LHV-07 (Fig. 6B). Serological agglutination tests showed that LHV-07 did not agglutinate with antisera from the O1/O139 serogroup, confirming that it belongs to a non-O1/O139 serogroup. PCR screening confirmed that it does not carry virulence genes from the O1 or O139 Vibrio cholerae serogroups tested.
3.6. Pathogenicity and Interaction Analysis
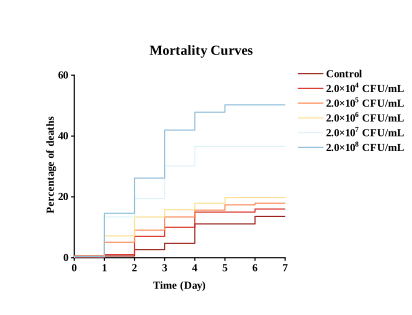
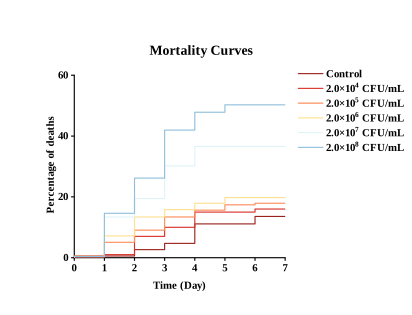
TLV-01 Infection: Following infection, the mortality rate of fish eggs gradually increased as bacterial concentration rose; mortality rates in all groups stabilized between 5 and 7 days. Its 7-day half-lethal concentration was 2.0×10⁸ CFU/mL (Fig. 7).
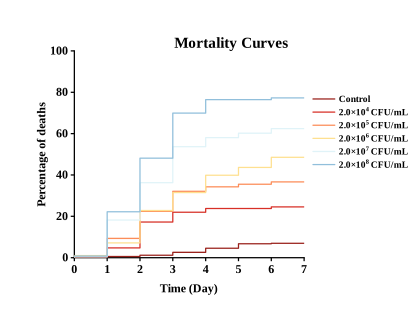
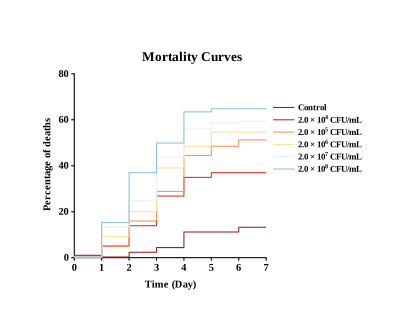
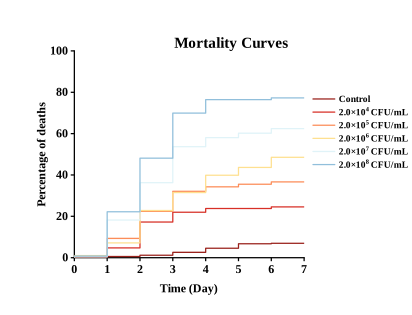
LHV-07 infection: The mortality rate continued to rise following infection, and the survival rate of fish eggs was significantly reduced in all infected groups (Fig. 8). The higher the concentration of the pathogenic strain, the more rapidly the mortality curve for tilapia eggs in the corresponding experimental group rose. The 7-day half-lethal concentration was 2.0 × 10⁶ CFU/mL.
The mixed challenge with TLV-01 + LHV-07 yielded an estimated 7-day LD₅₀ of 2.0 × 10⁵ CFU/mL, which was lower than the corresponding single-strain LD₅₀ estimates for LHV-07 (2.0 × 10⁶ CFU/mL) and TLV-01 (2.0 × 10⁸ CFU/mL) (Fig. 9). This comparison indicates enhanced lethality of the mixed challenge at the dose-response level, but the reduction in LD₅₀ alone was not used as evidence of statistical synergism. Aggregation and attachment of eggs were also observed during the infection experiments.
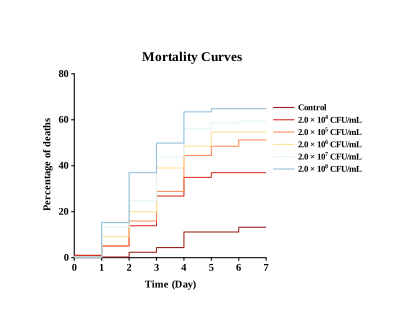
Based on the four-parameter Log-logistic fitted curves and forward interpolation, the expected single-strain mortality rates (EA, EB) of TLV-01 and LHV-07 at each co-infection concentration were derived, and the expected combined mortality rate was calculated according to the general Bliss mortality formula. The results are summarized in Table 2. In the low concentration range (1.0 × 10⁴–1.0 × 10⁵ CFU/mL), the observed mortality rates (35 %, 47 %) were slightly higher than the expected mortality rates (28.53 %, 42.53 %), suggesting a synergistic trend. At a concentration of 1 × 10⁶ CFU/mL, the observed mortality rate (54 %) was almost exactly in line with the expected mortality rate (%), strictly conforming to the additive model.
To cross-validate the results obtained from the Bliss model, the Loewe additivity model (Combination Index, CI) was additionally employed as a complementary analysis. The results are summarized in Table 3. Within the concentration range of 1.0 × 10⁴–1.0 × 10⁷ CFU/mL, all CI values were below 1 (ranging from 0.021 to 0.662), and the upper limits of the 95% guided confidence intervals were all below 1, indicating a trend towards synergism. The lowest CI value (CI = 0.021) was observed at 1.0 × 10⁵ CFU/mL, indicating the strongest potential for synergism at this concentration. At 1.0 × 10⁷, CI = 0.662 (95% CI: 0.581–0.728), which remains well below 1.
3.7. Antibiotic Sensitivity
TLV-01 was sensitive to 12 antibiotics, moderately responsive to 10, and resistant to 8. The most effective agents were: Chloramphenicol (7.14±0.57 mm) (Prohibited Drugs, Trimethoprim (7.35±0.36 mm), and Streptomycin (7.83±0.31 mm). Resistant antibiotics included Enrofloxacin (29.70 ± 0.16 mm), Ciprofloxacin (21.52 ± 0.10 mm) (Prohibited Drugs), Ofloxacin (19.73±0.63 mm) (Prohibited Drugs).
LHV-07 showed high sensitivity to 6 antibiotics, intermediate sensitivity to 9, and resistance to 15. The greatest inhibition was observed with: Trimethoprim (0.00±0.00 mm), Polymyxin B (6.21±1.16 mm), and Furazolidone (8.35±0.59 mm) (Prohibited Drugs). Resistance was recorded against Ofloxacin (33.13±0.39 mm) (Prohibited Drugs), Ciprofloxacin (29.97±0.99 mm) (Prohibited Drugs), Chloramphenicol (28.67±0.70 mm) (Prohibited Drugs) (Table 4).
3.8. Disinfection Efficacy
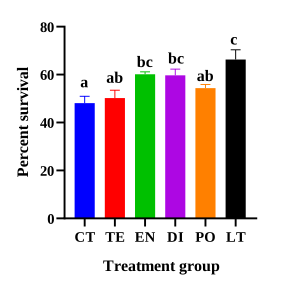
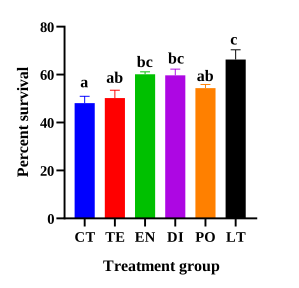
The highest egg survival rate occurred with 4 mg/L chloramine-T (65.2 ± 2.5%), followed by 4 mg/L enrofloxacin (60.1 ± 1.8%), 10 mg/L bromochlorohydrin (58.5 ± 2.1%), 20 mg/L iodine (54.7 ± 2.2%), and 4 mg/L tetracycline (52.3 ± 1.9%).
The control group showed the lowest survival rate (48.9 ± 2.3%). No deformities were observed in LT, EN, or DI treatments, indicating that these concentrations are safe and effective for tilapia egg disinfection (Fig.10).
4. Discussion
Through a comprehensive analysis, including examination of colony morphology, physiological and biochemical characteristics, and 16S rRNA sequencing, this study confirmed that the primary pathogens isolated from the eggs of diseased tilapia were Pseudomonas aeruginosa and non-O1/O139 Vibrio cholerae. To our knowledge, this study is the first to report a mixed pathogen infection involving both Pseudomonas aeruginosa and non-O1/O139 Vibrio cholerae in the eggs of farmed fish, thereby extending the known host range of these two pathogens from fry and adult fish to the embryonic stage.
Previous studies have shown that Pseudomonas aeruginosa causes erythema, abdominal swelling, corneal opacity, scale loss, and gill inflammation in tilapia18; gill ischemia and hepatopancreatic congestion in crucian carp (Carassius auratus gibelio)19; and hemorrhagic lesions in the abdomen and pallor of the liver in grass carp(Ctenopharyngodon idella).20 Furthermore, non-O1/O139 Vibrio cholerae have been reported in tilapia, loach (Misgurnus anguillicaudatus),21 giant freshwater prawn (Macrobrachium rosenbergii),22 and the American bullfrog (Rana catesbeiana)23; however, to date, there have been no reports of separate or mixed infections of tilapia eggs with Pseudomonas aeruginosa and non-O1/O139 Vibrio cholerae. Our findings indicate that fertilized eggs are equally susceptible, likely due to weakened innate immune defenses during early developmental stages. The ability of Vibrio cholerae to colonize tilapia during early development poses new challenges for disease control in hatcheries.
The estimated LD₅₀ values obtained from the mixed-infection trials were significantly lower than those from any of the single-strain infection trials, suggesting that the lethality of mixed infections is enhanced at the dose–response level. This finding is consistent with previous reports that mixed bacterial infections can alter the severity of disease in farmed fish.24,25 However, a reduction in LD₅₀ values alone does not prove the presence of synergism. Furthermore, when the concentrations of each strain in the mixed-infection group were only half those in the single-strain group, the Bliss independence model based on the ‘equal-dose assumption’ could not perform direct point-to-point statistical comparisons. To address this methodological limitation, this study abandoned the traditional strategy of direct point-to-point comparisons and instead obtained the expected combined mortality rates at various concentration points of the mixed infection through four-parameter log-logistic fitting and forward interpolation.26
The Bliss model indicates that, within the low-concentration range (1.0 × 10⁴–1.0 × 10⁵ CFU/mL), mortality rates tend to be higher than expected, suggesting that mixed infections at low concentrations primarily exhibit weak synergistic effects. At medium concentrations (1.0 × 10⁶), the observed results are almost entirely consistent with expectations, strictly adhering to the additive model, which further confirms the predictability of the effects within this concentration range. Within the high-concentration range (1.0 × 10⁷–1.0 × 10⁸), the observed mortality rate was significantly lower than the extreme values predicted based on independent action. This phenomenon should be regarded as a ‘mortality saturation effect’ resulting from limited resources—such as space, nutrients and oxygen—in the infection microenvironment under high-density conditions, rather than a biologically significant negative interaction between the two strains. When pathogen density exceeds the carrying capacity of the microenvironment, bacterial proliferation is constrained by physical space and nutrient depletion; due to excessive density, quorum sensing signals may trigger a feedback-mediated downregulation of virulence factors, thereby preventing the actual mortality rate from reaching the extreme levels predicted by the independent action theory.27 As supplementary validation, the CI values derived from the Loewe additive model were consistently below 1 within the low-to-medium concentration range (1.0 × 10⁴–1.0 × 10⁷), indicating a trend towards synergy. It should be noted, however, that this model is based on the ‘common target’ hypothesis, whereas the Bliss model is based on the ‘independent target’ hypothesis; consequently, the two models employ different evaluation criteria.28 The Bliss cross-validation results support the conclusion of synergism in the low-concentration range (1.0 × 10⁴–1.0 × 10⁵ CFU/mL), but show discrepancies with the Loewe model’s output in the high-concentration range (1.0 × 10⁶–1.0 × 10⁸ CFU/mL). This discrepancy may also be attributable to the limitations of the two models in this study. The limitations of the Bliss independent model are primarily reflected in its core assumption: that the lethal effects of the two bacterial strains on the host act on mutually independent targets or pathways.28 However, both TLV-01 and LHV-07 exert their pathogenic effects by infecting tilapia eggs; they share similar host tissue targets (embryonic cells in fish eggs) and a common pathogenic process (adhesion, invasion, toxin secretion, tissue destruction). This suggests that the ‘independent action’ assumption of the Bliss model may be too restrictive in the context of this study. When two bacterial strains share the same limited host resources, the Bliss model tends to overestimate the expected combined mortality rate under high-density conditions. This is precisely one possible reason why, in this study, the mortality rate observed in the concentration range of 1.0×10⁷–1.0×10⁸ CFU/mL was significantly lower than the extreme predicted values: the Bliss model ‘allows’ both strains to independently reach their theoretical maximum effect, but the actual microenvironment cannot simultaneously support both strains in reaching this extreme level. Furthermore, the Bliss model is, by its nature, a static probabilistic model that cannot capture the temporal dynamics of the infection process (such as differences in the proliferation rates of the two bacterial strains, the sequence of colonization, and the time window of the host immune response), which may lead to an oversimplification of the actual interaction patterns described by the model. Secondly, due to the lack of measured single-strain mortality data for TLV-01 and LHV-07 at mixed concentrations in this study, the calculation of Bliss predicted values relied on the fitting of a four-parameter log-logistic model and forward interpolation. Although the LL.4 model is widely accepted in toxicological dose–response analysis, the interpolation process in the high-concentration range of 1.0×10⁷–1.0×10⁸—which lies at the ends of the two single-strain curves—inevitably introduces estimation errors. The accuracy of the interpolation is limited by the experimental design, which involved only five discrete concentration gradients for single-strain infection; minor fluctuations at the ends of the curves may be amplified by the interpolation process, thereby affecting the precision of the Bliss expected values in the high-concentration range.29 The Loewe model is based on the principle of dose additivity, assuming that the mechanisms of action of two formulations are identical or extremely similar, and that the superposition of effects follows the logic of ‘equivalent dose substitution’. However, TLV-01 and LHV-07 exhibit fundamental differences in terms of taxonomy, pathogenicity profiles, host colonization strategies and quorum sensing systems; they are not ‘homologous’ or ‘same-target’ formulations. Theoretically, the applicability of this model is limited. Consequently, this study positions the Loewe model as a supplementary validation tool rather than a primary model; this is a proactive measure taken precisely to circumvent this theoretical limitation.30 Secondly, this study tested only a 1:1 mixing ratio of TLV-01 and LHV-07; however, the accurate application of the Loewe model typically requires complete dose-response data for multiple fixed ratios (e.g. 1:1, 1:3, 3:1, etc.).28 Although confidence interval (CI) values for a single ratio (e.g. CI = 5.018 at a concentration of 1.0 × 10⁸ in this study) may indicate a trend towards interaction at that ratio, they cannot fully reflect the synergistic interaction patterns between the two bacterial strains across all possible ratio combinations.
Although there are discrepancies between the experimental results of the two models in this study, these do not indicate contradictory findings; rather, they strongly support the view that these two pathogens do not act on independent targets, but rather act in concert on the same set of susceptible pathways in tilapia eggs. One possible mechanism is cross-communication between the quorum-sensing systems of the two pathogens.31 Signaling molecules such as 3-oxo-C12-HSL from Pseudomonas aeruginosa and AI-2 from Vibrio cholerae could potentially alter virulence-factor expression within the shared infection microenvironment.32 This proposed mechanism remains hypothetical and requires direct experimental validation. Direct experimental evidence is still needed to determine whether quorum-sensing cross-communication occurs between Pseudomonas aeruginosa and Vibrio cholerae in the tilapia egg infection model and whether it contributes to concentration-dependent interaction. Furthermore, aggregation of infected eggs may increase local bacterial exposure and facilitate pathogen transmission within the population. Whether this physical aggregation is driven by bacterial products, host responses, or both, and how it contributes to mixed-infection pathogenesis, warrants further investigation.
This study represents the first systematic investigation of the antimicrobial susceptibility profiles of Pseudomonas aeruginosa TLV-01 and non-O1/O139 Vibrio cholerae LHV-07 isolated from tilapia eggs. The results indicate that TLV-01 exhibits a typical pattern of multidrug resistance, being resistant to eight antibiotics, including fluoroquinolones and polymyxin B. In contrast, LHV-07 was resistant to 15 antibiotics, including florfenicol, but was susceptible to polymyxin B. It should be emphasised that the susceptibility/resistance data for chloramphenicol and furazolidone are of purely academic significance, as the use of both compounds is strictly prohibited in aquaculture production in China (Ministry of Agriculture and Rural Affairs Announcement No. 250).
The resistance of TLV-01 to most aminoglycosides except gentamicin likely reflects enhanced efflux pump activity, consistent with classical resistance mechanisms in P. aeruginosa. The inherent resistance of Pseudomonas aeruginosa is closely associated with the synergistic effects of its outer membrane’s low permeability and various efflux pump systems.33,34 The ability to form biofilms may further exacerbate phenotypic resistance by limiting antibiotic penetration into the deeper layers of the biofilm, but the specific contribution of efflux pumps still needs to be verified through experiments with efflux pump inhibitors.35 The polymyxin B resistance observed in LHV-07 is particularly concerning as it may limit therapeutic options. However, the high susceptibility of both strains to fluoroquinolones suggests this antibiotic class could serve as an effective treatment option for bacterial infections in tilapia eggs, provided that dosage and withdrawal periods are strictly controlled to prevent resistance development. Long-term use of fluoroquinolones alone can easily induce target mutations and overexpression of efflux pumps.36 These findings underscore the critical importance of implementing precision antimicrobial use and stewardship programs in aquaculture, while also highlighting the ecological risk of fish eggs as potential vectors for pathogen transmission.
The highest hatching success was recorded in the 4 mg/L chloramine-T treatment group, achieving 65.2 ± 2.5%. This effectiveness is likely associated with its sustained chlorine release, long antimicrobial persistence, and relatively low toxicity to developing eggs. Unlike iodine or oxytetracycline, chloramine-T retains bactericidal activity for more than 48 hours, preventing secondary pathogen proliferation.37 Comparable findings were reported by, where 15 mg/L chloramine-T significantly improved goldfish survival, reinforcing its potential as a preferred disinfectant for tilapia eggs under the current experimental conditions.38 The mechanism of action of chloramine-T in aquatic environments does indeed rely on its release of reactive chlorine species (such as hypochlorous acid, HOCl) in water, thereby achieving a broad-spectrum bactericidal effect. Studies on zebrafish (Danio rerio) embryos have shown that high concentrations of chloramine-T can induce cardiotoxicity and neurotoxicity39; however, fertilized tilapia eggs are not typically consumed directly as food; besides, under standard application conditions (e.g. ≤10 mg/L, short-term immersion), chloramine-T’s ability to penetrate the egg membrane is limited, making it difficult for significant residues to accumulate in embryonic tissues.40
Enrofloxacin is metabolized into antibacterial ciprofloxacin in farmed fish such as tilapia, yellow catfish, and carp; ciprofloxacin exhibits a slower elimination rate than the parent compound, and both compounds are subject to aquaculture residue monitoring.41–43 Accordingly, strict global regulatory controls govern enrofloxacin use in food fish production, with China specifying a maximum residue limit of 100 μg/kg for the combined residues of enrofloxacin and ciprofloxacin in fish muscle.40 However, to date, no globally recognized statutory withdrawal periods based on systematic residue depletion data are available for fish egg treatment, and non-standard approaches including egg immersion cannot support the establishment of scientifically valid and enforceable withdrawal intervals.
Even with optimal chloramine T treatment, the final hatching rate (65.2%) was relatively low. The reasons might be: First, while this disinfection suppresses major pathogens, it cannot fully remove the whole pathogenic and opportunistic microbial community within egg microenvironments.44 Second, chloramine T at safe working concentrations may induce subtle sublethal stress to embryos.39 These results reveal a key obstacle in aquatic disease control: single-drug treatments hardly fully block multi-factor syndromic disease outbreaks driven by environmental stress and complex microbiota.45 High hatch rates (>80%) documented in literature are obtained using pathogen-free broodstock under strict laboratory settings and seldom reproduced in commercial intensive hatcheries. Production records of the farms in this study showed baseline hatching rates stayed at 62.3%–71.5% across 12 production cycles under pathogen-free routine operations, far below the 80% theoretical maximum. Therefore, the observed 65.2% hatching rate represented restoration to regular commercial baseline. Though 65% hatching rate is suboptimal, this treatment saved the hatchery from catastrophic failure in emergencies. Breaking this 65% bottleneck requires integrated management including improved broodstock nutrition, UV treatment of inlet water, and probiotic regulation of hatching water.
It is noteworthy that one of the predominant pathogens identified in this study, LHV-07, was characterized as a haemolytic, environmental non-O1/non-O139 Vibrio cholerae strain. Although non-O1/non-O139 V. cholerae strains lack cholera toxin and thus do not pose zoonotic hazards originating from fish, they remain of considerable clinical and public-health concern.46 These environmental vibrios are increasingly documented as causative agents of human extraintestinal infections such as wound infections, septicaemia, and meningitis, which typically occur upon exposure to contaminated water or ingestion of raw or undercooked seafood.47 The detection of these potentially pathogenic strains in aquaculture hatcheries highlights the necessity of integrated biosecurity strategies to protect fish health and reduce human-health hazards for farm personnel and seafood consumers.
5. Conclusion
In this study, two major bacterial pathogens were isolated and identified from the eggs of diseased tilapia: Pseudomonas aeruginosa TLV-01 and non-O1/O139 Vibrio cholerae LHV-07. Both isolates exhibited β-haemolytic activity. Infection assays confirmed their pathogenicity, with the 7-day LD₅₀ estimated at 2.0 × 10⁸ CFU/mL for TLV-01 and 2.0 × 10⁶ CFU/mL for LHV-07, whilst the LD₅₀ value derived from mixed infection assays was lower, at 2.0 × 10⁵ CFU/mL. The Loewe model showed that, within the concentration range of 1 × 10⁴–1 × 10⁷ CFU/mL, the CI value remained consistently below 1 (ranging from 0.021 to 0.662), which clearly confirmed the presence of synergy, exhibiting a trend of diminishing with increasing concentration; at the highest concentration (1 × 10⁸ CFU/mL), the CI value rose sharply to 5.018, indicating a shift towards an antagonistic effect. The Bliss model indicated that, at low to medium concentrations, mixed infection primarily exhibited an additive effect. The Loewe additive model, used to validate the results, suggested a trend towards synergy in the low to medium concentration range. Antimicrobial susceptibility testing revealed marked differences in resistance among the isolates; of the intervention measures tested, 4 mg/L chloramine-T yielded the highest hatching rate (65.2 ± 2.5%), with no deformities observed in the fry. Taken together, these findings identify two relevant bacterial hazards present during the hatching process of tilapia eggs and provide a basis for improving biosecurity in hatcheries and implementing targeted disease prevention and control measures.
Acknowledgements
This work was supported by Innovational Fund for Scientific and Technological Personnel of Hainan Province (KJRC2023B22), and Hainan University Collaborative Innovation Center Fund (XTCX2022HYB03); Aquaculture Improvement Program (AIP)-Tilapia in Hainan, grant number HD-KYH-2020155; and Hainan Baolu Aquatic Products Technology Co., Ltd. Seed Industry Breeding and Promotion Technology Services, grant number HD-KYH-2022002.
CRediT Authors’ contribution
Methodology: Xianli Ke (Equal), Ling Li (Equal), Jiawen Wang (Equal). Formal Analysis: Xianli Ke (Equal), Ling Li (Equal), Jiawen Wang (Equal). Investigation: Xianli Ke (Equal), Ling Li (Equal), Jiawen Wang (Equal). Visualization: Xianli Ke (Equal), Ling Li (Equal). Writing – original draft: Xianli Ke (Equal), Ling Li (Equal), Yan Cai (Equal). Conceptualization: Yan Cai (Equal), Shifeng Wang (Equal). Writing – review & editing: Yan Cai (Equal), Shifeng Wang (Equal). Supervision: Yan Cai (Equal), Shifeng Wang (Equal). Resources: Zhangding Zhao (Lead). Project administration: Zhangding Zhao (Equal), Shifeng Wang (Equal). Funding acquisition: Shifeng Wang (Lead).
Ethical Conduct Approval – IACUC
In this study, all experimental procedures involving animals were reviewed and approved by the Institutional Animal Care and Use Committee of Hainan University. All operations were carried out in accordance with the relevant guidelines and regulations for the breeding and use of laboratory animals in China to minimize animal pain.
Declaration of Competing Interest
The authors declare that they have no known competing financial interests or personal relationships that could have appeared to influence the work reported in this paper.
Data Availability
Data will be made available on request.