
Introduction
Largemouth bass (Micropterus salmoides) is a globally important freshwater aquaculture species, prized for its rapid growth, environmental resilience, and high-quality flesh.1–3 However, the intensification of production systems—characterized by high stocking densities, nutritional imbalances, and recurrent pathogenic stressor—has increasingly compromised growth performance, immune competence, and economic profitability.4,5 In this context, the development of safe, efficacious, and environmentally sustainable feed additives has become an urgent priority for modern aquaculture nutrition.
Phytogenic feed additives, encompassing botanical extracts, essential oils, and herbal derivatives, have garnered substantial attention as viable alternatives to antibiotic growth promoters.6,7 Their appeal lies in a multifaceted mode of action: bioactive compounds such as flavonoids, polyphenols, polysaccharides, and chlorogenic acids modulate host immunity by stimulating immunological secretions, suppressing pathogenic colonization, and fortifying antioxidant defenses.8,9 Moreover, these phytochemicals improve digestive enzyme activity and intestinal motility, thereby enhancing nutrient utilization and feed efficiency.10,11 Consequently, dietary phytogenics represent an eco-friendly strategy to optimize health and productivity in aquatic species.6,12,13
Among these candidates, Eucommia ulmoides Oliver—a traditional Chinese medicinal herb—offers a distinctive pharmacological profile rich in lignans, flavonoids, iridoid glycosides, and polysaccharides.14,15 These constituents confer potent antioxidant, anti-inflammatory, and immunomodulatory activities, alongside the capacity to promote protein synthesis and metabolic homeostasis. Empirical evidence across aquatic and terrestrial models underscores the efficacy of EUE: in Nile tilapia (Oreochromis niloticus), dietary EUE elevated lysozyme and superoxide dismutase (SOD) activity while improving intestinal integrity16; in large yellow croaker (Larimichthys crocea) larvae, it enhanced antioxidant capacity and suppressed inflammatory signaling.17 Furthermore, supplementation in Chinese soft-shelled turtle (Trionyx sinensis) and grass carp (Ctenopharyngodon idella) significantly improved weight gain and feed conversion efficiency.18,19 Despite these promising findings, the dose-response efficacy and mechanistic underpinnings of EUE in largemouth bass remain largely unexplored.
The intestine functions as the principal interface for nutrient absorption and mucosal immunity, with its physiological state intimately linked to the resident microbial ecosystem.20 Functional feed additives are increasingly recognized to exert prebiotic-like effects by reshaping gut microbiota composition, fostering beneficial symbionts, and inhibiting pathogenic colonization, thereby preserving intestinal homeostasis.21 Plant polyphenols, in particular, appear to mediate anti-inflammatory and antioxidant benefits, in part through microbiota-dependent pathways. However, systematic investigations into the effects of EUE on intestinal microbial community structure and function in largemouth bass are conspicuously lacking.
Building upon these observations, we hypothesized that graded dietary supplementation of EUE would enhance growth performance, hepatic antioxidant capacity, and intestinal morphology in largemouth bass, with concomitant modulation of gut microbiota. In conjunction with existing evidence from EUE supplementation studies in grass carp (Ctenopharyngodon idella)22 and tilapia (Oreochromis spp.),6 the present study was designed to systematically evaluate the effects of six dietary EUE levels (0‰, 0.3‰, 0.6‰, 0.9‰, 1.2‰, and 1.5‰) on growth performance, physiological-biochemical parameters, and intestinal microbial community structure. The findings are expected to provide both theoretical insights and practical guidance for the sustainable, health-oriented aquaculture of this economically valuable species.
Materials and Methods
Experimental design and grouping
The feeding trial was conducted at the Aquaculture Research Base of Xinyang Agriculture and Forestry University (Xinyang, Henan, China). Prior to the experiment, 1,600 juvenile largemouth bass (initial body weight ~ 4.5 g) were obtained and reared in four outdoor acclimation ponds (385 cm × 285 cm × 150 cm) for 66 days to adapt to the experimental feed, water quality, and environmental conditions. Following acclimation, all juvenile largemouth bass were pooled and thoroughly mixed. A total of 990 healthy individuals with uniform body weight (48.94 ± 7.79 g) were then randomly allocated to 18 rearing tanks identical to the acclimation tanks (55 fish per tank). All tanks were sun-exposed and aerated for 3 days. The ponds were randomly assigned to six dietary treatments (three replicates per treatment): a basal diet without EUE supplementation (control, Group A) or the basal diet supplemented with EUE at 0.3‰ (Group B), 0.6‰ (Group C), 0.9‰ (Group D), 1.2‰ (Group E), or 1.5‰ (Group F). The EUE (aqueous extract, 20:1 concentration ratio) was purchased from Xi’an Changyue Biotechnology Co., Ltd. The basal commercial diet (Fujian Tianma Feed Co., Ltd.) contained ≥ 48.0% crude protein, ≥ 8.0% crude fat, ≤ 6.0% crude fiber, and ≤ 16.0% crude ash. Following EUE supplementation, feeds were surface-dried prior to feeding.
Rearing management
During both the acclimation period and the 120-day feeding trial, fish were fed twice daily (08:00 and 18:00) at fixed feeding stations using a multiple small-portion strategy to ensure prompt consumption and minimize feed wastage. Specifically, a small amount of feed was offered at each feeding bout, and the next portion was provided only after the previous batch had been completely consumed; this process was repeated until the fish ceased feeding. Daily rations were adjusted based on weather conditions, water temperature, and feeding behavior, with feed intake recorded after each meal. Water was renewed regularly by replacing approximately one-quarter of the bottom volume per exchange; the frequency was lower initially and progressively increased to maintain optimal water quality. Throughout the rearing period, water pH remained stable at 7.5–8.2, and dissolved oxygen concentration was maintained above 6 mg/L.
Sample collection and processing
At the end of the feeding trial, fish were fasted for 24 h. Nine fish per pond were randomly sampled and anesthetized with eugenol for subsequent processing. Morphometric parameters (body length, body depth, and body weight) were recorded using vernier calipers and measuring boards. Blood was drawn from the caudal vein using a 1-mL syringe pre-rinsed with anticoagulant, transferred to 1.5-mL centrifuge tubes, allowed to clot at room temperature for 2 h, and then centrifuged at 3,000 rpm for 15 min at 4℃. Serum was harvested and stored at -80℃ until analysis. Fish were subsequently dissected to record viscera and hepatopancreas weights.
For histological analysis, one fish of medium body weight per replicate was selected (based on preliminary experiments indicating minimal inter-individual variation within replicates). Approximately 1 g of liver tissue and 0.5–1 cm of mid-intestine were excised and fixed in 4% paraformaldehyde. For microbiota and molecular analyses, an additional three fish per replicate were sampled; 2-cm segments of mid-intestine from each fish were pooled into a single composite sample, yielding 18 intestinal samples total. These were immediately snap-frozen in liquid nitrogen and stored at -80℃ pending analysis.
Antioxidant capacity determination
Liver samples were accurately weighed and homogenized in 1:9 (w/v) of ice-cold physiological saline (0.9%) using a mechanical homogenizer in an ice bath to yield 10% (w/v) homogenates. The homogenates were centrifuged at 2,500–3,000 rpm for 10 min, and the supernatants were collected for enzymatic analysis. Hepatic antioxidant parameters–catalase (CAT), superoxide dismutase (SOD), glutathione peroxidase (GSH-Px) activities, and total antioxidant capacity (T-AOC)–were determined using commercial assay kits (Nanjing Jiancheng Bioengineering Institute, Nanjing, China) according to the manufacturer’s instructions. All assays were performed in triplicate.
Serum biochemical indices analysis
Serum biochemical parameters, including high-density lipoprotein (HDL), triglycerides (TG), total cholesterol (CHO), glucose (GLU), total protein (TP), albumin (ALB), and alkaline phosphatase (ALP), were measured using an automatic biochemical analyzer (BK-400, Shandong Boke Biological Industry Co., Ltd., China) with commercial reagent kits, following the manufacturer’s instructions for animal serum analysis.
Hepatopancreas and intestinal morphology
All tissue samples were fixed in Bouin’s solution for 24 h, then trimmed, dehydrated, and embedded in paraffin according to standard histological procedures. Sections were cut at 4 μm and stained with hematoxylin and eosin (H&E). Stained sections were examined and photographed under an optical microscope (Eclipse Ci-L, Nikon, Japan).
For intestinal morphometry, target areas were examined at 40× and 100× magnifications. Image-Pro Plus 6.0 software (Media Cybernetics, USA) was used for image analysis. At 40×, five complete villi per section were measured for height and width, and mean values were calculated. Villus density was determined as the number of villi per unit mucosal area in two fields of view (villus density = villus number / mucosal area). At 100×, goblet cells were counted in two fields of view and normalized to the corresponding villus epithelial length (goblet cells per unit length = total goblet cell number / epithelial length).
DNA extraction, amplification, and sequencing
Intestinal DNA was extracted following the protocol of Tang et al.23 Briefly, tissue samples were lysed with CTAB buffer and lysozyme, and DNA was purified using the 3S Column Centrifugal Environmental Sample DNA Recovery Kit (Shanghai Bocai Biotechnology Co., Ltd., Model V2.2). The quality of the extracted DNA was verified by 1% agarose gel electrophoresis. The V3-V4 hypervariable region of the bacterial 16S rRNA gene was amplified using primers 338F (5’-ACTCCTACGGGAGGCAGCAG-3’) and 806R (5’-GGACTACHVGGGTWTCTAAT-3’). PCR products were sequenced on an Illumina platform by Shanghai Yuanxin Biomedical Technology Co., Ltd.
Bioinformatics analyses
Illumina PE250 paired-end reads were demultiplexed, quality-filtered, and merged. Operational taxonomic units (OTUs) were clustered at 97% sequence similarity, followed by taxonomic classification. Alpha-diversity indices (Shannon, Simpson, ACE, and Chao) and sequencing depth were calculated using Mothur (v.1.41.0). Community structure and taxonomic composition were analyzed at multiple levels using R (v.3.4.4), and principal coordinate analysis (PCoA) was conducted using R (v.3.6.3). Functional gene profiles were inferred from 16S rRNA data using PICRUSt.
Statistical analysis
Statistical analyses were performed using SPSS 19.0 (IBM Corp., Armonk, NY, USA). Data were analyzed by one-way ANOVA followed by Duncan’s multiple range test. Statistical significance was set at P < 0.05. Results are expressed as mean ± standard deviation (SD).
Results
Growth performance
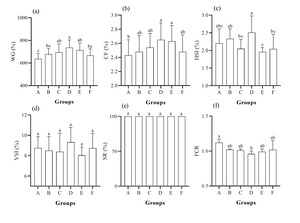
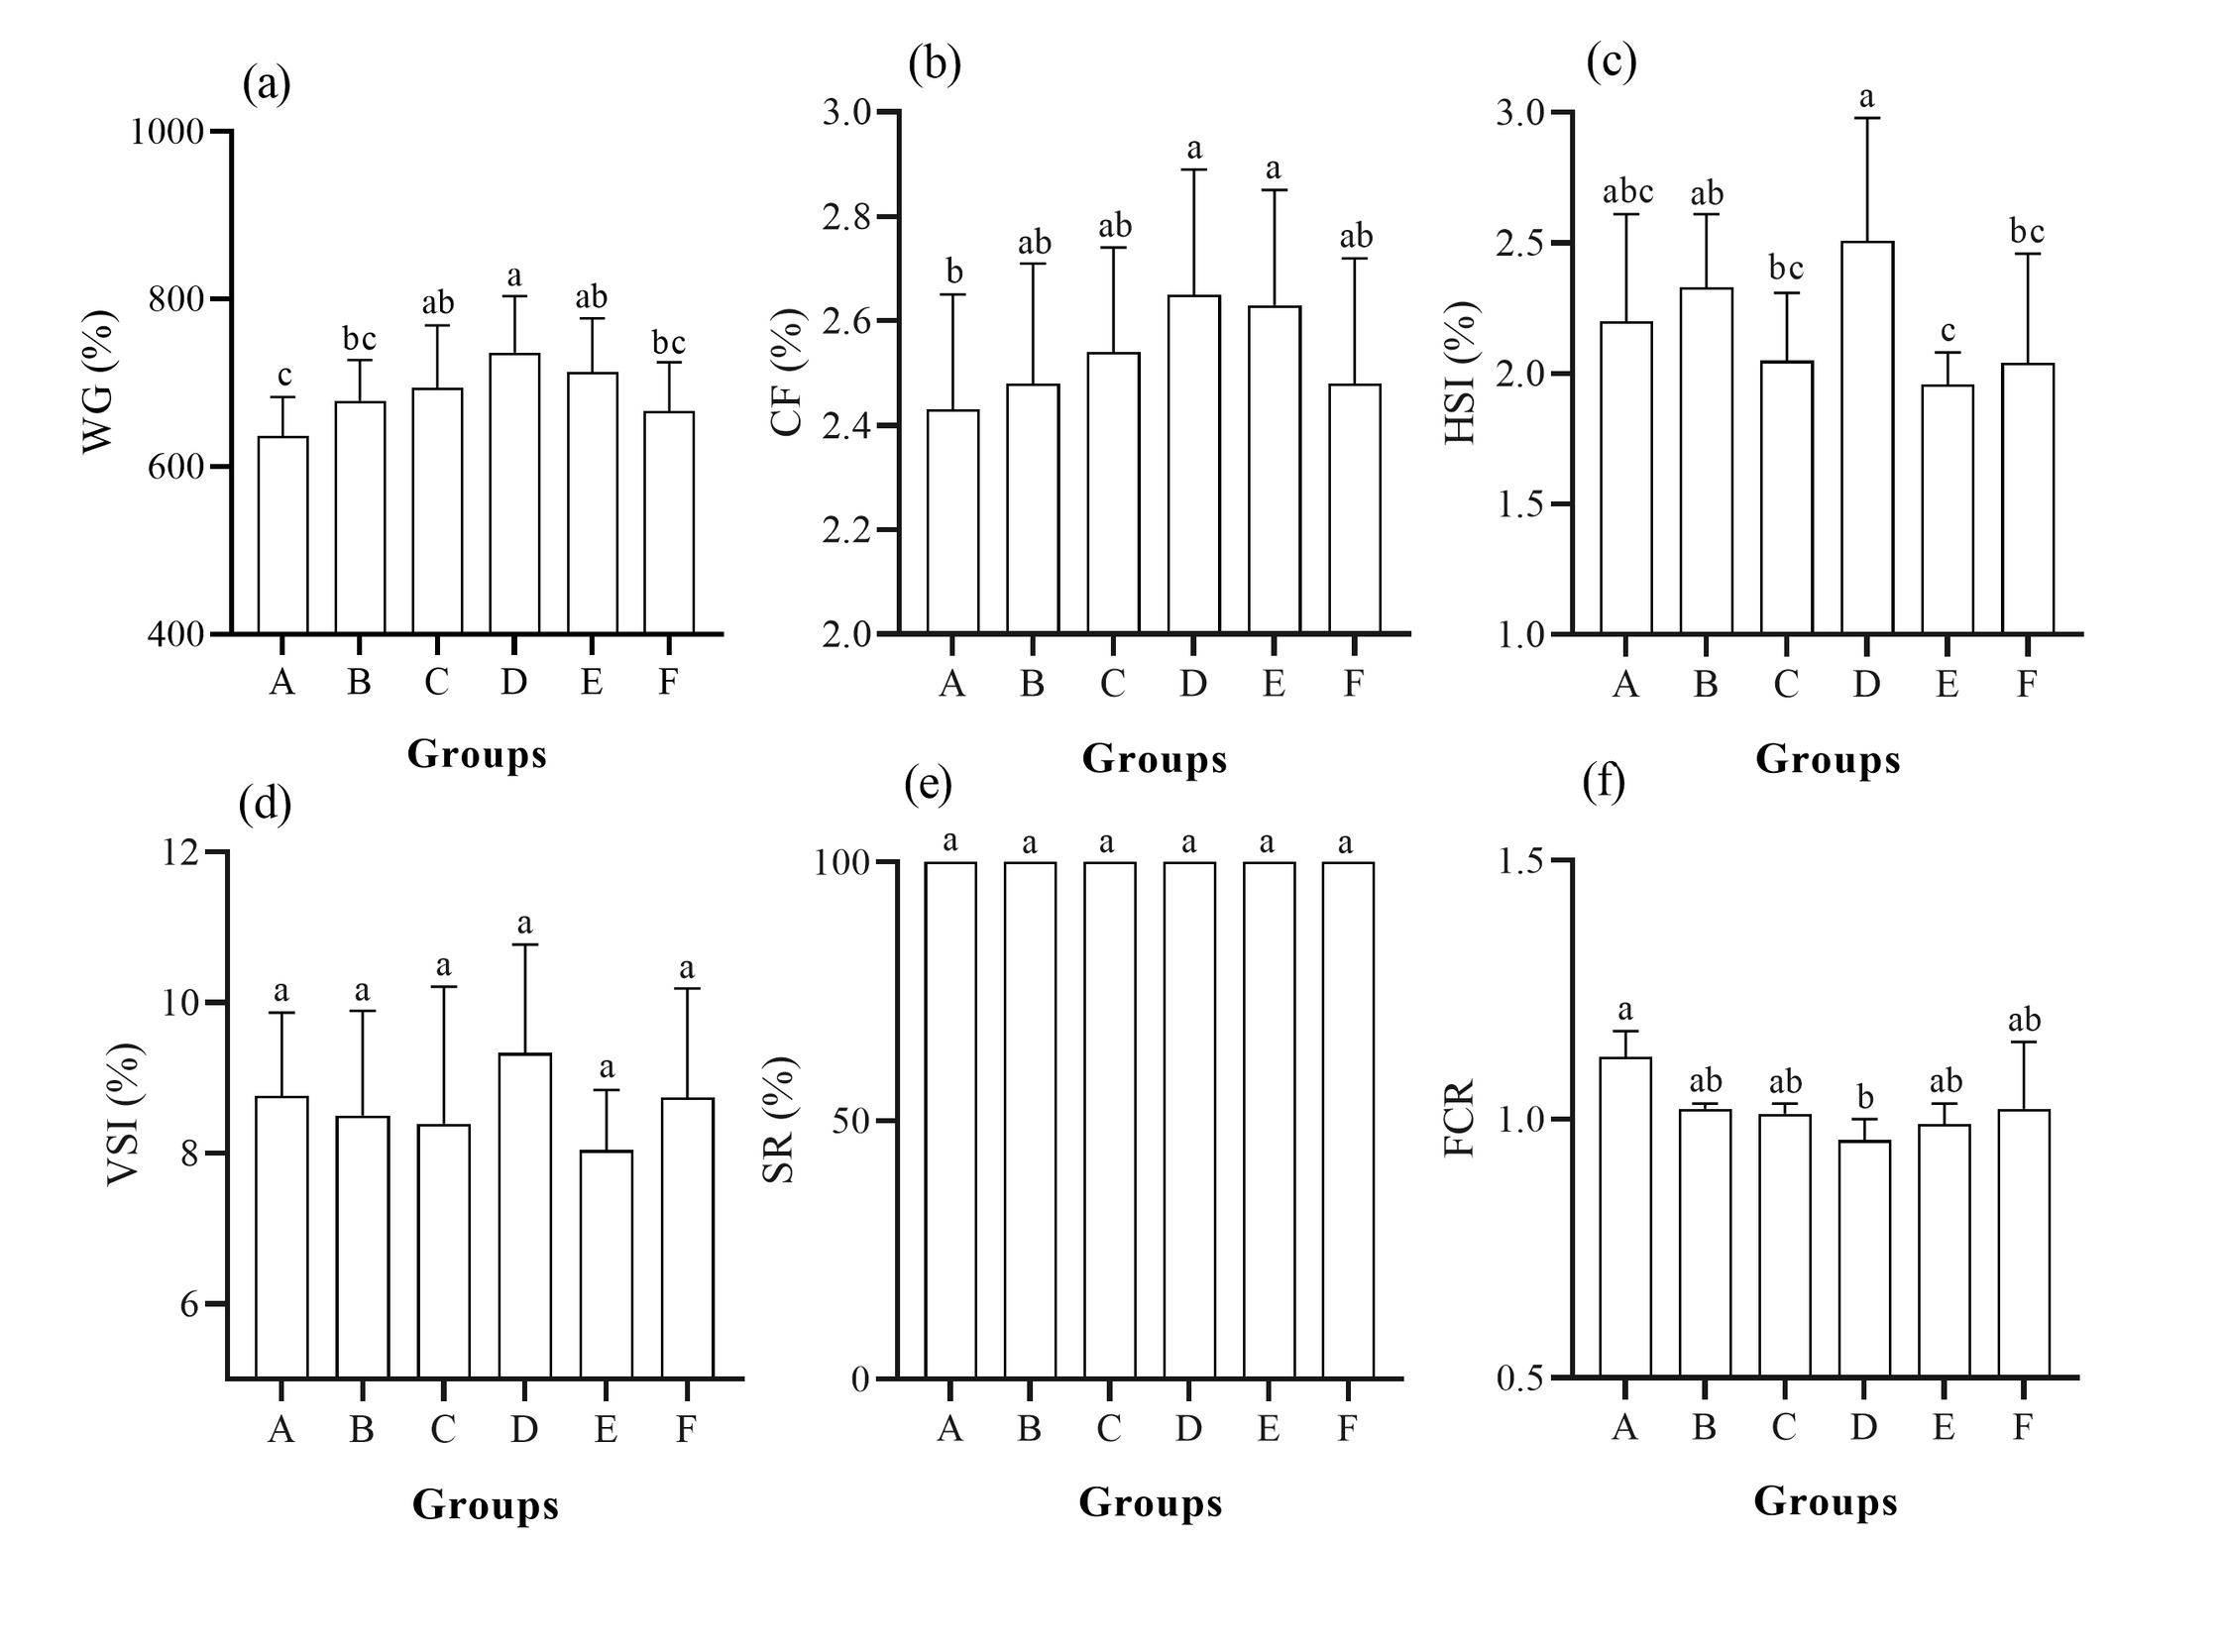
Following 120 days of intensive rearing management, Group D (0.9‰ EUE) achieved optimal growth performance, exhibiting significantly higher weight gain, the lowest feed conversion ratio (FCR), and elevated condition factor relative to the control (P < 0.05), alongside the highest hepatosomatic index (P < 0.05 vs. Groups E and F; comparable to the control) (Figure 1). Groups C and E also showed significantly improved weight gain compared with the control (P < 0.05), whereas Groups B and F did not differ significantly from the control in these metrics (P > 0.05), despite numerically lower FCR values. Viscerosomatic index and survival rate showed no significant differences among treatments (P > 0.05).
Hepatic enzyme activity and histology
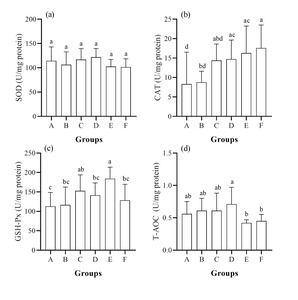
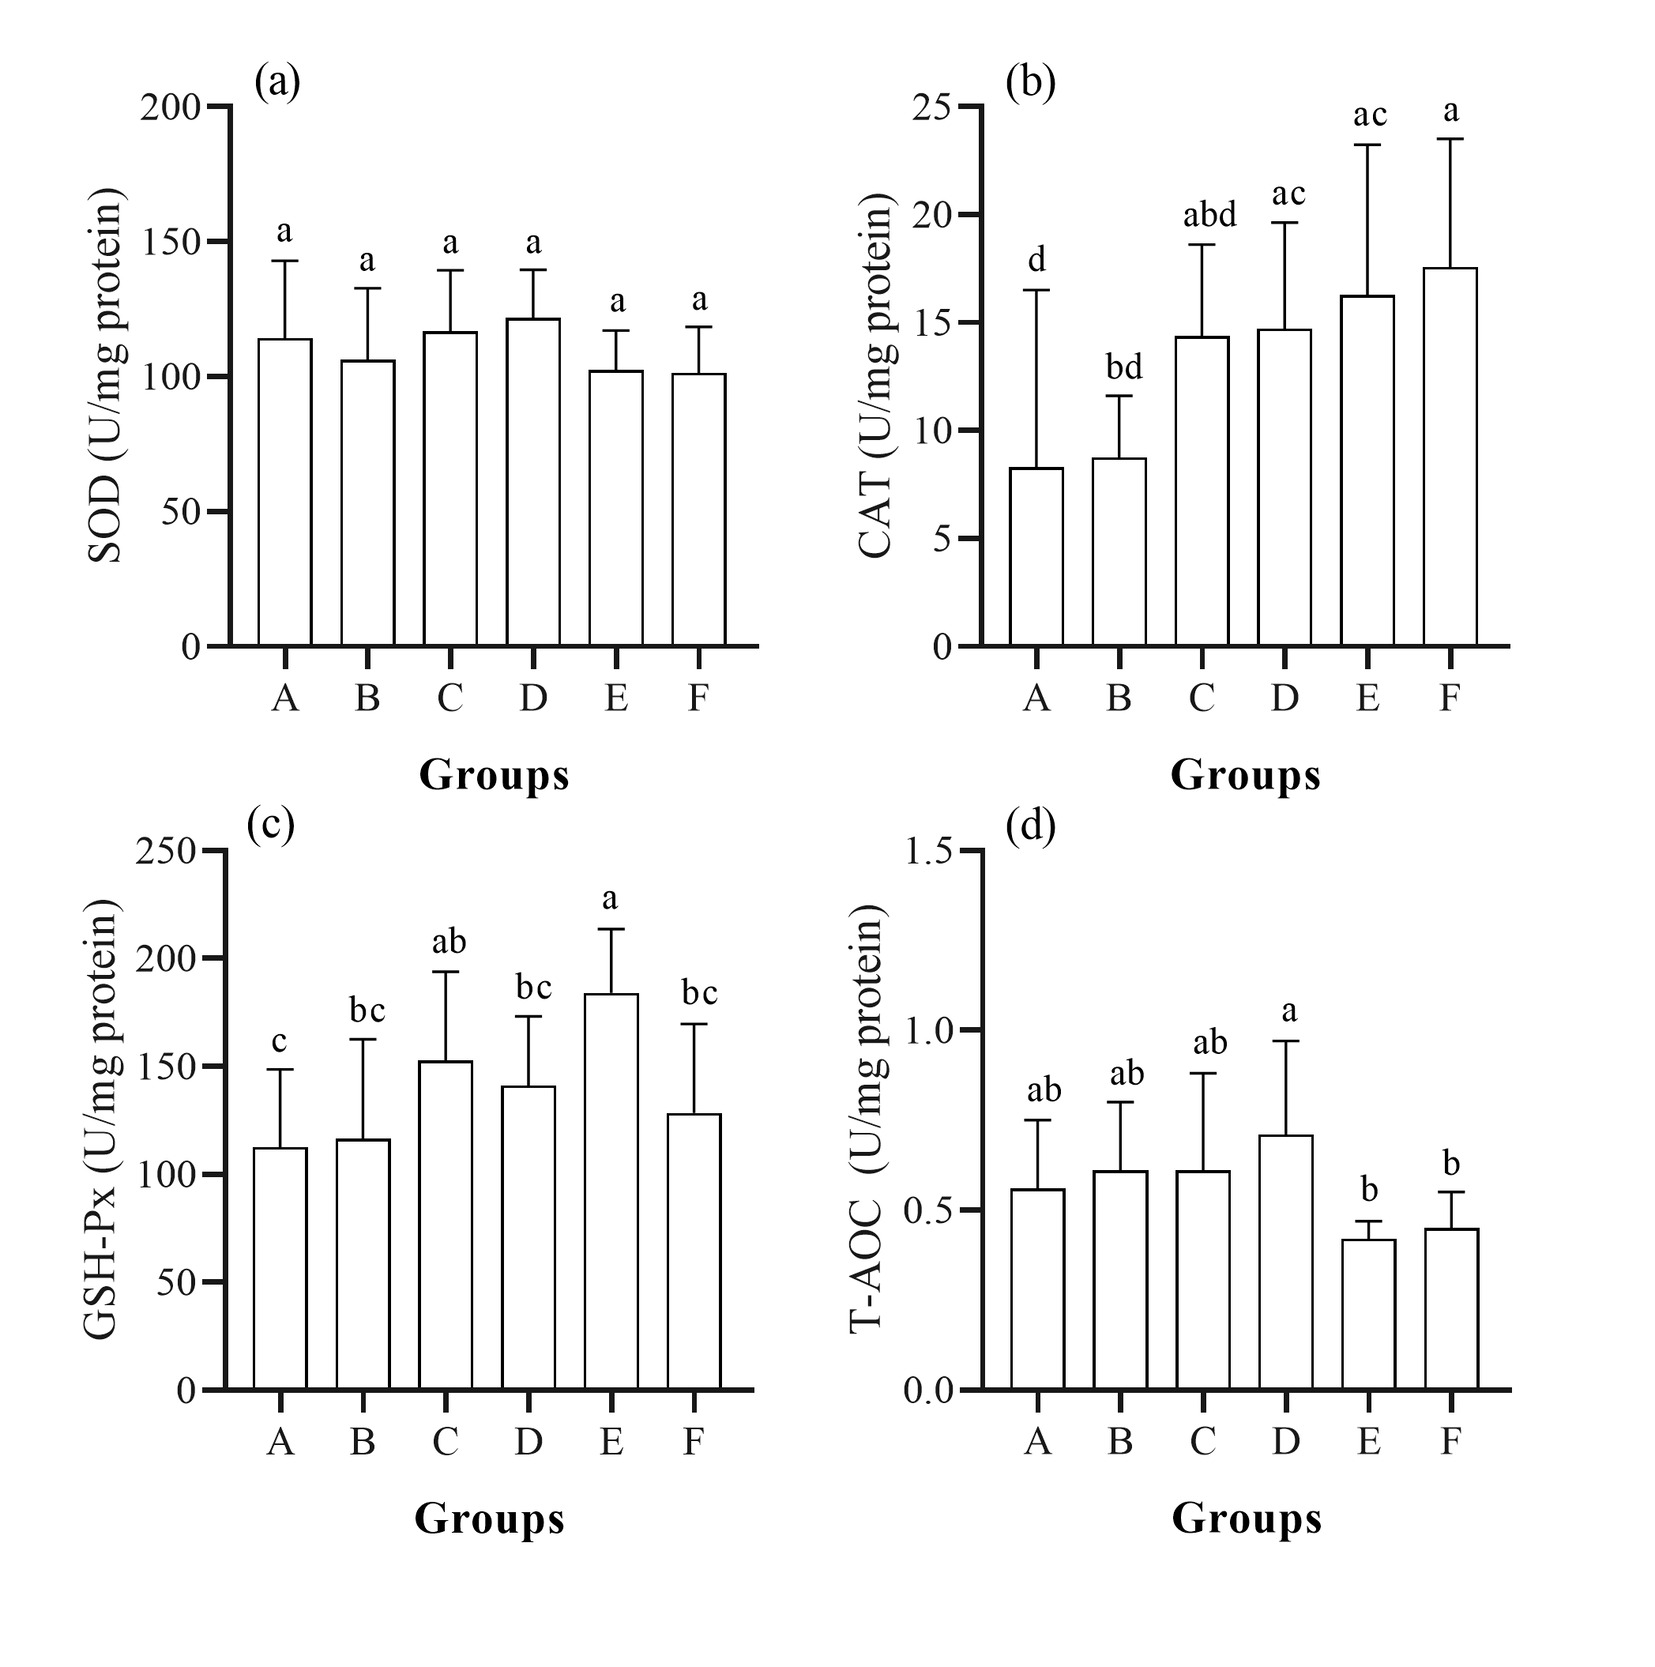
SOD activity was numerically highest in Group D, yet no significant differences were detected among groups (P > 0.05). By contrast, CAT, GSH-Px, and T-AOC varied significantly (P < 0.05). CAT peaked in Group F, with Groups E, D, and C also significantly exceeding the control; only Group B remained comparable to the control. GSH-Px was maximal in Group E, followed by Group C (both > control, P < 0.05), whereas Group D was intermediate and statistically comparable to the control. T-AOC (0.42–0.71 U/mg protein) was highest in Group D, significantly surpassing Groups E and F (P < 0.05); Groups B and C were intermediate, comparable to Group D yet significantly higher than Groups E and F (Figure 2).
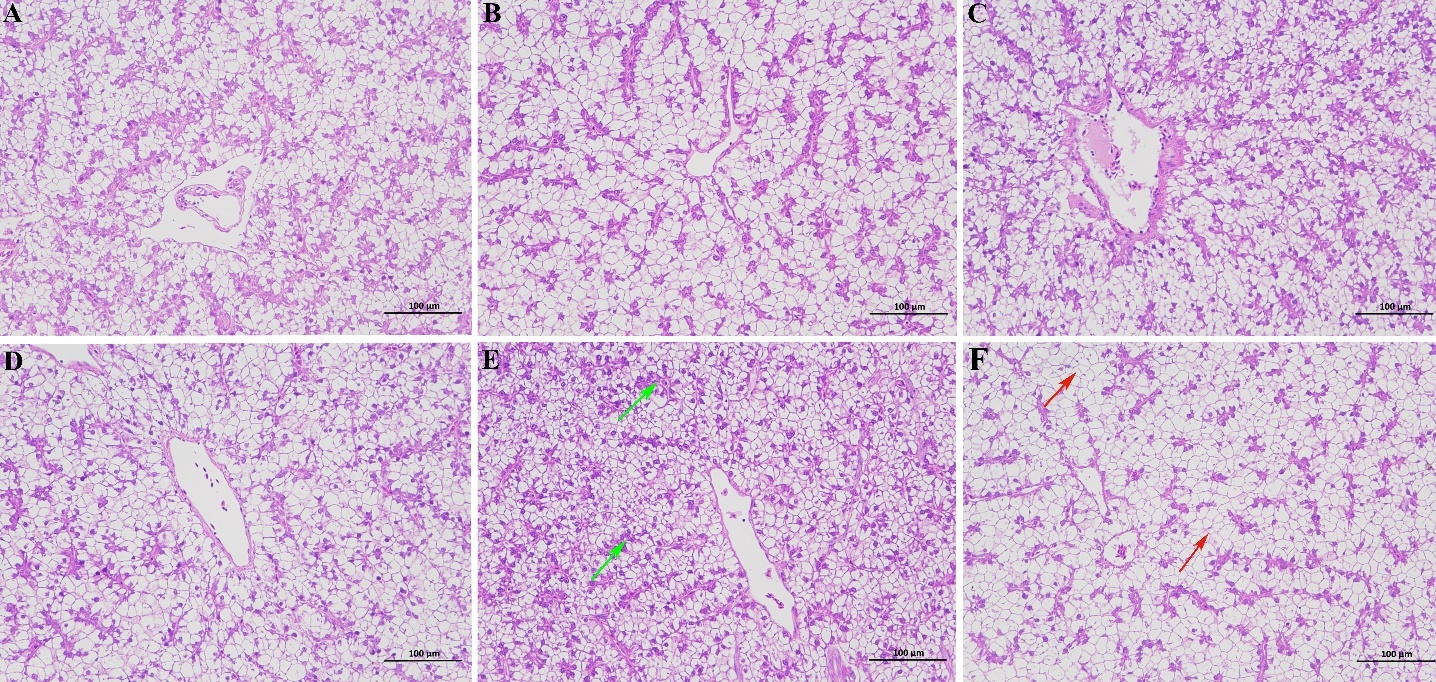
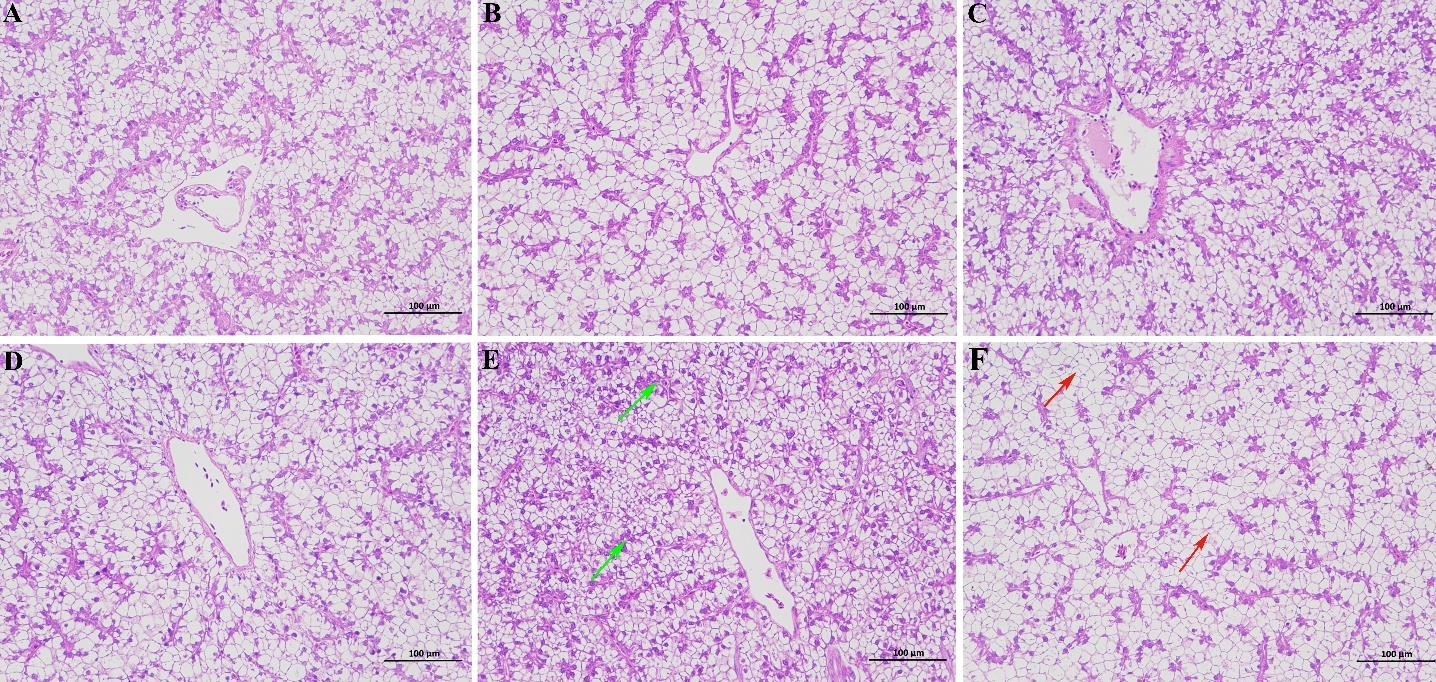
Representative hepatic sections are presented in Figure 3. The control liver exhibited normal lobular architecture with polygonal hepatocytes arranged in regular cords, central round nuclei, homogeneous cytoplasm, and only minor lipid vacuoles. Group B was histologically comparable, with occasional small lipid droplets. Group C displayed more compact cords, deeper cytoplasmic staining, and fewer lipid vacuoles than the control. Group D showed the most compact and well-organized lobular structure, featuring uniform hepatocyte size, normal nuclear-to-cytoplasmic ratio, deeply stained homogeneous cytoplasm, and complete absence of vacuolization or lesions. In contrast, Groups E and F demonstrated progressive hepatocyte vacuolization, nuclear displacement, lobular disorganization, irregular cord arrangement, and moderate clear vacuoles.
Serum biochemical indicators
Serum biochemical profiles are summarized in Table 1 Group D displayed the most favorable metabolic status, with the highest HDL (3.18–4.04 mmol/L), cholesterol (9.27–12.07 mmol/L), and total protein concentrations, all significantly exceeding the control (P < 0.05); cholesterol in Groups B and C was intermediate and comparable to Group D, whereas Group F was lowest. Triglycerides (12.66–17.25 mmol/L) peaked in Group B and were lowest in Group E, with both Groups B and D significantly higher than E (P < 0.05). Blood glucose varied significantly (P < 0.05): Group B was highest, Group E was intermediate and significantly higher than Groups C and F, and Group F was lowest and significantly below both B and E (P < 0.05). Total protein in the control was significantly lower than in Groups B, C, and D (P < 0.05). Albumin (13.04–14.50 g/L) did not differ significantly among groups (P > 0.05), though Groups E and F were numerically elevated. ALP activity was maximal in Group C, followed by Group B, both significantly exceeding the minimum value in Group E (P < 0.05); the control, Group D, and Group F were intermediate.
Intestinal tissue structure
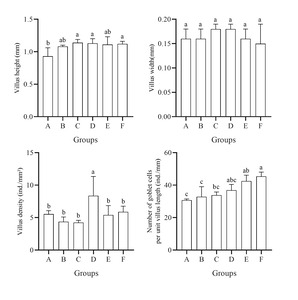
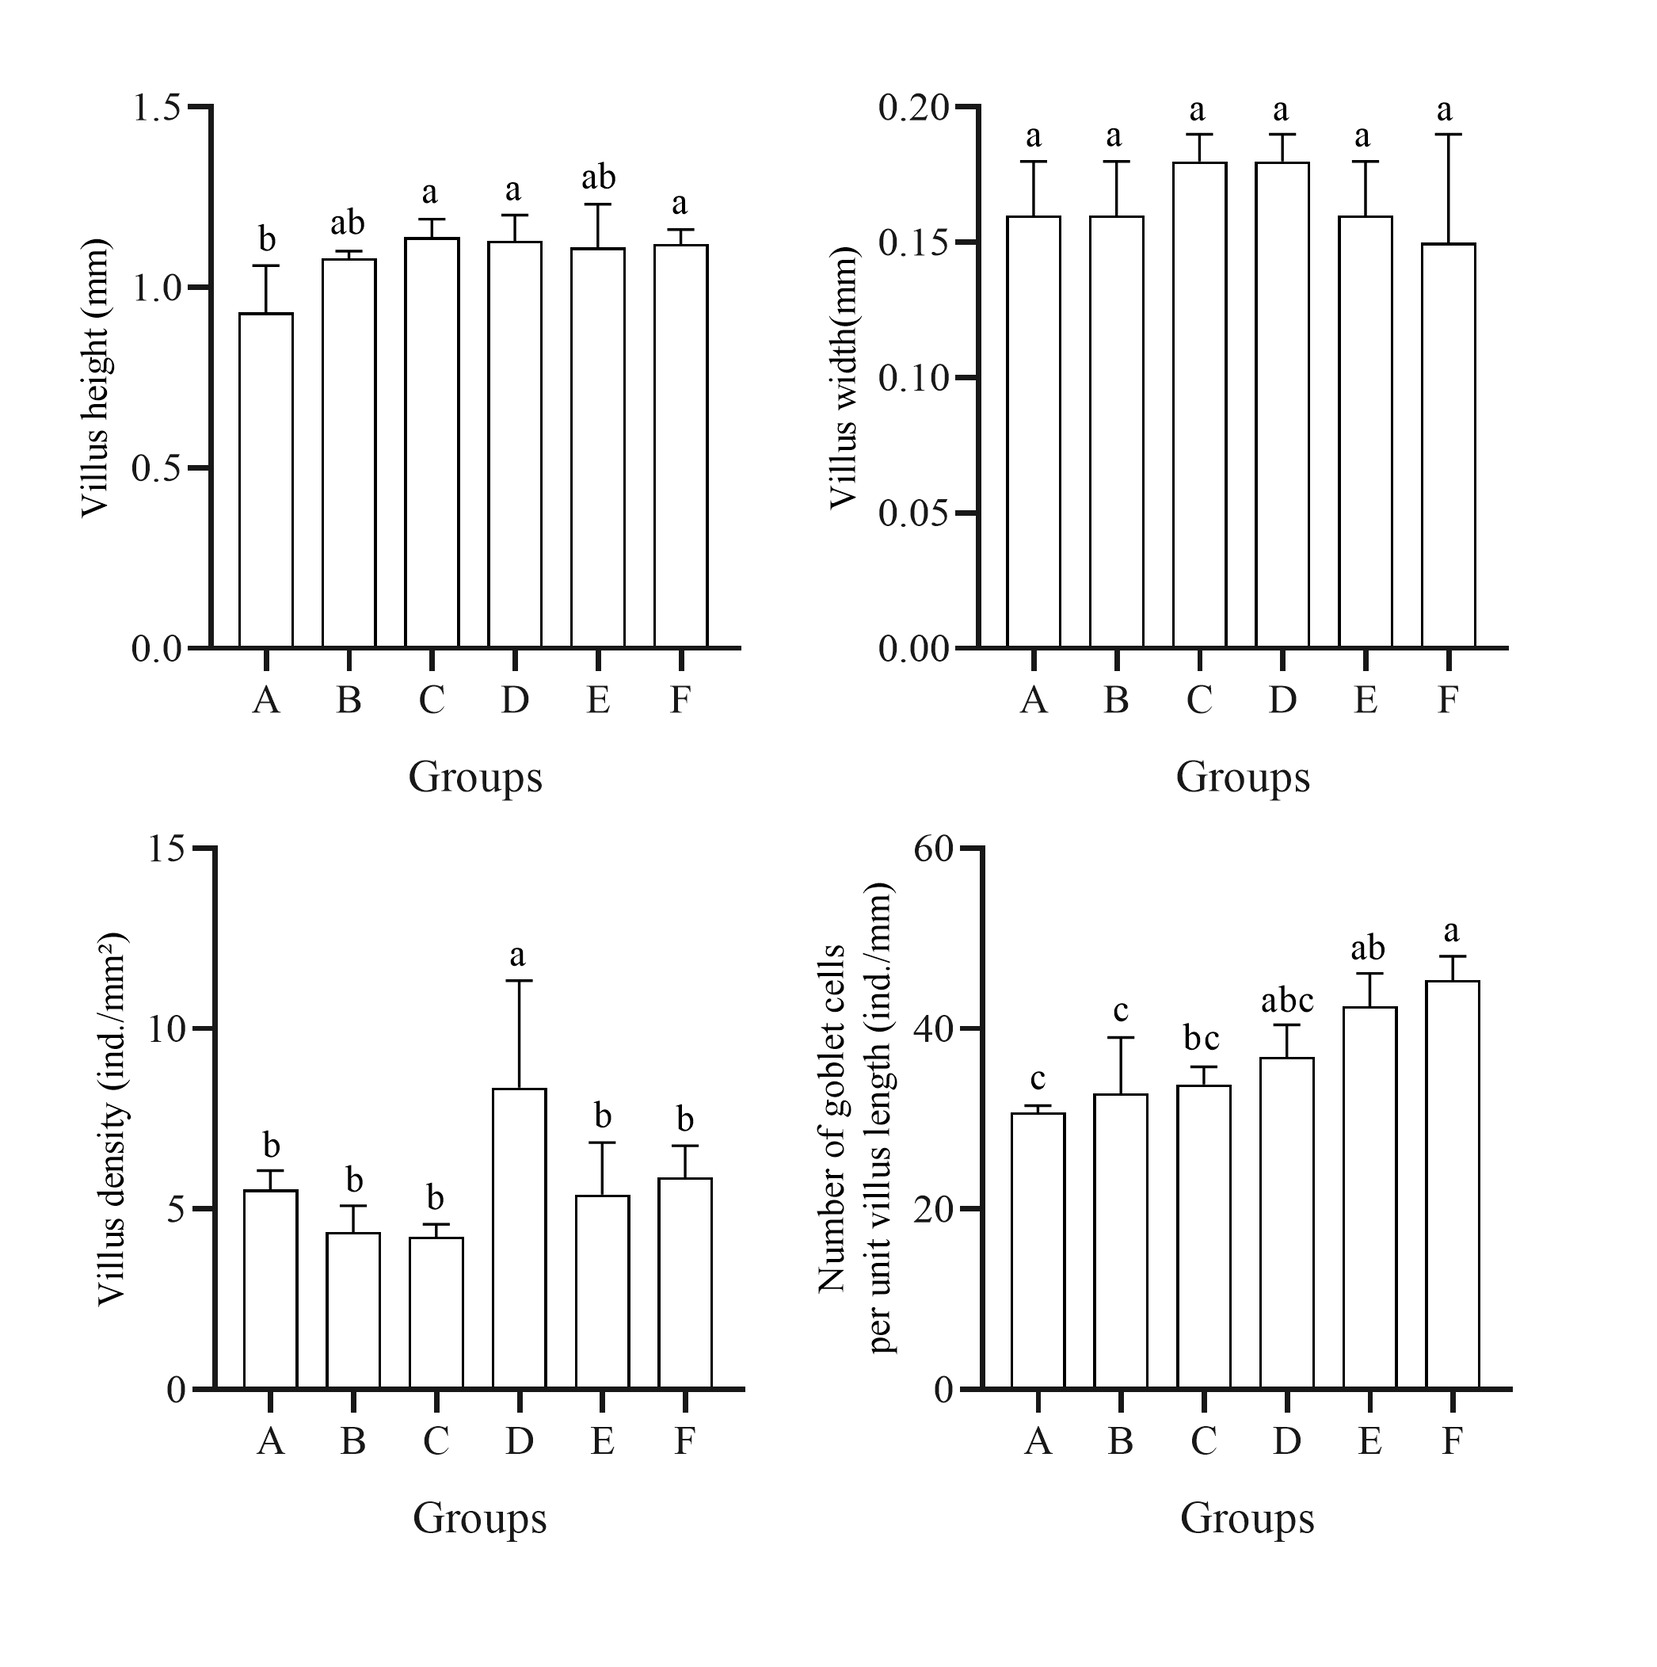
Intestinal morphometric data are presented in Figure 4. Villus height ranged from 0.93 to 1.14 mm; Groups C, D, E, and F all showed elevated, statistically comparable heights that significantly exceeded the control (P < 0.05), whereas Group B was intermediate. Villus width (0.15–0.18 mm) did not differ significantly among groups (P > 0.05), though Groups C and D were marginally wider. Villus density peaked in Group D, significantly surpassing all other groups (P < 0.05); the control and Group F were intermediate, while Groups B, C, and E were lowest and comparable. Goblet cell counts rose markedly with higher EUE supplementation: Group F was highest, significantly exceeding all other groups (P < 0.05); Group E was second, significantly higher than Groups A–C (P < 0.05); Group D was intermediate; the control was lowest and significantly below Groups F and E (P < 0.05).
Analysis of intestinal microbial community
Microbial diversity analysis
Coverage indices were 0.999 for all groups, confirming sufficient sequencing depth and reliable community representation (Table 2). Richness (ACE and Chao) and diversity (Shannon and Simpson) indices were calculated from OTU data. Shannon diversity peaked in Group B, significantly exceeding all other groups (P < 0.05), followed by Group E, which was significantly higher than the control, Group D, and Group F (P < 0.05); the control had the lowest Shannon value, comparable to Groups D and F. Notably, the Simpson index displayed the inverse pattern. For richness, Group B exhibited the highest ACE and Chao values, with ACE being significantly higher than all other groups (P < 0.05) and Chao significantly exceeding the control, Group D, and Group F (P < 0.05). Group C ranked second for both ACE and Chao indices. However, its ACE value did not differ significantly from any other group except Group B (P > 0.05). For Chao, Group C was significantly higher than the control, Group D, and Group F (P < 0.05), while remaining comparable to Group B and Group E. Groups E and F exhibited intermediate richness, whereas Group D and the control shared the lowest richness.
Intestinal microbial composition
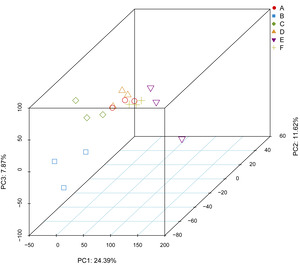
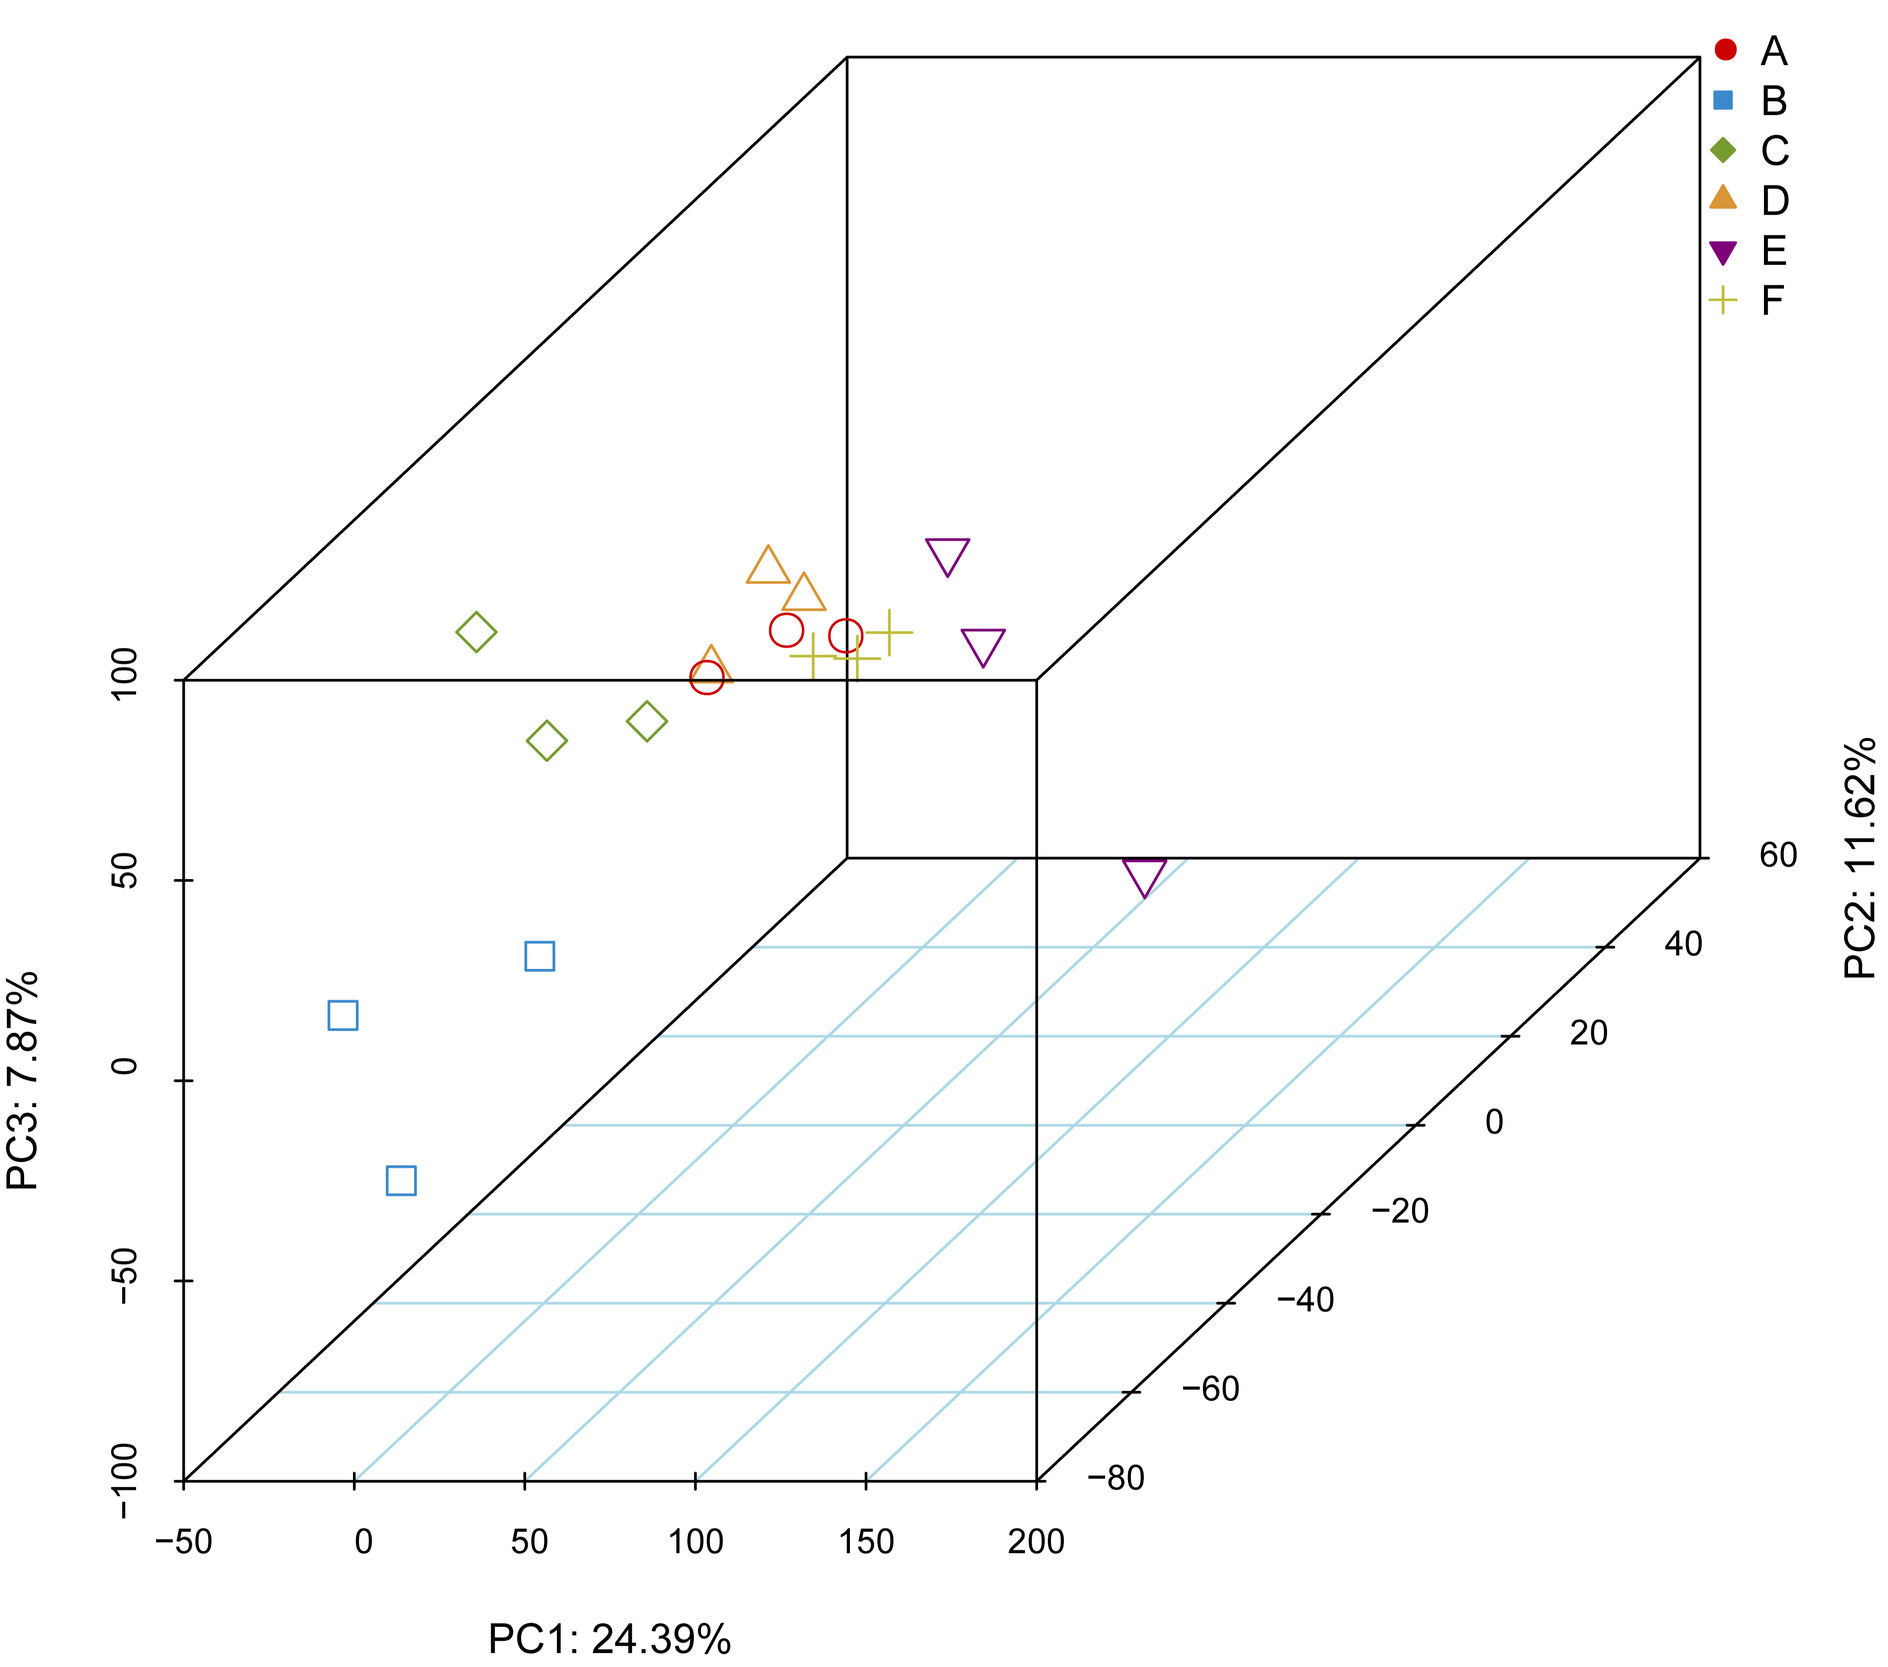
PCoA based on microbial composition revealed distinct clustering of replicates within each group (Figure 5), reflecting diet-specific assemblages shaped by EUE supplementation. The first three principal coordinates (PC1, PC2, and PC3) explained 24.39%, 11.62%, and 7.87% of the total variation, respectively.
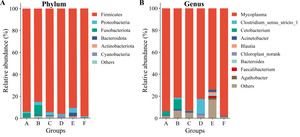
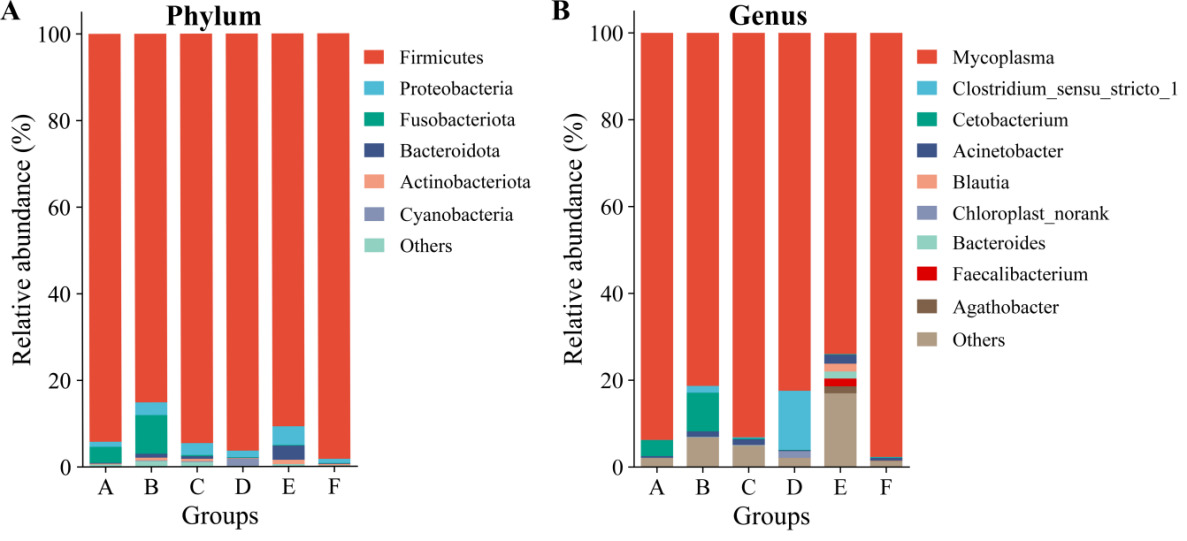
In this experiment, microbial taxa detected across all samples belonged to 29 phyla and 625 genera. At the phylum level, Firmicutes dominated all groups (85.11%–98.25%), with the highest abundance in Group F (98.25%) and relatively lower levels in Groups B (85.11%) and E (90.71%) (Figure 6A). Proteobacteria ranged from 0.97% to 4.31%, peaking in Group E (4.31%), whereas Fusobacteriota was most abundant in Group B (8.93%) and the control (3.70%). At the genus level, Mycoplasma was overwhelmingly predominant across all groups (73.96%–97.67%) (Figure 6B), reaching its maximum in Group F (97.67%) and minimum in Group E (73.96%). Notably, Clostridium_sensu_stricto_1 was markedly enriched in Group D (13.61%) compared with trace levels (< 0.1%) in the control and Groups E and F. Cetobacterium abundance was highest in Group B (8.91%), significantly higher than the control and all other groups (P < 0.05), followed by the control (3.70%). Acinetobacter was most prevalent in Group E (2.05%) and lowest in Group D (0.19%).
Predicted functional profiles at KEGG level 2 pathways showed no significant differences among groups (P > 0.05; Table 3).
Discussion
The present study establishes that dietary supplementation with EUE at 0.9‰ is an optimal dosage for largemouth bass, maximizing weight gain and minimizing feed conversion ratio (FCR). This finding aligns with the broader efficacy of EUE and chlorogenic acid-rich phytogenics in improving growth and feed efficiency across aquaculture species.19 Notably, the hepatosomatic index (HSI) in the 0.9‰ group remained at a relatively high level (comparable to the control but significantly higher than the high-dose groups), with no significant change in viscerosomatic index (VSI). Combined with the highest serum total protein and cholesterol concentrations observed in this group, these results suggest that the growth advantage stems from enhanced hepatic anabolic metabolism and protein deposition rather than visceral fat accumulation. Admittedly, for aquaculture products, growth performance is not the only consideration; the nutritional composition and flesh quality of fish are also critical parameters. We will conduct more in-depth research on these aspects in the future.
Crucially, our data reveal a biphasic, hormesis-like dose-response: moderate EUE levels (0.6‰–0.9‰) exert growth-promoting effects, whereas the 0.3‰ level showed no significant growth-promoting effect, and concentrations ≥1.2‰ fail to confer additional benefits and instead induce pathological signatures (hepatocyte vacuolation and intestinal goblet cell hyperplasia). This pattern mirrors the dose-dependent toxicity of polyphenolic extracts reported in grass carp, in which moderate doses improve growth, whereas excessive intake triggers oxidative injury and hepatic inflammation.24 The absence of mortality across treatments indicates that EUE is not acutely toxic; rather, high doses induce sublethal metabolic stress that compromises growth efficiency. For largemouth bass aquaculture, these findings delineate a clear therapeutic window, with 0.9‰ as the upper limit of efficacy before dose-dependent adverse effects.
The liver serves as the central hub, integrating nutrient metabolism, detoxification,25 and antioxidant defense.26–28 Histologically, 0.9‰ EUE preserved the most compact lobular architecture with minimal lipid vacuolization, whereas doses ≥ 1.2‰ precipitated progressive vacuolation and nuclear displacement—hallmarks of hepatocellular stress and impaired lipid metabolism. These morphological observations were consistent with the T-AOC profile, which peaked at 0.9‰ and declined at higher doses, linking structural integrity to systemic antioxidant capacity. Admittedly, the optimal concentration of 0.9‰ was determined based on the tissue and physiological status of largemouth bass at the termination of the rearing period, representing a cross-sectional assessment. To elucidate the dynamic trajectories of these parameters, intensive time-course sampling would be required.
Although superoxide dismutase (SOD) remained stable across treatments—suggesting that the basal superoxide anion scavenging capacity was not rate-limiting—catalase (CAT) and glutathione peroxidase (GSH-Px) displayed divergent, dose-dependent patterns. The highest CAT activity in Group F (1.5‰) and elevated GSH-Px in Group E (1.2‰) indicate a compensatory upregulation of individual antioxidant pathways under high-dose challenge. However, total antioxidant capacity (T-AOC) was paradoxically lowest in these same high-dose groups. This disconnect between individual enzyme activities and systemic antioxidant reserve suggests that excessive EUE polyphenols may act as pro-oxidants at high concentrations, depleting non-enzymatic antioxidant pools (e.g., glutathione, vitamins) and triggering compensatory enzyme synthesis without restoring overall redox homeostasis.29,30 By contrast, 0.9‰ EUE achieved the highest T-AOC alongside robust CAT activity and intermediate GSH-Px, reflecting a CAT-dominated, integrated antioxidant strategy, rather than the fragmented, compensatory enzyme upregulation observed in the high-dose groups. Thus, hepatic health is not merely a function of single enzyme induction but depends on the integrated redox balance, which peaks at 0.9‰.
Serum biochemistry provides a systems-level snapshot of metabolic health.31 The 0.9‰ group exhibited a distinctive metabolic signature characterized by elevated high-density lipoprotein (HDL), total protein (TP), and cholesterol, along with moderate triglyceride levels and stable glucose. We interpret this as a “high-flux, high-clearance” phenotype: enhanced HDL indicates robust reverse cholesterol transport and hepatic lipid clearance32; elevated TP reflects vigorous protein anabolism and favorable nutritional status; and the moderate triglyceride level indicates that lipid homeostasis was maintained—providing sufficient lipid substrates for growth while avoiding abnormal hepatic lipid accumulation, which is consistent with the histological observations.
In contrast, the control group exhibited lower HDL and TP levels, suggesting suboptimal lipid clearance and protein synthesis capacity under the standard commercial diet. Hyperglycemia was observed in both Group B (0.3‰) and Group E (1.2‰), but the patterns differed between the two groups: in Group B, hyperglycemia was not accompanied by other metabolic abnormalities, possibly reflecting a mild metabolic fluctuation at the low dose; whereas in Group E, it may be associated with high-dose-induced glucoregulatory disruption. Notably, Group F (1.5‰) restored normoglycemia; however, its histological and antioxidant parameters indicated that this dose had already induced subclinical damage, suggesting that the normal blood glucose level might represent a compensatory homeostatic adjustment rather than a sign of overall metabolic health. Collectively, these data position 0.9‰ EUE as the only dose that simultaneously optimizes protein anabolism, lipid clearance, and glycemic stability, underscoring its superiority in metabolic health.
Intestinal morphology directly dictates nutrient absorption efficiency,33,34 and villus height is considered a key indicator of the intestinal absorption surface area.35,36 Our results demonstrate that villus height alone is an incomplete predictor of absorptive capacity: Group C (0.6‰) achieved the greatest villus height but the lowest villus density, resulting in a “tall-and-sparse” configuration with comparatively lower surface area. In contrast, Group D (0.9‰), while maintaining a relatively high villus height (statistically comparable to Group C), achieved the highest villus density, forming a unique “tall-and-dense” architecture that maximizes the effective absorptive surface area—which likely underpins the superior weight gain and FCR observed at this dose.
The goblet cell data add a layer of physiological nuance. While moderate EUE supplementation (0.9‰) maintained goblet cell counts at intermediate levels, high doses (1.2‰ and 1.5‰) induced significant hyperplasia. Goblet cell proliferation can be interpreted dichotomously: it may represent reinforcement of the mucus barrier against luminal irritants, or conversely, it may signal chronic mucosal irritation and compensatory mucin secretion.37 Given the concurrent hepatocellular vacuolation and the absence of pathogen challenge in our study, the hyperplasia at ≥ 1.2‰ likely reflects a subclinical irritant response to excessive phytochemical load, rather than protective adaptation. Thus, 0.9‰ EUE optimizes intestinal absorptive geometry without triggering mucosal overstimulation.
A prevailing assumption in gut microbiome research equates higher diversity with better health. Our data challenge the universal applicability of this axiom in the context of intensive aquaculture. Group B (0.3‰) exhibited the highest Shannon, ACE, and Chao indices, yet its growth performance was indistinguishable from the control. Conversely, Group D (0.9‰)—which exhibited Shannon diversity at the lowest level comparable to the control, and ACE and Chao richness among the lowest—achieved the best growth and metabolic outcomes. This paradox suggests that in the simplified microbial ecosystem of concrete-pond-reared largemouth bass, ecosystem function is driven by functionally dominant taxa rather than by taxonomic richness per se. However, whether the above patterns still hold true in traditional earthen pond aquaculture systems remains to be further verified.
The absolute dominance of Mycoplasma (73.96%–97.67%) across all groups is striking. While Mycoplasma is frequently associated with pathogenicity in fish,38–40 its ubiquity in our healthy, disease-free cohort—coupled with its negative correlation with known pathogens in salmonids41—suggests that it may act as a commensal rather than a pathogen under these conditions, possibly adapted to the high-feeding, rapid-growth aquaculture environment. Nevertheless, this remains speculative, and species-level identification is required to confirm whether it is a commensal or a pathogen. The low microbial diversity and Firmicutes dominance (85%–98%) likely reflect the environmental filtering of concrete ponds devoid of sediment, a constraint that narrows the colonization pool but does not necessarily compromise host performance if the remaining taxa are functionally competent.
The most consequential microbial finding is the marked enrichment of Clostridium_sensu_stricto_1 in Group D (13.61%), concomitant with trace abundance in other groups. This genus is increasingly recognized as a keystone taxon in vertebrate guts, possessing specialized pathways for bile acid modification and for short-chain fatty acid (SCFA; primarily butyrate and propionate) metabolism.42 Therefore, we propose a mechanistic cascade linking this microbial shift to host phenotype: EUE polyphenols (0.9‰) → selective enrichment of Clostridium_sensu_stricto_1 → enhanced bile acid biotransformation and SCFA (butyrate/propionate) production → improved lipid emulsification and energy harvest → elevated HDL/TP and hepatic metabolic flux → superior growth. This putative gut-microbiota-liver axis integrates the intestinal, hepatic, and serum observations into a coherent physiological narrative. The abundance of Cetobacterium—a vitamin B12-synthesizing genus beneficial for feed digestion43—was markedly reduced at doses ≥0.6‰, further illustrating that EUE reshapes the microbiome in a dose-selective manner, favoring taxa with specific metabolic capabilities at the optimal dose while suppressing others. Notably, PICRUSt functional prediction detected no inter-group differences at KEGG pathway level 2, highlighting the resolution limitations of 16S-based metagenomic inference and underscoring the necessity of targeted metabolomics (e.g., bile acid profiling, SCFA quantification) to validate the functional contributions of Clostridium_sensu_stricto_1 in future studies.
Acknowledgments
This research was funded by the Investigation of Aquatic Biodiversity and Environmental Conditions in Key Waters of Henan Province and the Aquatic Seed Industry Research Project in Henan Province.
CRediT Authors’ Contribution
Conceptualization: Yuan Tian (Equal), Jin Meng (Equal), Yongtao Tang (Equal). Methodology: Yuan Tian (Equal), Shufang Gao (Equal), Jin Meng (Equal). Writing – original draft: Yuan Tian (Equal), Shufang Gao (Equal), Yongtao Tang (Equal). Writing – review & editing: Yuan Tian (Equal). Formal Analysis: Yang Zhou (Equal), Yongmou Chen (Equal), Honghua Li (Equal), Guilin Chi (Equal). Investigation: Yang Zhou (Equal), Yongmou Chen (Equal), Honghua Li (Equal), Guilin Chi (Equal). Resources: Yongxu Cheng (Lead), Jin Meng (Equal), Yongtao Tang (Equal). Funding acquisition: Xusheng Guo (Equal), Jin Meng (Equal), Yongtao Tang (Equal). Supervision: Xusheng Guo (Equal), Jin Meng (Equal), Yongtao Tang (Equal).
Competing of Interest – COPE
No competing interests were disclosed.
Ethical Conduct Approval – IACUC
The study protocol was approved by the Ethics Committee of Xinyang Agriculture and Forestry University (protocol code: XYAFU-AE-2024085; approval date: 12 October 2024) and followed the legal requirements and guidelines in China for the care and use of animals.
Informed Consent Statement
All authors and institutions have confirmed this manuscript for publication.
Data Availability Statement
All are available upon reasonable request.