
1. Introduction
Live transport of fish is routine in global aquaculture. Broodstock, seedstock, and market-sized animals move between hatcheries, farms, and consumption centers. Transport exposes fish to multiple stressors: confinement, handling, water-quality deterioration, and mechanical vibration. These stressors activate the hypothalamic-pituitary-interrenal axis, elevate cortisol and catecholamines, and perturb metabolic, osmoregulatory and immune functions.1–3 Unmitigated stress can cause tissue damage, immunosuppression, morbidity and mortality, leading to economic losses and animal-welfare concerns.4–6
Immersion anesthetics are used to attenuate transport stress by inducing sedation that dampens the stress response without causing surgical anesthesia.7,8 Among approved agents, tricaine methanesulfonate (MS-222; also called metacaine or TMS) is the most widely used. It offers rapid induction, predictable recovery and regulatory approval for food-fish use in several jurisdictions with a prescribed withdrawal period.9,10 MS-222 reduces cortisol elevation and improves post-transport survival in gilthead sea bream,11 largemouth bass12 and rainbow trout.13 However, the concentration needed for sedation without prolonged recovery varies among species. The optimal dose for each species must be determined empirically.14,15
The gill is the primary organ for evaluating anesthetic efficacy during transport. As the site of gas exchange, ion regulation, acid-base balance, and nitrogenous waste excretion, the gill epithelium is directly exposed to anesthetic-containing water. It is both a route of drug uptake and a target of transport injury.16,17 Transport stress causes gill histopathological alterations, including lamellar fusion, epithelial lifting, and chloride-cell hypertrophy. These changes compromise respiratory and osmoregulatory function.18,19 At the molecular level, transcriptomic profiling of gill tissue can characterize the pathways modulated by anesthetic intervention. This approach provides mechanistic insight beyond classical stress-indicator measurements. Recent studies show that MS-222 anesthesia upregulates glutathione metabolism and antioxidant transcripts in the gill11,13 and induces broad transcriptional reprogramming of immune, metabolic, and cytoskeletal pathways.12 These studies used concentrations optimized for surgical anesthesia, not for the lighter sedation appropriate for transport. The relationship between molecular signatures and histopathological outcomes at transport-relevant concentrations remains poorly understood.
Xenocypris davidi (yellow-tailed xenocypris) is a commercially valuable freshwater cyprinid cultured in central and southern China. It is prized for its tender flesh and high nutritional value, and production has expanded considerably in recent years.20,21 Juvenile X. davidi are routinely transported from hatcheries to ongrowing facilities. Transport-related stress, manifested as scale loss, skin abrasion, and post-transport mortality, constrains productivity. Despite the economic importance of this species, no MS-222 sedation protocol has been determined for its transport, and the molecular response of its gill tissue to anesthetic-assisted transport has not been characterized. Furthermore, existing transcriptomic studies of MS-222 in fish gills have focused on high-dose anesthesia. Lighter sedation depths suitable for transport remain unexamined. Because the study was designed to model cool-season or temperature-controlled transport, 10 °C was selected to reduce metabolic demand and oxygen consumption during the 8-h simulation; this condition is not intended to represent the species’ optimal rearing temperature.6
The present study aimed to (i) identify the minimum MS-222 concentration that reliably produced stage A2 ‘deep sedation’ in juvenile X. davidi without prolonged recovery and (ii) characterize the branchial transcriptomic response after simulated transport at the selected concentration. Integrating behavioral dose screening with gill RNA sequencing provided a practical sedation protocol and defined molecular pathways associated with MS-222-assisted transport in this commercially important freshwater cyprinid.
2. Materials and Methods
2.1 Experimental fish and acclimation
Juvenile Xenocypris davidi (body length: 10.32 ± 0.38 cm; body weight: 10.10 ± 1.08 g; mean ± SD) were obtained from a single commercial hatchery in Hunan Province, China. Fish spent 3 days acclimating in indoor holding tanks (1000 L) at the aquaculture facility of Xinyang Agriculture and Forestry University before the experiments. They were fed twice daily with a commercial extruded pellet diet (crude protein ≥ 32%, crude lipid ≥ 5%). Tanks received a full water exchange once daily. Water temperature stayed at 10.0 ± 0.1 °C under a 12 h light/12 h dark photoperiod. Fish were fasted for 24 h before each experiment. Dissolved oxygen, pH, water hardness, ammonia, nitrite and nitrate were not recorded as separate acclimation-period baseline measurements in the original experiment; accordingly, these parameters were not analytically verified as baseline conditions.
2.2 Anesthetic agent and solution preparation
Tricaine methanesulfonate (MS-222; 98% purity; Ron Reagent Co., Luoyang, China) served as the anesthetic. A fresh stock solution (10 g L-1) was prepared on each experimental day by dissolving MS-222 powder in dechlorinated tap water at 1:100 (w/v) with continuous stirring until fully dissolved. Working concentrations were prepared by diluting the stock solution with dechlorinated tap water immediately before use. All solutions matched the holding water temperature (10.0 ± 0.1 °C).
2.3 Gradient experiment
2.3.1 Preliminary range-finding
Preliminary range-finding trials identified the effective MS-222 concentration range for X. davidi. We tested 20, 40, 60, 80, 100, 120, and 140 mg L-1, one fish per concentration (n = 1). Based on the observed responses, the formal experimental concentrations were set to 32, 34, 38, 42, 46, 48, and 50 mg L-1.
2.3.2 Anesthesia induction assessment
Five fish were tested at each concentration (n = 5 per group), with each fish used only once. A dip net transferred fish into a transparent plastic container (20 × 10 × 15 cm) holding 2 L of the assigned anesthetic solution. A stopwatch started at immersion. Anesthesia stages followed Summerfelt and Smith22 and Ross and Ross7: A1 (sedation), reduced opercular movement; A2 (deep sedation), complete loss of equilibrium with opercular rhythm maintained; A3 (partial loss of equilibrium), fish turned upside down with slowed opercular movement; A4 (surgical anesthesia), complete loss of reflex activity; A5 (medullary collapse), no response to strong stimulation. If a fish did not reach the next stage within 8 min, deeper stages were recorded as not reached, and the fish was returned to fresh water. Fish that reached A5 were monitored continuously; no A5-stage fish received a second stimulation, and all were immediately transferred to fresh water upon reaching this stage, from which they recovered uneventfully within the reported R4 times. No mortality occurred at any concentration during the experiment.
2.3.3 Recovery assessment
Recovery was assessed in 2 L of fresh dechlorinated water at the same temperature. Recovery stages were defined as: R1, resumption of opercular movement; R2, fin and tail movement; R3, equilibrium recovery with partial swimming; R4, complete recovery of normal behavior. Recovery time was the interval to reach R4.
2.4 Simulated transport experiment
15 fish per group were transported for 8 h in oxygen-filled transport bags containing 4 L of water and either 34 mg L-1 MS-222 or no anesthetic (blank control). The bags were secured in a 30 × 20 × 20 cm transport unit mounted on a vibration device, and the controller frequency was maintained at 18.80 Hz throughout the transport period. Transport temperature was maintained at 10.0 ± 0.1 °C. Initial water quality parameters were identical across all transport bags at the start of transport (0 h), as all bags were filled with water from the same source and inflated with equal volumes of oxygen. At the conclusion of the 8-h transport period, water temperature, dissolved oxygen (DO), and pH were measured (DO: YSI ProODO; pH: Mettler Toledo FiveEasy) to assess transport-induced changes in water quality. A2 was selected as the operational transport endpoint because it provides effective sedation for transport by reducing activity and responsiveness while maintaining opercular ventilation; deeper anesthetic stages were avoided because of their greater association with reflex suppression and respiratory depression.7,8 In the gradient experiment, 34 mg L-1 was the lowest concentration at which all fish reached A2, whereas higher concentrations produced A3–A5 without a detectable recovery-time advantage. After transport, the second left gill arch was dissected. Tissue for transcriptomics was stored in RNAlater at −80 °C, and tissue for histology was fixed in 4% paraformaldehyde. After transport, all fish were transferred to holding tanks with continuous aeration and monitored for 24 h to record survival. The nominal loading biomass was approximately 37.9 g L-1 (15 fish × 10.10 g mean body mass ÷ 4 L); bag-specific biomass was not weighed separately.
2.5 RNA extraction, library construction, and sequencing
Total RNA was extracted with TRIzol (Invitrogen, USA) and assessed by NanoDrop 2000 spectrophotometry and agarose gel electrophoresis. RNA integrity was further evaluated on an Agilent 2100 Bioanalyzer; all samples had RIN values ≥ 7.5 (mean ± SD: 8.2 ± 0.4). mRNA was enriched using oligo(dT) beads, and strand-specific cDNA libraries were constructed with the NEBNext Ultra RNA Library Prep Kit (New England Biolabs, USA). Libraries were sequenced on an Illumina NovaSeq 6000 platform (150 bp paired-end, ~20 million reads per sample).
2.6 Bioinformatics analysis
Raw reads were processed with fastp v0.23.223 and aligned to the X. davidi reference genome using HISAT2 v2.2.1.24 Mean alignment rate across samples was 87.3% (range: 84.1–90.2%), with 76.5% of reads uniquely mapped on average. Strand-specific gene-level counts were obtained with featureCounts v2.0.3 (-s 2 for reverse-stranded library),25 with a mean of 68.2% of reads assigned to genes. Differential expression was analyzed with DESeq2 v1.38.3 using the design formula ~ condition26; log₂ fold changes were shrunken using the apeglm method; DEGs were defined by FDR < 0.05 and |log₂FC| ≥ 1 (1,220 DEGs: 634 up, 586 down). PCA was performed on the 5,000 most variable transcripts. GO and KEGG enrichment analyses used clusterProfiler v4.6.2.27 GSEA used fgsea v1.24.028 with 10,000 permutations, using all expressed genes ranked by log2 fold change. Gene sets were derived from the KEGG and GO Biological Process databases using clusterProfiler. The minimum gene set size was 10 and maximum was 500. All samples were processed in a single batch. Surrogate variable analysis29 was performed, but with only 10 samples (n = 5 per group), SVA has limited sensitivity; zero surrogate variables were detected, which does not conclusively demonstrate the absence of latent variation.
2.7 Histological examination
Fixed gill samples were dehydrated, paraffin-embedded, sectioned at 5 µm, stained with H&E, and examined under a light microscope (Nikon Eclipse Ci, Japan). Representative images were captured at ×100 magnification.
2.8 Statistical analysis
Fish were randomly assigned to treatment groups. Anesthesia stages were assessed by the same trained observer, who was not blinded to treatment concentration; histological evaluation was also unblinded. Data are presented as mean ± SD. One-way ANOVA with Tukey’s HSD was used for concentration comparisons after normality and homogeneity were assessed with Shapiro–Wilk and Levene tests. Analyses were performed in R v4.2.3 (Bioconductor v3.17) using DESeq2 v1.38.3, clusterProfiler v4.6.2, fgsea v1.24.0 and sva v3.46.0. P < 0.05 was considered significant; transcriptomic analyses used FDR < 0.05. The RNA-seq sample size was n = 5 per group. Published benchmarking indicates that additional replication generally improves power and false-discovery control in RNA-seq experiments.30 Effect sizes (η2 for ANOVA and Cohen’s d for pairwise comparisons) are reported where appropriate.
3. Results
3.1 Concentration-dependent anesthesia identified 34 mg L-1 as the lowest fully effective A2 treatment
MS-222 produced a concentration-dependent anesthesia response across the 32 to 50 mg L-1 range (Table 1). At 32 mg L-1, all five fish reached A1 but none progressed to A2. Mean time to A1 was 154.4 ± 10.8 s. At 34 mg L-1, all fish reached A2. Induction times were 47.4 ± 10.6 s to A1 and 132.8 ± 23.0 s to A2. Concentration affected A1 induction time (one-way ANOVA, F₆,₂₈ = 103.49, P < 0.001). A1 induction was slower at 32 mg L-1 than at every higher concentration. It was also slower at 50 mg L-1 than at 34 to 48 mg L-1 (all adjusted P < 0.001).
Among concentrations at which all fish reached A2 (34 to 50 mg L-1), A2 induction time also differed among treatments (F₅,₂₄ = 3.19, P = 0.024). The longest mean A2 induction time was at 46 mg L-1 (181.4 ± 30.2 s). This exceeded the times at 48 and 50 mg L-1 (Tukey-adjusted P = 0.029 and 0.033, respectively). The remaining pairwise comparisons were not significant. Progression beyond A2 increased with concentration. One fish (20%) reached A3 at 42 mg L-1. All fish reached A3 at 46 mg L-1, A4 at 48 mg L-1 and A5 at 50 mg L-1.
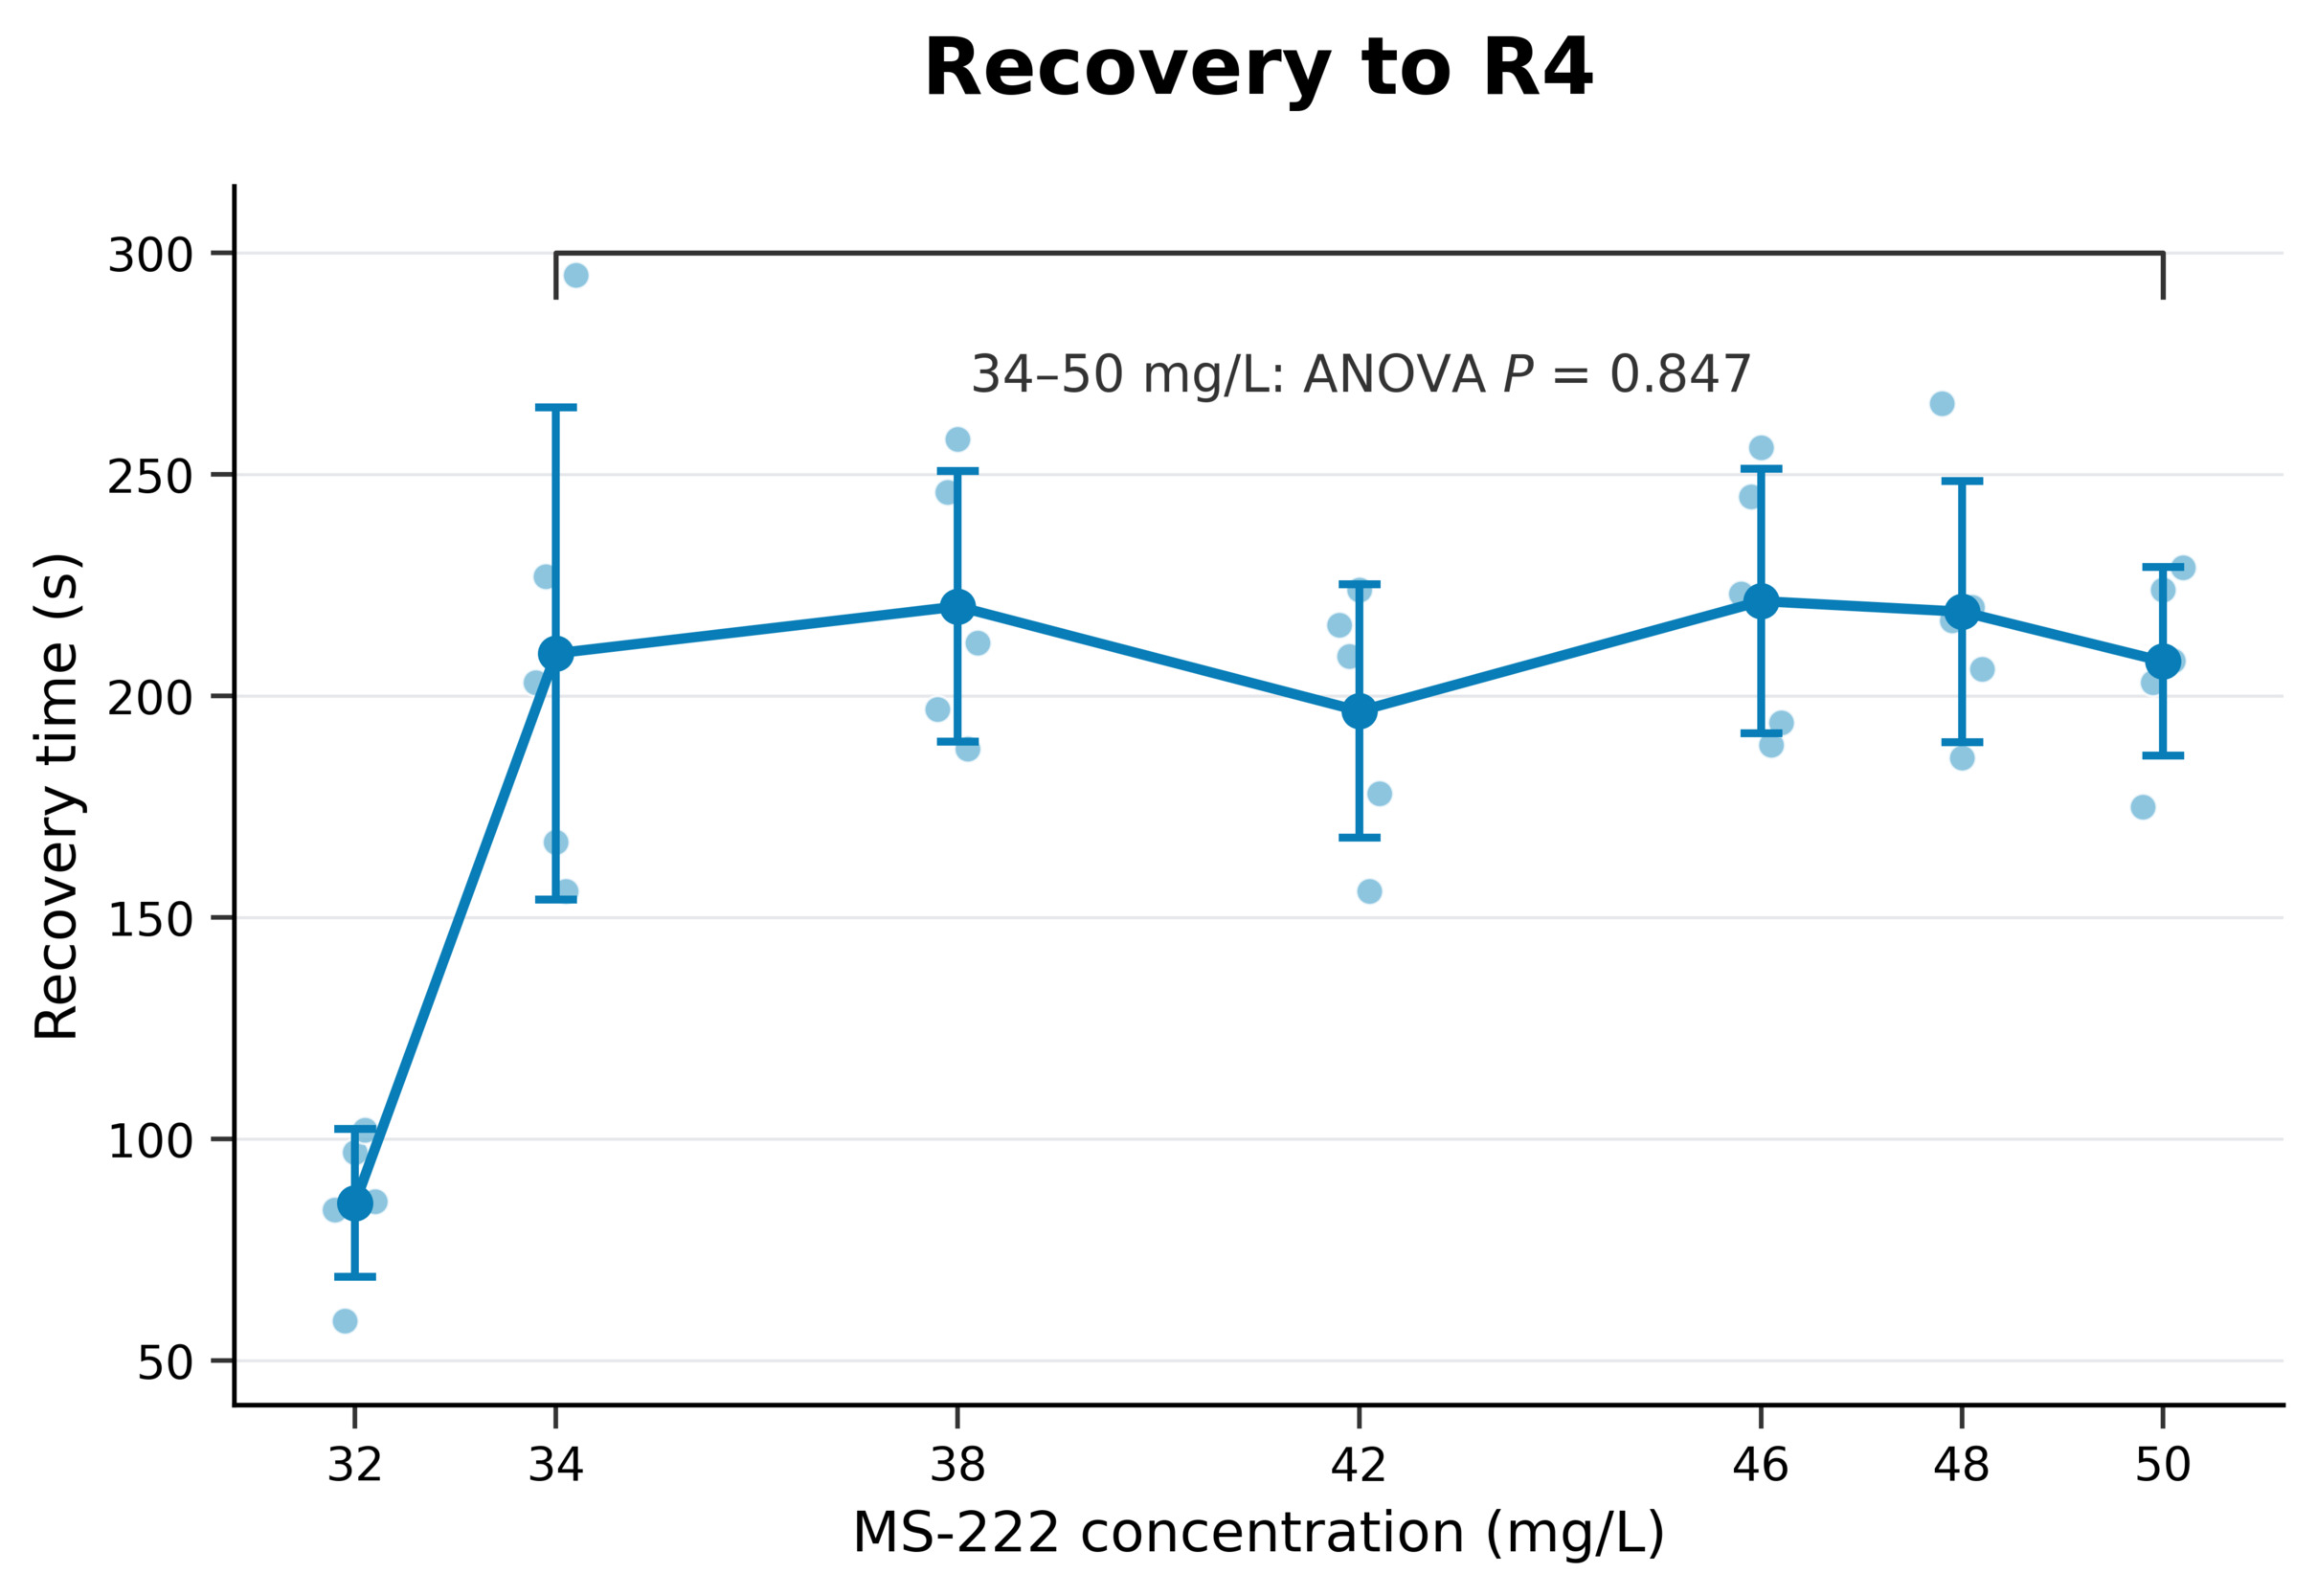
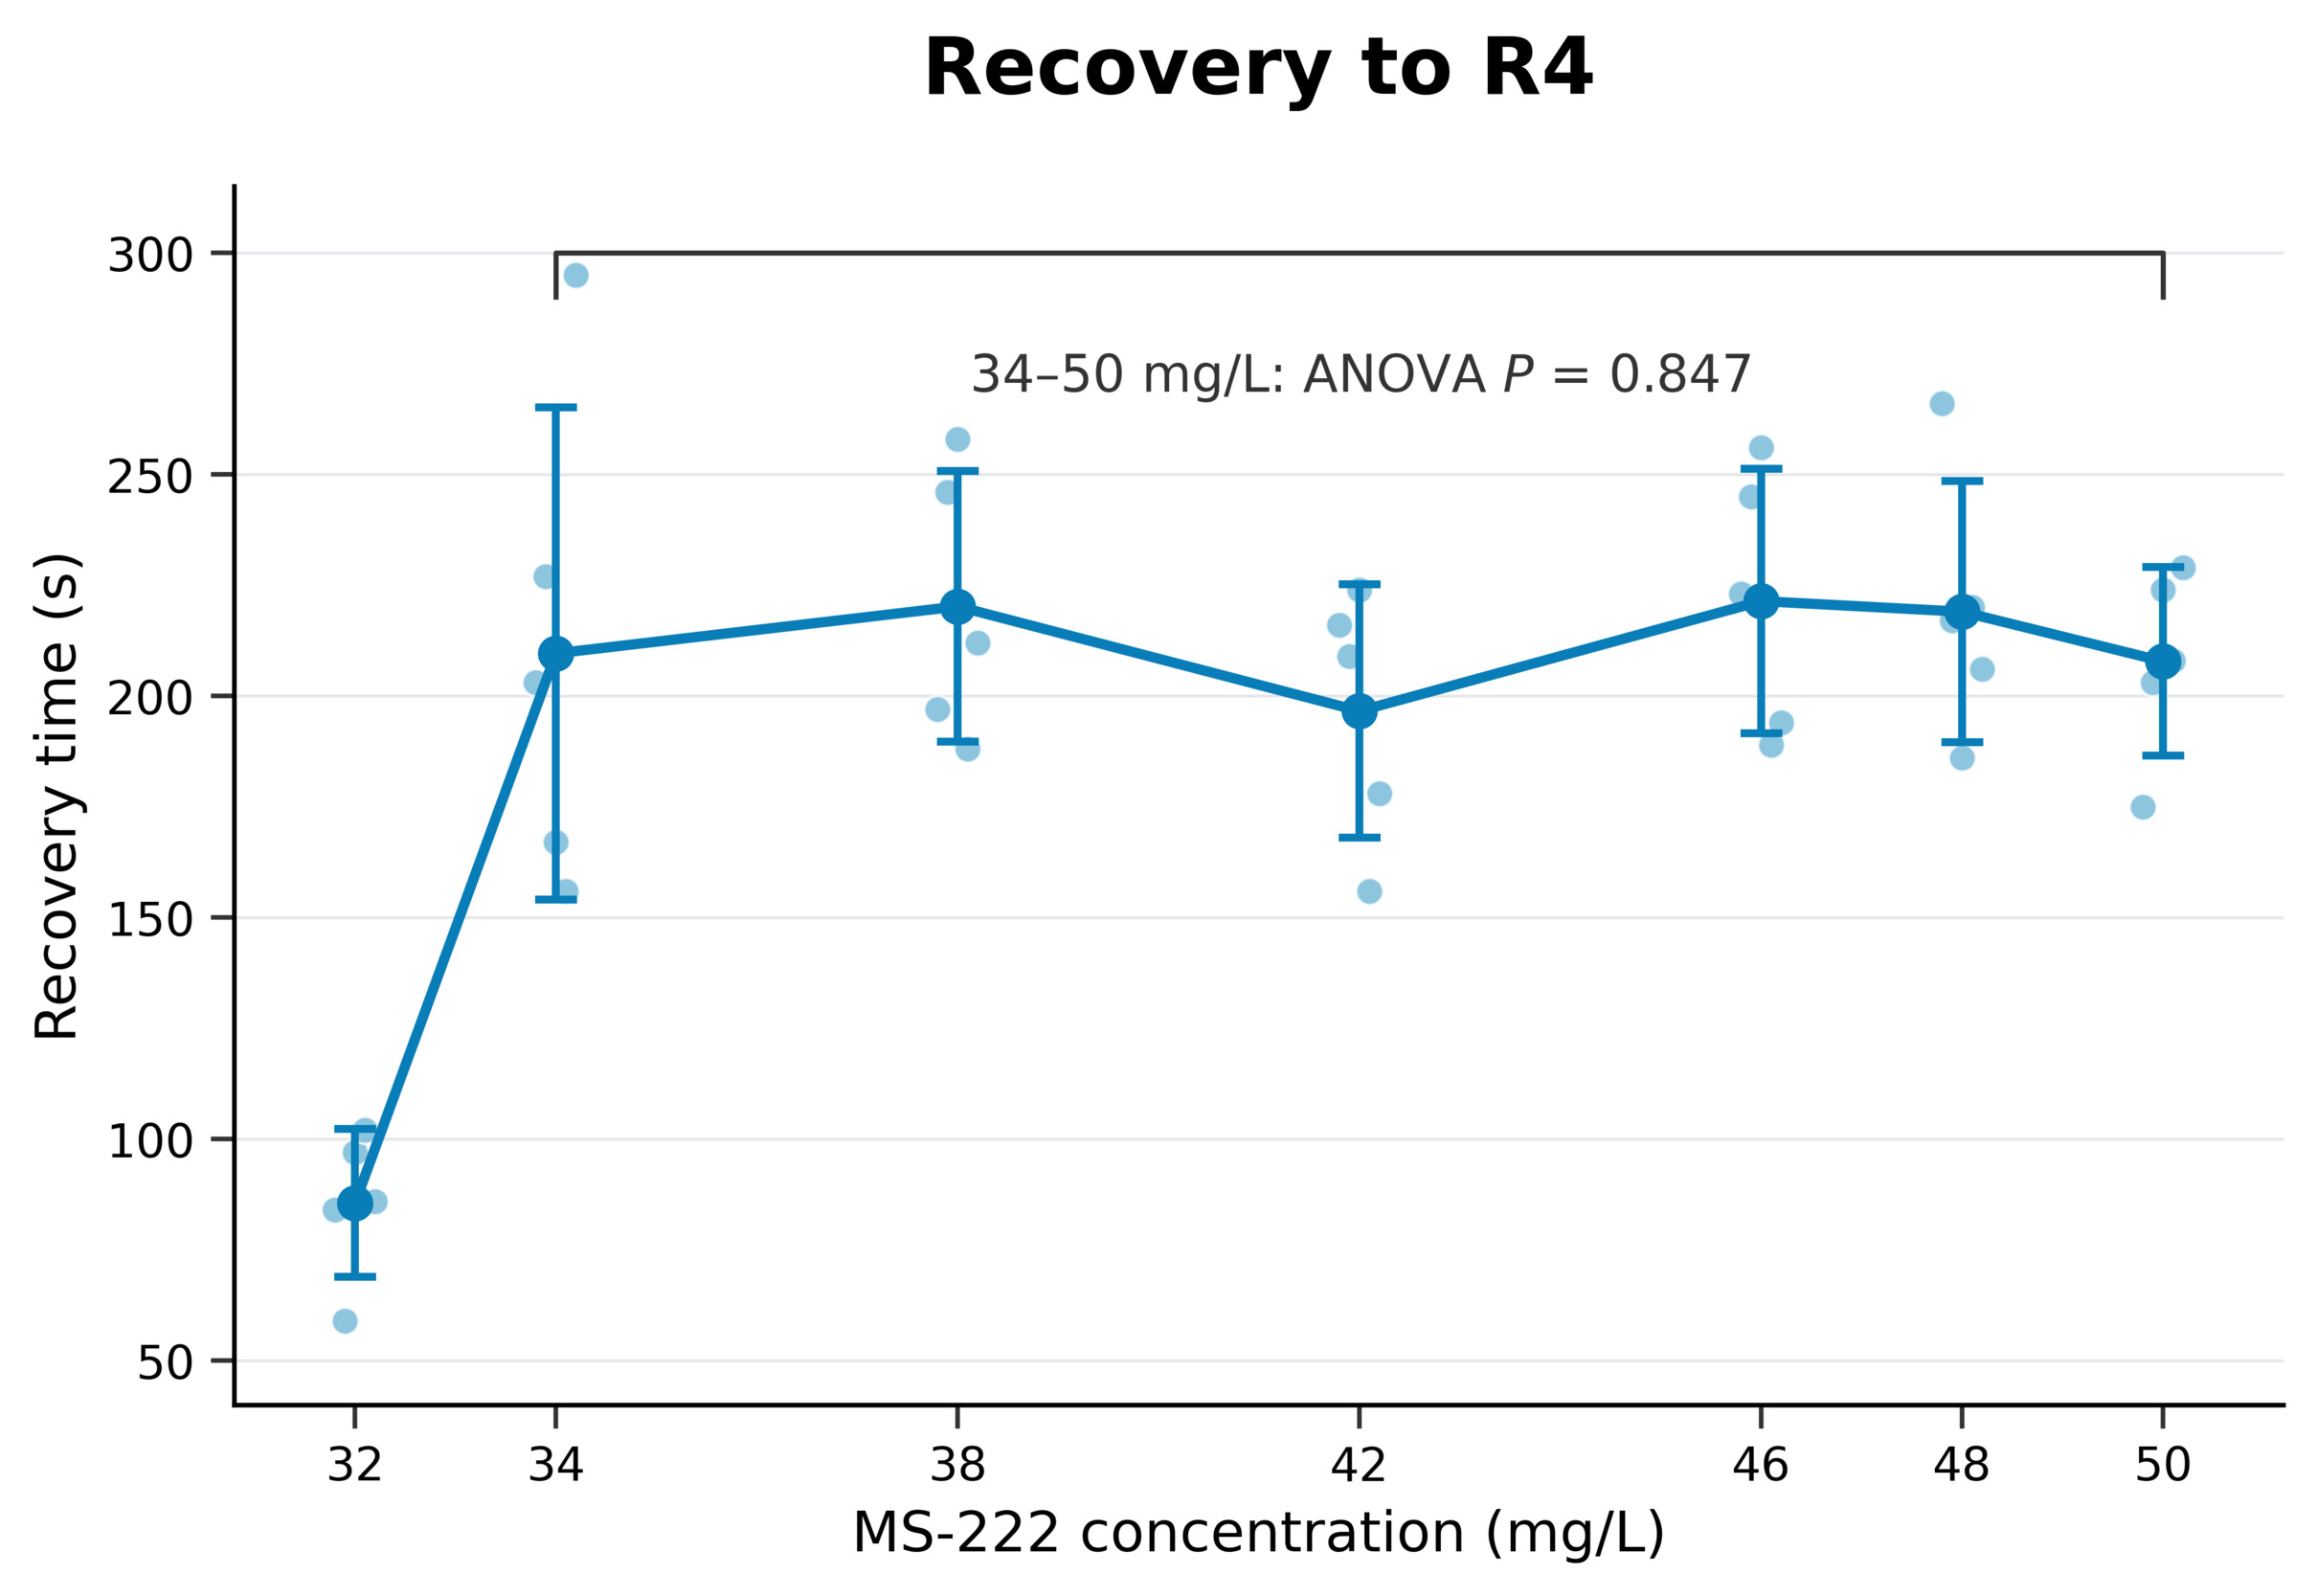
Recovery time to R4 differed across all seven concentrations (F₆,₂₈ = 11.35, P < 0.001), primarily because fish exposed to 32 mg L-1 recovered rapidly from the shallower A1 endpoint (85.6 ± 16.7 s). Recovery time showed no statistically significant difference among the 34 to 50 mg L-1 groups (F₅,₂₄ = 0.40, P = 0.847), although with n = 5 per concentration the statistical power to detect moderate differences was limited; this result should be interpreted as descriptive rather than as formal evidence of equivalence. Group means ranged from 196.6 ± 28.6 to 221.4 ± 29.8 s (Fig. 1); the 95% confidence intervals for recovery time at 34 mg L-1 were 145.5–273.7 s. Across treatments, 34 mg L-1 was the lowest concentration at which all fish reached A2 and recovery time did not differ detectably from the higher A2–A5 groups. This concentration was selected for simulated transport.
3.2 MS-222 exposure during transport altered the global gill transcriptome
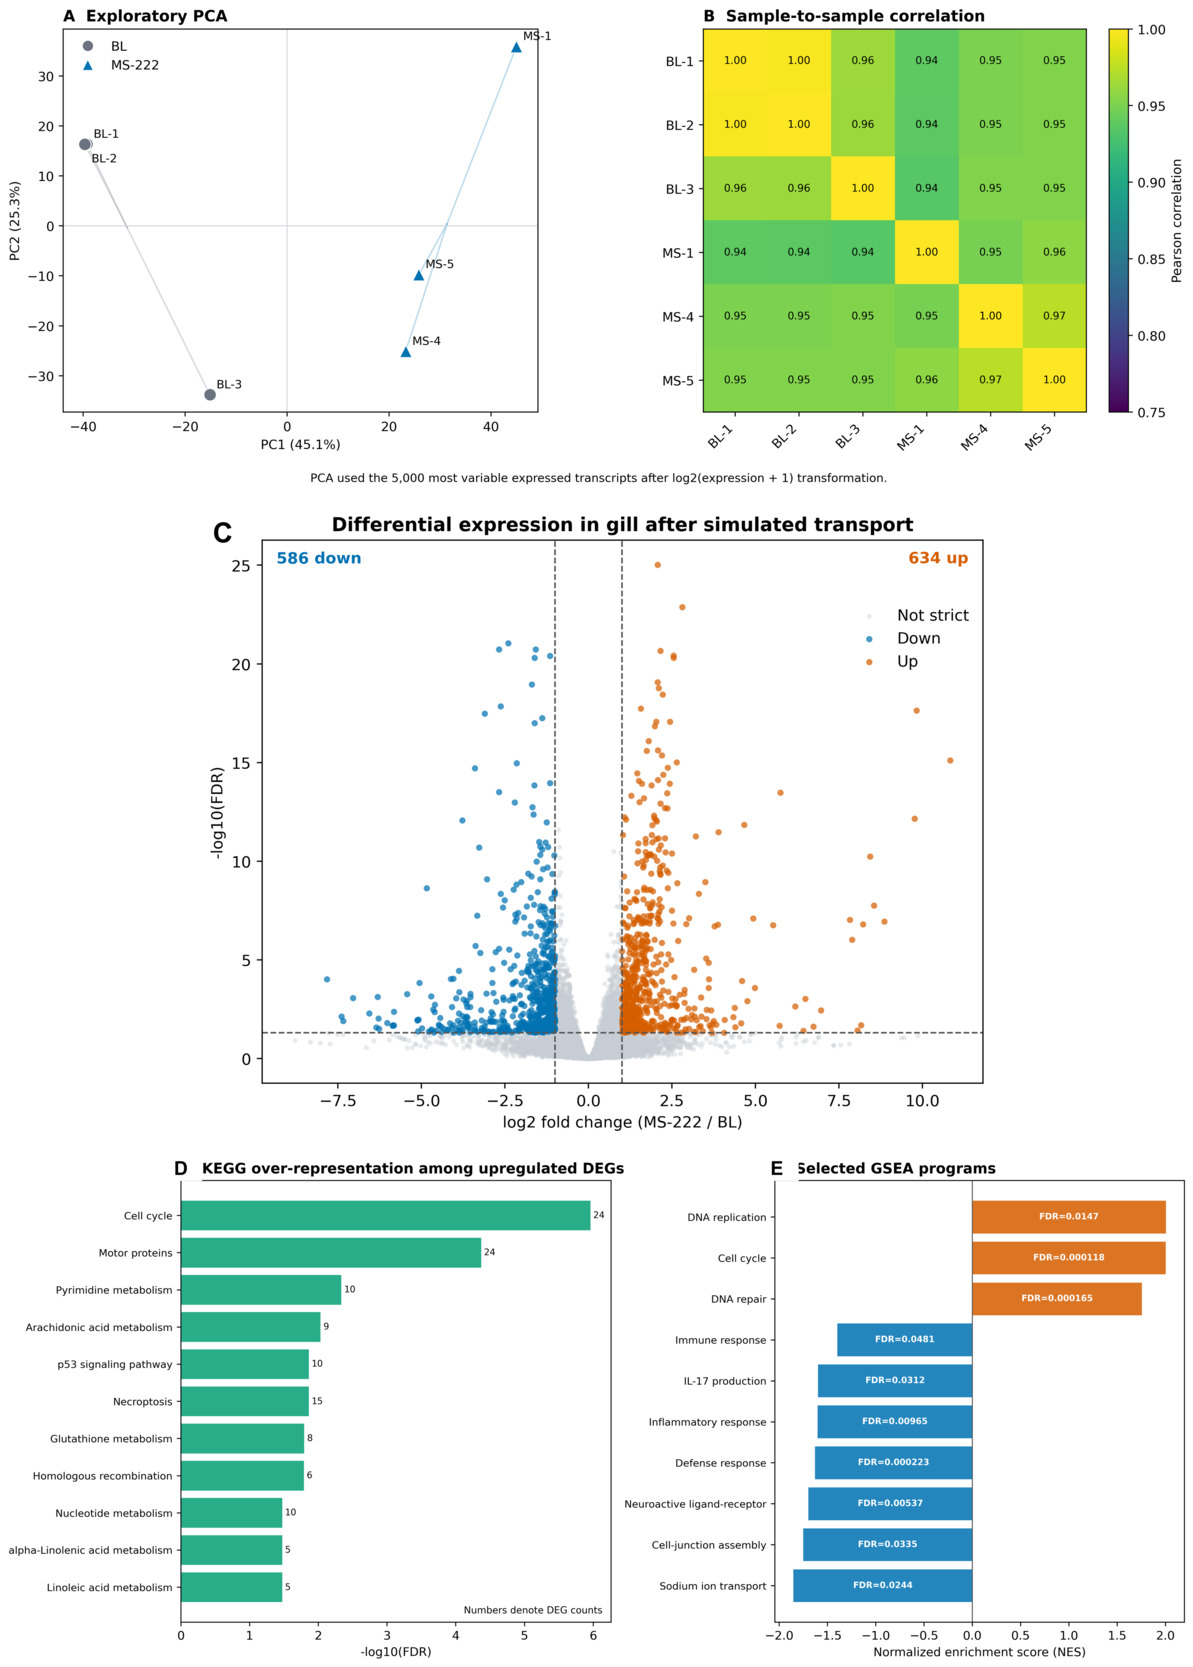
Gill transcriptomes from the 34 mg L-1 MS-222 and transported blank-control groups separated along PC1, which explained 45.1% of the total variance. PC2 explained a further 25.3% (Fig. 2A). Mean within-group Pearson correlations were 0.975 for the blank control and 0.960 for MS-222 (Fig. 2B). MS-1 was displaced from MS-4 and MS-5 mainly along PC2 but remained highly correlated with the other MS-222 samples and was retained in the analysis. The displacement of MS-1 along PC2 may reflect biological heterogeneity among individual fish, technical variation, or both; with n = 5 per group, these explanations cannot be separated, so the sample was retained as a potentially valid biological replicate rather than treated as an outlier.
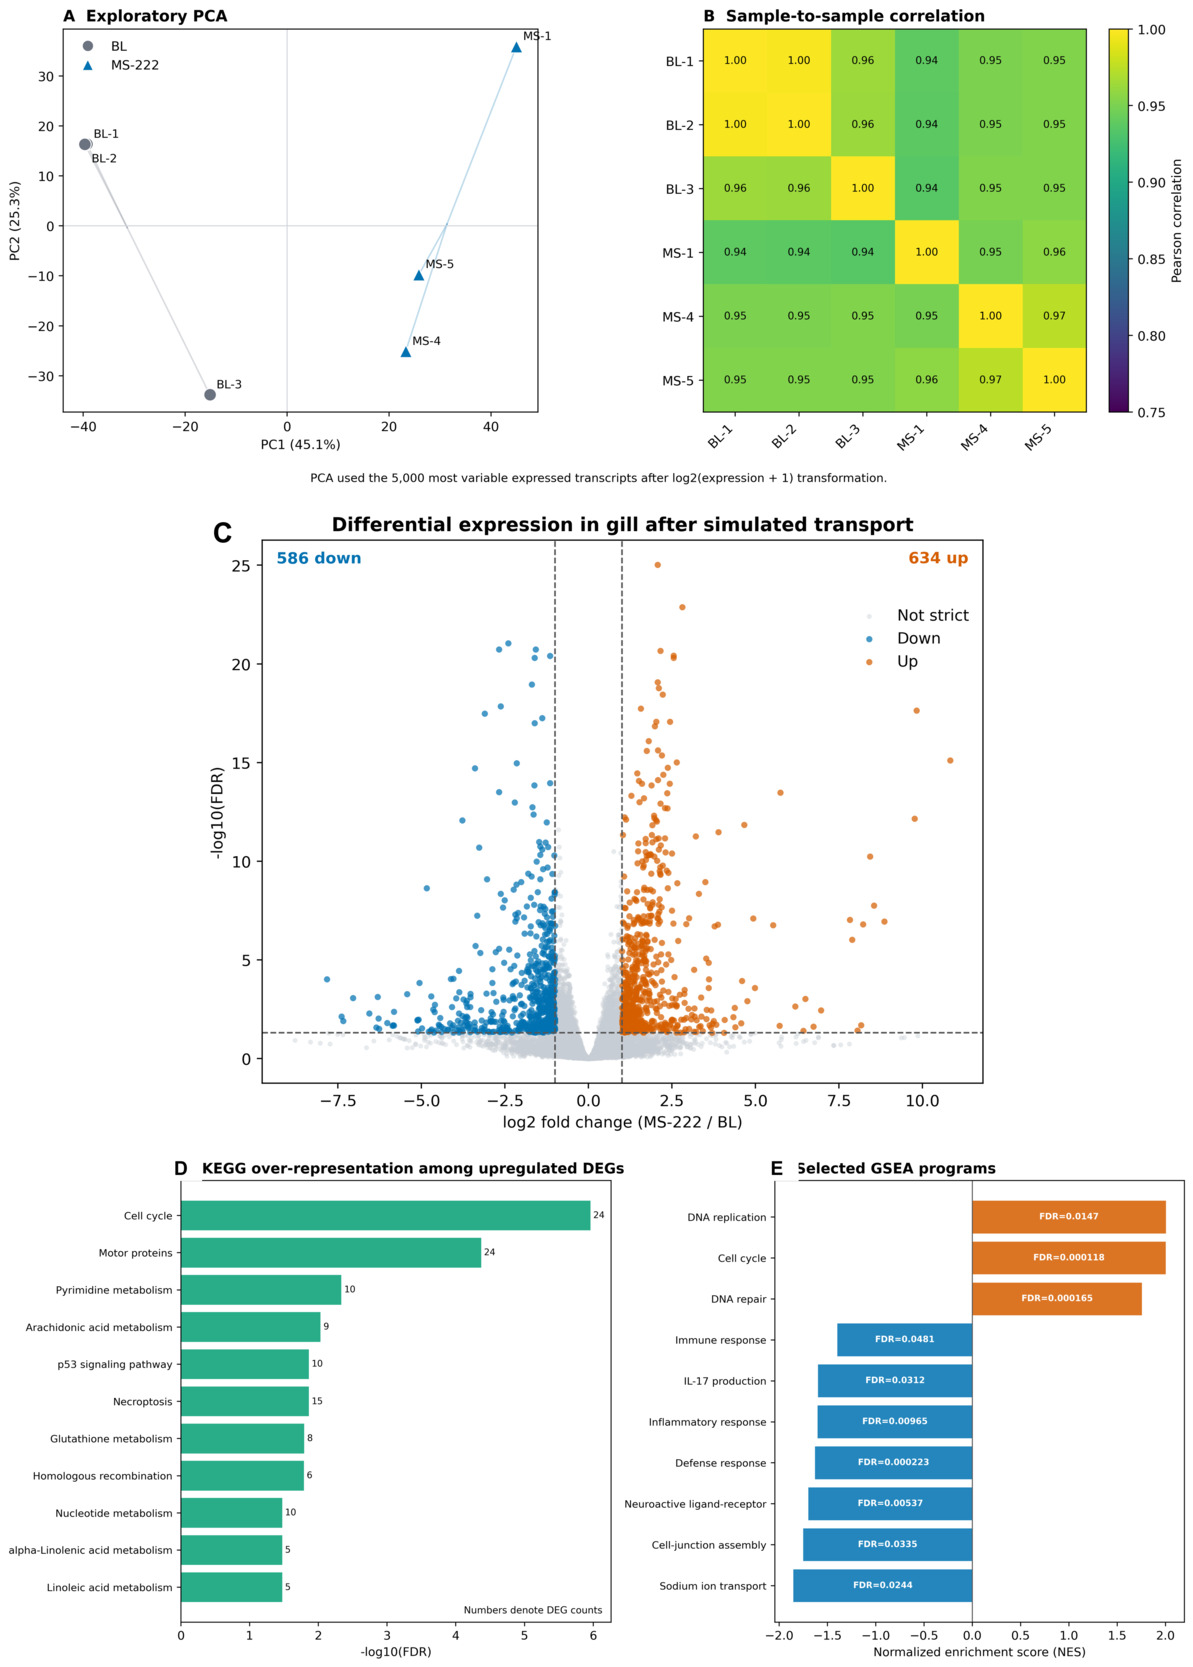
Of 19,193 transcripts with an available adjusted P value, 1,220 met the prespecified strict criterion of FDR < 0.05 and |log₂FC| ≥ 1. Relative to the transported blank control, 634 transcripts were upregulated and 586 were downregulated in the MS-222 group (Fig. 2C). The 40 most significant strict differentially expressed transcripts consistently separated the treatments. Residual variation remained among biological replicates (Supplemental Fig. S1).
3.3 MS-222 was associated with greater glutathione-related transcription and lower inflammatory signaling
KEGG over-representation analysis (ORA) was performed separately on upregulated and downregulated DEG lists to identify pathway-level patterns in each direction. Among upregulated transcripts, 11 pathways were enriched; no pathway among downregulated transcripts passed FDR < 0.05. Glutathione metabolism was enriched (8 transcripts, FDR = 0.0161). Higher abundance was found for GGT1-like (log₂FC = 3.595, FDR = 1.40 × 10⁻⁵), GGT5-like (log₂FC = 1.658, FDR = 6.36 × 10⁻¹⁴), GSTP-like (log₂FC = 1.867, FDR = 5.72 × 10⁻⁸), GPX8-like (log₂FC = 1.761, FDR = 0.00487) and GPX7-like (log₂FC = 1.623, FDR = 0.0427) (Fig. 2D and Supplemental Fig. S2). It should be noted that the MS-222 group experienced substantially higher dissolved oxygen (19.32 vs 10.75 mg L-1; ~171% vs 95% air saturation) during transport, and hyperoxia and temperature-related oxidative challenge can alter antioxidant and glutathione-associated responses in fish tissues.31,32 The relative contributions of MS-222 pharmacology and the hyperoxic condition to the observed glutathione enrichment cannot be distinguished with the current experimental design.
Inflammation-related gene sets were negatively enriched in the MS-222 group. These included inflammatory response (NES = −1.601, FDR = 0.00965), IL-17 production (NES = −1.598, FDR = 0.0312), defense response (NES = −1.627, FDR = 2.23 × 10⁻⁴) and immune response (NES = −1.397, FDR = 0.0481). Consistent with these gene-set results, PTGS2-like (log₂FC = −1.848, FDR = 1.93 × 10⁻⁸), PTGES-like (log₂FC = −1.332, FDR = 0.00358), IL17C-like (log₂FC = −3.242, FDR = 4.47 × 10⁻⁶), IL17AF1-like (log₂FC = −2.191, FDR = 0.00289), IL8-like (log₂FC = −1.304, FDR = 5.45 × 10⁻⁵) and TNF-like (log₂FC = −2.155, FDR = 7.80 × 10⁻⁸) were lower in MS-222-treated fish (Supplemental Fig. S2). Comparable anesthetic-dependent effects on stress and innate immune readouts have been reported in gilthead seabream, supporting cautious interpretation of these transcript-level differences as treatment-associated rather than as direct proof of systemic immunomodulation.33 Moreover, selected transcript-level responses supporting the integrated result are provided in Supplemental Table S1.
3.4 DNA-repair and regulated-cell-death programs were remodeled rather than uniformly suppressed
Upregulated transcripts were enriched for cell cycle (24 transcripts, FDR = 1.0 × 10⁻⁶), p53 signaling (10 transcripts, FDR = 0.0137), necroptosis (15 transcripts, FDR = 0.0137) and homologous recombination (6 transcripts, FDR = 0.0162). GSEA independently confirmed positive enrichment of DNA replication (NES = 2.004, FDR = 0.0147), cell cycle (NES = 2.003, FDR = 1.18 × 10⁻⁴) and DNA repair (NES = 1.755, FDR = 1.65 × 10⁻⁴) (Fig. 2D,E).
Cell-death-associated transcripts changed in both directions. Two caspase-like transcripts increased (log₂FC = 1.384, FDR = 1.10 × 10⁻⁴; log₂FC = 1.483, FDR = 6.71 × 10⁻⁸). A third decreased (log₂FC = −1.248, FDR = 0.00111). BCL2-like expression increased by 0.710 log₂ units (FDR = 0.0176) but did not meet the |log₂FC| ≥ 1 effect-size threshold. A BAX1-inhibitor-like transcript decreased (log₂FC = −2.523, FDR = 0.0396).
3.5 Gill ion-transport and junctional programs showed mixed responses
Sodium-ion transport (NES = −1.851, FDR = 0.0244) and positive regulation of cell-junction assembly (NES = −1.751, FDR = 0.0335) were negatively enriched in MS-222-treated gills. A bicarbonate or SLC4-like transporter (log₂FC = −1.584, FDR = 1.84 × 10⁻²¹) and an aquaporin-like transcript (log₂FC = −2.545, FDR = 0.00104) were reduced. Claudin-like transcripts showed bidirectional changes (representative log₂FC values of −1.154, +1.118 and −1.039).
The glucocorticoid-receptor-like transcript NR3C1-like was not differentially expressed (log₂FC = 0.717, FDR = 0.299). This result does not establish that glucocorticoid signaling was inactive; it indicates only that receptor-transcript abundance did not differ detectably under these conditions. Without plasma cortisol measurements, HPI-axis involvement remains speculative. Lactate-dehydrogenase-like transcripts showed inconsistent patterns. One was not statistically significant (log₂FC = −0.371, FDR = 0.0679), whereas another increased strongly (log₂FC = 8.220, FDR = 1.59 × 10⁻⁷). The extreme approximately 298-fold change may reflect very low baseline expression, a genuine metabolic shift or an alignment artefact; independent validation is required.
3.6 Cross-level summary
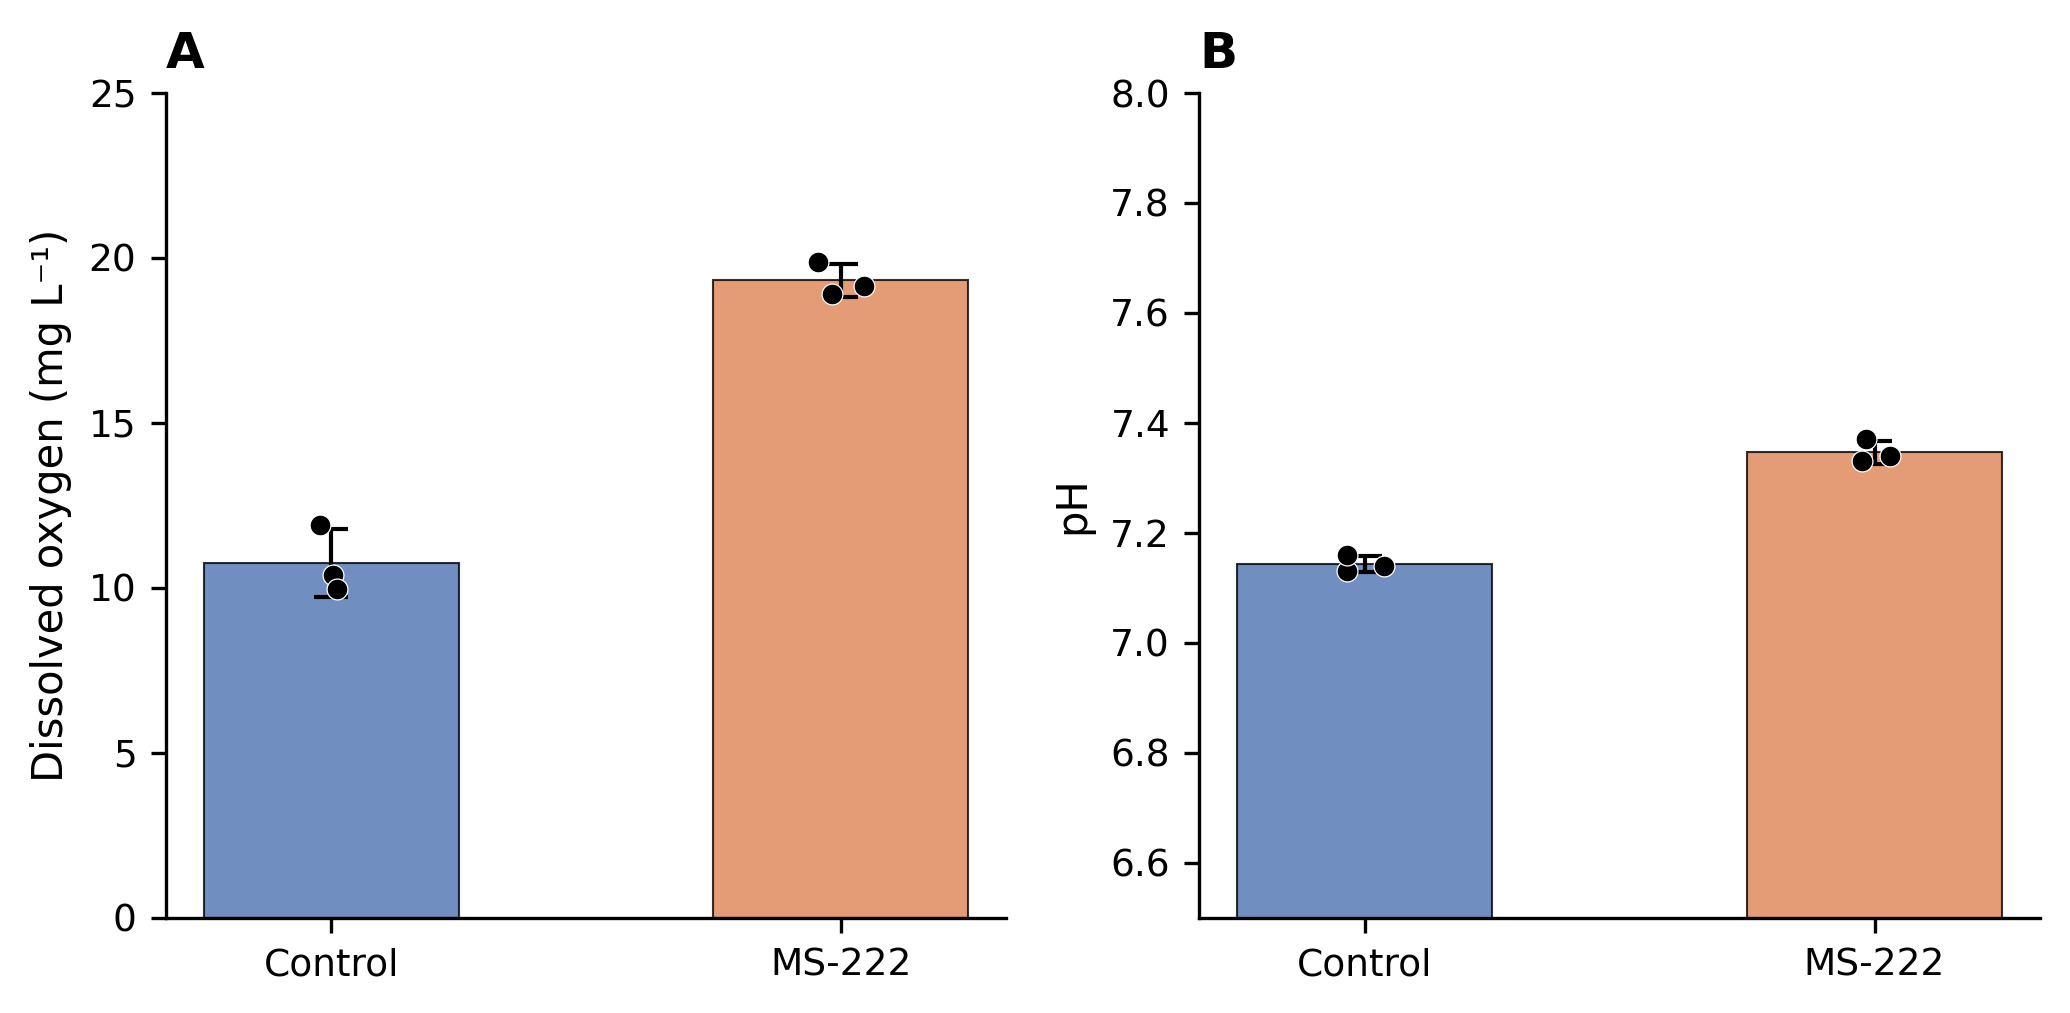
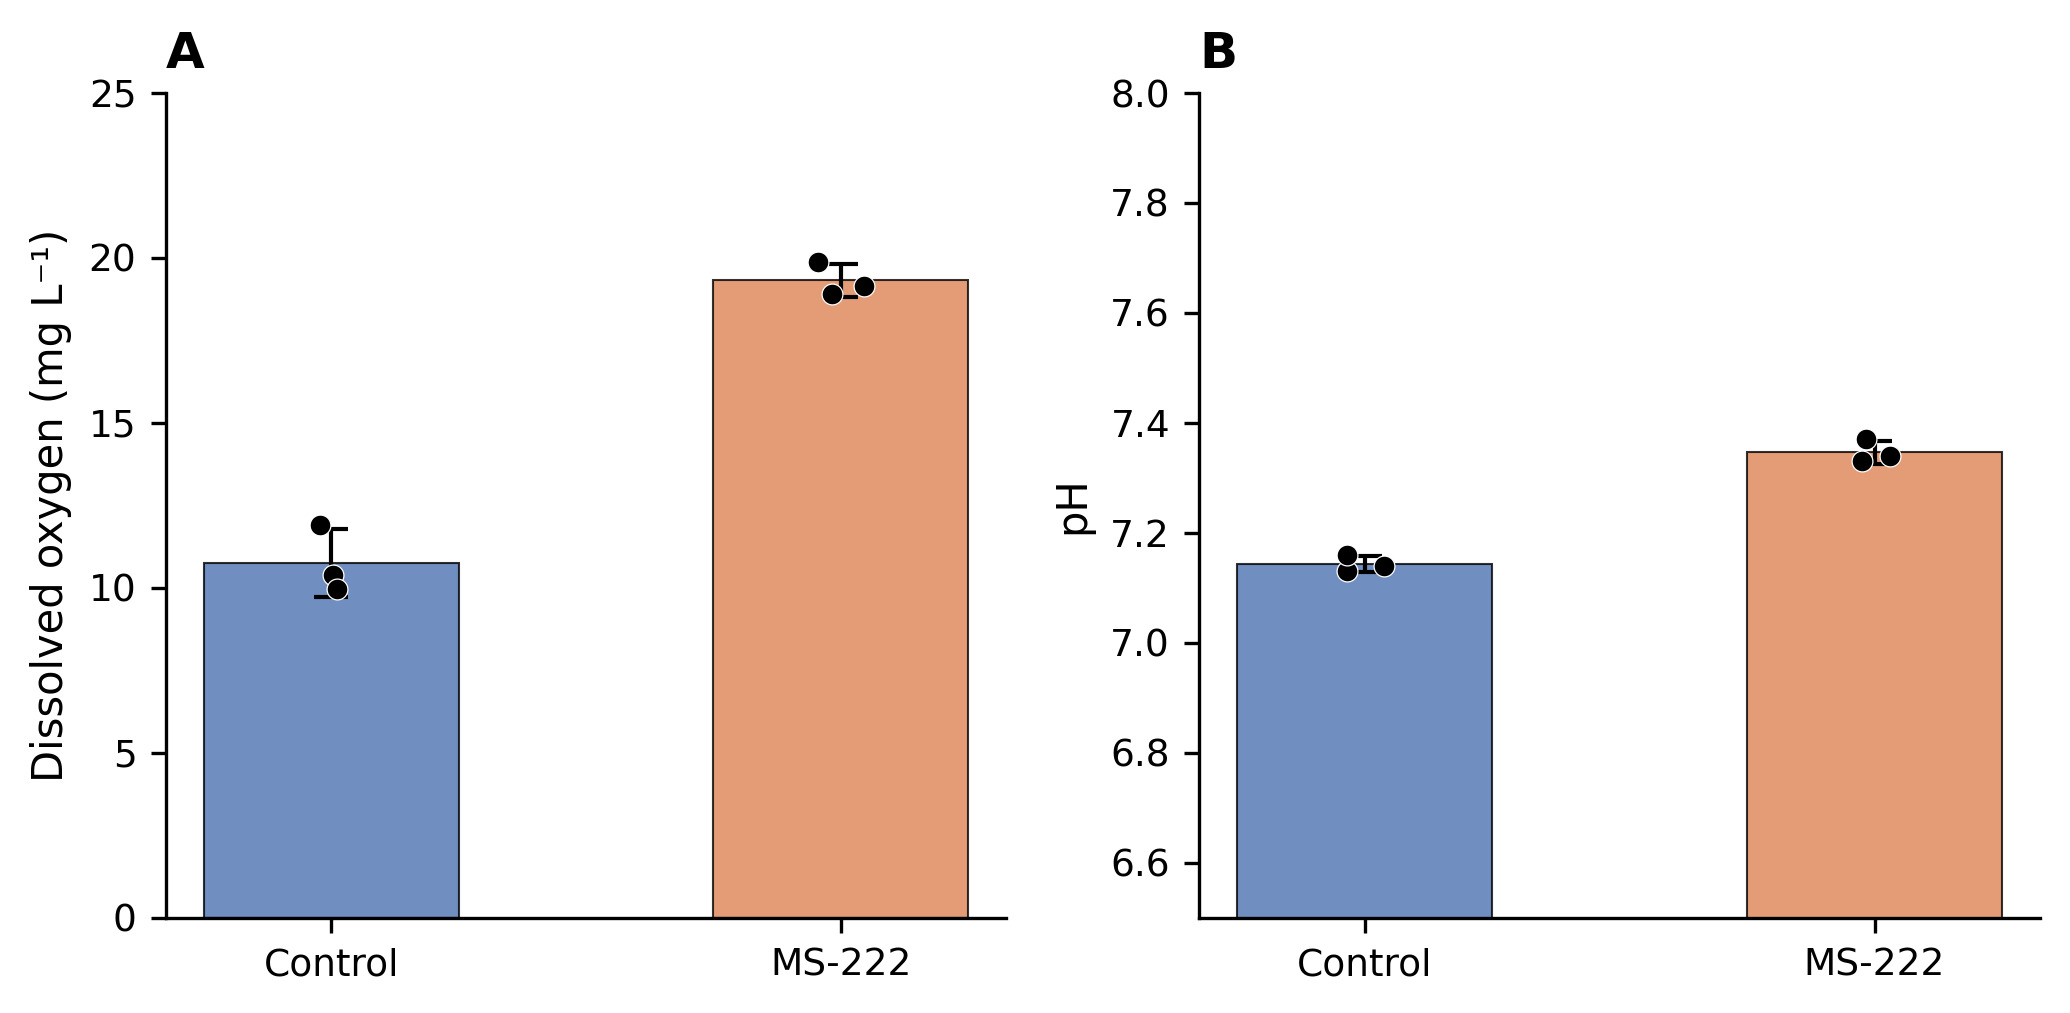
At the end of the 8-h simulated transport, water quality parameters differed between groups as a direct physiological consequence of sedated versus unsedated fish metabolic activity. Post-transport dissolved oxygen was significantly higher in the MS-222 group (19.32 ± 0.51 mg L-1) than in the transported blank control (10.75 ± 1.00 mg L-1; Fig. 3A), and post-transport pH was slightly higher (7.35 ± 0.02 vs 7.14 ± 0.02; Fig. 3B). All fish in both groups survived the 24 h post-transport observation period. At the selected 34 mg L-1 concentration, MS-222-assisted transport was associated with higher glutathione-related transcript abundance, lower inflammatory-mediator transcript abundance, and bidirectional changes in cell-death and ion-barrier modules. Representative low-power H&E sections showed that the general outline of the primary filaments remained identifiable in the transported blank control; however, focal regions contained irregularly oriented and folded secondary lamellae, partial apposition-like profiles, and loose or fragment-like tissue between adjacent filaments. In the MS-222 group, primary filaments were more uniformly aligned and most secondary lamellae were comparatively regular and clearly separated, with less extensive focal architectural disorganization in the displayed field. These observations are consistent with relative preservation of gill architecture under the selected MS-222 transport condition. Because only one representative low-power image per group was available, no inference regarding lesion prevalence or statistical significance was made (Supplemental Fig. S3).
4. Discussion
We evaluated MS-222 as a transport sedative for juvenile Xenocypris davidi using behavioral dose-response testing and gill transcriptomics. The gradient experiment identified 34 mg L-1 as the lowest concentration that induced stage A2 deep sedation in all fish at 10 °C, with no detectable increase in recovery time compared with higher concentrations. At this dose, the MS-222 group showed coordinated differences in glutathione metabolism, inflammatory signaling, regulated cell death, and ion-barrier programs relative to the transported control. These findings support a practical cool-water sedation protocol and identify branchial pathways for targeted physiological validation.
4.1 The 34 mg L-1 A2 endpoint balances induction efficiency with recovery predictability
The graded dose-response from 32 to 50 mg L-1 of MS-222 is consistent with the pharmacology of tricaine methanesulfonate in teleosts.8,10 Deeper anesthesia requires higher immersion concentrations because the drug equilibrates with the aqueous medium at its site of action. The finding that recovery time to R4 plateaued across 34 to 50 mg L-1 (F₅,₂₄ = 0.40, P = 0.847) distinguishes MS-222 from agents such as eugenol and clove oil, for which recovery time increases with concentration in many species.34,35 This plateau probably reflects MS-222’s rapid clearance across the gill epithelium. Once the anesthetic depth exceeds a threshold, the elimination rate, rather than the absolute immersion concentration, becomes the rate-limiting step for recovery.36,37 It should be emphasized that this dose recommendation is validated only for 10 °C; application at higher transport temperatures requires empirical re-evaluation. The A2 target, therefore, balanced operational immobilization with maintained opercular ventilation: A1 left residual reactivity, whereas progression to A3–A5 introduced unnecessary reflex and respiratory depression for transport.7,8 A comparable concentration-dependent relationship between MS-222 exposure and induction or recovery endpoints has been reported in juvenile yellow perch, although the effective dose was species-specific.
The selected concentration of 34 mg L-1 is lower than the 60 to 150 mg L-1 ranges reported for deep anesthesia in several cultured species: Nile tilapia,15 cobia,38 spotted knifejaw,39 and common carp.40 This difference is consistent with known species-specific sensitivity to MS-222 and with the experimental temperature used here. The experiment was conducted at 10.0 ± 0.1 °C, which is below the optimal rearing temperature for this warm-water cyprinid (typically 20–28 °C). At lower temperatures, gill perfusion rate and metabolic clearance of MS-222 are reduced, which can increase drug potency and prolong recovery.37,41 The modest effective concentration in X. davidi may therefore partly reflect the low experimental temperature rather than species-specific sensitivity alone. The approximately 10-fold difference in sensitivity between X. davidi (34 mg L-1) and Nile tilapia (300 mg L-1) likely involves factors beyond temperature. Cyprinids generally have larger gill surface area per gram body weight than cichlids,42 higher baseline cardiac output, and lower body lipid content, all of which increase MS-222 uptake efficiency. Species differences in N-acetyltransferase activity, which governs MS-222 metabolism rate, may also contribute. This should be considered when extrapolating the 34 mg L-1 dose to warmer transport conditions. Nevertheless, from a practical standpoint, this concentration achieves reliable A2 sedation without prolonging recovery at 10 °C, providing a practical operational window for cold-season or temperature-controlled transport applications.5,7 The effective MS-222 concentration for A2 sedation at higher temperatures is expected to differ from the 34 mg L-1 dose identified at 10 °C due to temperature-dependent changes in gill perfusion and drug clearance. Direct empirical determination at the relevant transport temperature is required before warm-water application. Direct pharmacokinetic measurements across relevant temperature ranges would clarify the temperature-dose relationship. Additionally, MS-222 was used without pH buffering; although the pH change was less than 0.2 units under the experimental conditions, the potential for pH-driven effects on gill transcriptional responses cannot be fully excluded.
4.2 Coordinated upregulation of glutathione metabolism and suppression of inflammatory signaling suggest redox-immune crosstalk
The most consistent transcriptional difference between MS-222-treated and untreated transported gills was enrichment of glutathione metabolism (FDR = 0.016) together with higher levels of GGT1-like, GSTP-like, GPX8-like, and GPX7-like transcripts (log₂FC = 1.62 to 3.60; FDR ≤ 0.043). This pattern agrees with previous reports.11–13 The present data extend these observations to a lower concentration (34 mg L-1) and shorter exposure relevant to commercial transport. However, MS-222, as a xenobiotic requiring hepatic and branchial detoxification, may itself induce glutathione S-transferase expression through Nrf2/ARE signaling — an alternative interpretation supported by the observation that GSTP (pi-class), which has a functional antioxidant response element in its promoter, was the primary GST upregulated. Dissolved oxygen was also higher in the MS-222 containers (19.32 vs 10.75 mg L-1). Because hyperoxia can modify redox-sensitive transcription, the glutathione signature likely reflects the combined influence of sedation-associated metabolic suppression, oxygen availability, and MS-222 exposure rather than a single pharmacological mechanism. This comparison is also relevant to prior work showing that anesthetic choice can differentially affect stress and innate immune endpoints in gilthead seabream.33
Inflammatory mediator transcripts were lower in the MS-222 group relative to the transported control. PTGS2-like (log₂FC = −1.85, FDR = 1.9 × 10⁻⁸), IL17C-like, TNF-like and IL8-like transcripts were all reduced (log₂FC = −1.30 to −3.24). Gene-set enrichment analysis confirmed negative enrichment of inflammatory response (NES = −1.60, FDR = 0.0097) and defense response (NES = −1.63, FDR = 2.2 × 10⁻⁴) in the MS-222 group. The lower inflammatory transcription is consistent with the hypothesis that sedation attenuates a stress-induced inflammatory cascade, but could also reflect a shifted stress trajectory or metabolic suppression. Without plasma cortisol measurements, the inferred HPI-axis mediation remains speculative. Furthermore, the glucocorticoid receptor transcript NR3C1 was not differentially expressed (log₂FC = 0.717, FDR = 0.299), arguing against a transcriptionally mediated glucocorticoid signaling response in the gill. Plasma cortisol measurements would be required to establish whether systemic HPI-axis attenuation underlies the observed transcriptional differences.
4.3 Bidirectional remodeling of cell-death and ion-barrier programs reveals a dynamic rather than uniformly protective gill response
A more complex picture emerged from the cell-death and gill-barrier modules. The MS-222 group showed bidirectional changes relative to the transported control: two caspase-like transcripts were higher (log₂FC = 1.38, 1.48) and one was lower (log₂FC = −1.25). The p53 signaling (FDR = 0.014) and necroptosis (FDR = 0.014) pathways were enriched among upregulated DEGs. This pattern resembles active remodeling of damage-surveillance programs previously described in fish gills during hypoxic acclimation43 and parasitic infection.44 Upregulated homologous recombination (FDR = 0.0162) and DNA repair (GSEA NES = 1.755, FDR = 1.65 × 10⁻⁴) are consistent with this interpretation.
The ion-transport and tight-junction gene modules showed similarly mixed responses. An SLC4-family bicarbonate transporter (log₂FC = −1.58, FDR = 1.8 × 10⁻²¹) and an aquaporin-like transcript (log₂FC = −2.55, FDR = 0.0010) were lower in the MS-222 group, while claudin-like transcripts changed in both directions. SLC4 transporters mediate bicarbonate transport for acid-base regulation,45 and aquaporins facilitate transcellular water movement.46 Their lower abundance could indicate reduced capacity for acid-base and osmotic compensation, but without direct ion flux measurements, this interpretation remains speculative.
MS-222 is a voltage-gated sodium channel blocker, structurally related to procaine and other local anesthetics.47 Its primary mechanism of action—inhibition of voltage-gated Na+ channels in neuronal membranes—accounts for its anesthetic and sedative properties. However, this mechanism has direct implications for gill physiology beyond the nervous system. Gill ionocytes (mitochondrion-rich cells) depend on Na+/K+-ATPase-driven ion transport, which in turn relies on sodium gradients maintained by epithelial sodium channels. Pharmacological blockade of sodium channels by MS-222 could directly affect ionocyte function, potentially contributing to the observed downregulation of SLC4-family bicarbonate transporters and aquaporin-like transcripts, as well as the bidirectional claudin regulation. In this light, the mixed ion-transport and tight-junction responses (Section 3.5) may reflect a direct pharmacological effect on gill ionoregulatory cells rather than, or in addition to, an indirect consequence of stress attenuation. In addition to sodium channel blockade, MS-222 and related aminoester local anesthetics have been shown to uncouple mitochondrial oxidative phosphorylation.48,49 This mitochondrial effect is relevant to the observed transcriptomic changes: low-level mitochondrial uncoupling can generate superoxide at respiratory complexes I and III, which in turn can activate Nrf2/ARE signaling and induce glutathione-related transcripts. It could also explain the bidirectional expression of caspases, as mild mitochondrial stress can trigger survival pathways, whereas more severe stress activates apoptosis. The mixed ionocyte responses may partly reflect mitochondrial impairment in mitochondrion-rich gill ionocytes, which depend on oxidative phosphorylation to drive ion transport. The interplay between sodium channel blockade and mitochondrial effects should be considered when interpreting the gill transcriptional response. It should be noted, however, that voltage-gated Na+ channels are primarily expressed in excitable cells (neurons, muscle), whereas gill ionocytes are non-excitable epithelial cells whose principal apical Na+ conductance is thought to be mediated by acid-sensing ion channels (ASICs) or epithelial Na+ channel (ENaC) family members. The direct effect of MS-222 on ionocyte function through Nav blockade, therefore, requires further investigation. These mechanistic considerations are speculative and are presented as hypotheses for future targeted investigation rather than as conclusions supported by the present data. The proposed link between Nav blockade and ionocyte responses is, therefore, hypothesis-generating; the present transcriptomic data do not demonstrate functional channel blockade, altered ion flux, or a direct pharmacological effect in gill ionocytes.
4.4 Limitations
The principal design constraint is the absence of an unstressed, non-transported baseline. Consequently, the present contrast identifies differences between MS-222-assisted and unassisted transport but cannot determine whether either response moved toward pre-transport conditions. The single terminal sampling point also precludes temporal ordering. A factorial design incorporating baseline, transport-only, MS-222-only and MS-222-plus-transport groups at multiple recovery times would distinguish transport attenuation from drug-specific induction. The MS-1 displacement in the PCA further illustrates this residual within-group variation. Because the RNA-seq groups contained only five biological replicates, the study was not powered to identify the source of this variation or to detect moderate expression differences reliably; the PCA pattern is therefore interpreted descriptively.
Physiological validation should combine plasma cortisol, glucose and lactate measurements with gill antioxidant activity, oxidative-damage indices and ionoregulatory endpoints. Blinded multi-field histopathological scoring, for example with the Bernet framework,50 is needed before tissue protection can be evaluated quantitatively. The dose should also be confirmed across operational temperatures and longer post-transport intervals, and the extreme LDH-like transcript should be verified by targeted qPCR and orthology assessment.
5. Conclusions
34 mg L-1 MS-222 reliably produced A2 sedation in juvenile X. davidi at 10 °C without detectably prolonging recovery. After simulated transport, MS-222-treated gills showed higher abundance of glutathione-related transcripts, lower abundance of inflammatory mediators, and coordinated remodeling of cell-death and ion-barrier programs relative to the transported control. The behavioral and transcriptomic results support 34 mg L-1 as a practical cool-water transport dose and identify redox, immune, and epithelial pathways for physiological validation.
Acknowledgment
This work was supported by the Natural Science Foundation of Henan (Grant Nos. 252300420726 and 252300421681); the Henan Province Science and Technology Tackling Projects (Grant Nos. 252102110075 and 252102321036); the Investigation of Aquatic Biodiversity and Environmental Conditions in Key Waters of Henan Province project; the Doctoral Research Start-up Fund of Xinyang Agriculture and Forestry University (Grant No. 203129); and the 2027 Henan Provincial Higher Education Key Research Project (Youth Program, Grant No. 27BQ240001).
Author contributions
Conceptualization: Gaoyou Yao (Equal), Yuyuan Wu (Equal), Teng Ma (Equal), Tiezhu Yang (Equal). Writing – original draft: Gaoyou Yao (Equal), Yuyuan Wu (Equal), Teng Ma (Equal), Tiezhu Yang (Equal). Writing – review & editing: Gaoyou Yao (Equal), Yuyuan Wu (Equal), Teng Ma (Equal), Hua Zhang (Equal), Hanzhi Xu (Equal), Tiezhu Yang (Equal). Supervision: Gaoyou Yao (Equal), Yuyuan Wu (Equal), Teng Ma (Equal), Tiezhu Yang (Equal). Project administration: Gaoyou Yao (Equal), Yuyuan Wu (Equal), Teng Ma (Equal), Tiezhu Yang (Equal). Methodology: Yuyuan Wu (Equal), Teng Ma (Equal), Xusheng Guo (Equal), Mengfan Ren (Equal), Tao Li (Equal), Xingxing Ding (Equal). Investigation: Yuyuan Wu (Equal), Teng Ma (Equal), Xusheng Guo (Equal), Mengfan Ren (Equal), Tao Li (Equal), Xingxing Ding (Equal). Data curation: Yuyuan Wu (Equal), Teng Ma (Equal), Xusheng Guo (Equal), Mengfan Ren (Equal), Tao Li (Equal), Xingxing Ding (Equal). Formal Analysis: Hua Zhang (Equal), Hanzhi Xu (Equal). Visualization: Hua Zhang (Equal), Hanzhi Xu (Equal). Resources: Shijie Yang (Equal), Yuanye Ma (Equal), Bing Li (Equal).
Ethical conduct approval – IACUC
The Institutional Animal Care and Use Committee of Xinyang Agriculture and Forestry University approved all procedures (Protocol No. XYAFU-2026-26). The study was conducted in accordance with applicable institutional and national guidelines for the care and use of laboratory animals and the ARRIVE 2.0 guidelines for reporting in vivo experiments.
Competing interests
The authors declare that they have no commercial or financial relationships that could be construed as a potential conflict of interest.
Data availability statement
The data underlying the findings and the analysis scripts are available from the corresponding author upon reasonable request.
Originality and reporting statement
The data reported here have not been published previously and are not under consideration elsewhere. The authors will provide the data and supporting documentation to the editors on request and confirm adherence to the ARRIVE Essential 10.