
Introduction
Water temperature is a key environmental factor influencing survival, growth, metabolism, and physiological homeostasis in fish. As ectotherms, fish depend directly on ambient water temperature for body temperature regulation and metabolic activity. Consequently, conditions outside the optimal thermal range can increase the metabolic burden associated with oxygen demand, energy utilization, and the maintenance of physiological homeostasis. Acute or sustained exposure to high water temperatures can affect the neuroendocrine system and energy metabolism, and prolonged environmental stress can negatively affect growth, immune function, and survival.1–4 Changes in water temperature can also alter plasma metabolite levels and metabolic responses in cultured fish, and the magnitude of these responses may depend on both temperature and exposure duration.5,6
The starry flounder (Platichthys stellatus) is a cold-water flatfish distributed along the coasts of the North Pacific and is an important marine fish species cultured in Northeast Asia, including Korea. Owing to its physiological characteristics as a cold-water species, elevated summer water temperatures can become an important environmental factor affecting rearing stability and survival. A previous study reported that temperature fluctuations and nutritional status affect the survival and adaptive physiological responses in starry flounder. Thus, nutritional status should also be considered when evaluating thermal stress because temperature-related physiological changes may occur simultaneously with changes in energy availability.7 Previous studies on this species have identified age-related differences with regard to survival, plasma cortisol and glucose, and heat-shock gene expression under increasing temperatures.8 Comparative liver transcriptomics have linked heat exposure to changes in glycolysis/gluconeogenesis and heat-shock responses in juvenile and adult starry flounder.9
In fish, exposure to environmental stressors such as high water temperature or hypoxia elicits a series of physiological stress responses mediated by neuroendocrine and metabolic pathways. The primary stress response involves the release of stress hormones, including cortisol and catecholamines, whereas secondary responses involve changes in glucose and other blood biochemical parameters.1,2
Glucose is frequently used as an indicator of energy mobilization during stress; however, it can also be influenced by handling, nutritional status, and other experimental conditions. Therefore, physiological responses to high temperatures are better evaluated using multiple biochemical indicators rather than relying on a single stress marker such as glucose.10,11 Recent studies have supported the use of multiple plasma biochemical parameters to characterize thermal stress in fish. Short-term high-temperature exposure in juvenile blunt snout bream (Megalobrama amblycephala) resulted in time-dependent changes in alanine aminotransferase (ALT), aspartate aminotransferase (AST), alkaline phosphatase (ALP), total protein, albumin, and glucose levels. In particular, ALT and AST responses varied over the exposure period, indicating that biochemical responses to thermal stress can depend on exposure duration.12
Similar temporal responses have been observed in juvenile olive flounder, in which the duration of acute temperature exposure influences plasma metabolite levels and gene expression in the liver and brain. These findings suggest that physiological responses to elevated temperatures may depend on the temperature reached and on the duration and pattern of exposure.5
ALT, AST, ALP, and lactate dehydrogenase (LDH) levels can provide additional information on tissue metabolic status and physiological burden. LDH is associated with glycolysis and the conversion of pyruvate to lactate. Changes in LDH-related pathways have been observed under reduced oxygen availability in Japanese flounder, supporting the relationship between oxygen availability and glycolytic metabolism.13
Acute thermal stress has also been associated with changes in enzyme activity and energy distribution in fish muscles, further indicating that abrupt temperature changes can alter metabolic demands and energy utilization. However, because plasma AST and ALT activities are not specific to a single organ in fish, changes in their activities should be interpreted alongside other biochemical parameters rather than as direct evidence of damage to a particular tissue.14 Acute heat-stress experiments in spotted seabass have also identified size-dependent changes in plasma enzymes, glucose, and heat-shock responses, illustrating that physiological responses can differ among fish of different sizes.15
High water temperatures can also influence lipid and protein metabolism. Total cholesterol and triglycerides provide information on lipid storage and mobilization, whereas total protein and albumin provide supplementary information on protein metabolism and nutritional status. Temperature influences muscle lipid metabolism in fish, whereas starvation and refeeding can independently alter growth, digestive function, and lipid metabolism-related gene expression.16,17
Dietary carbohydrate and lipid balance can also influence stress and physiological responses. Consequently, feeding and fasting status should be considered when interpreting lipid- and protein-related biochemical parameters under high-temperature conditions.18 Feeding status can modify thermal stress responses. Restricted feeding altered oxidative and endocrine responses during chronic heat exposure in channel catfish, whereas an acute temperature challenge in juvenile olive flounder affected several plasma biochemical parameters in a study investigating dietary gamma-aminobutyric acid. These findings support consideration of nutritional history when comparing thermal-stress experiments.19,20
Changes in water temperature are also closely associated with metabolic rate and oxygen demand. Respirometry studies have demonstrated temperature-dependent changes in oxygen consumption and metabolic status in fish, supporting the close relationship between thermal conditions and respiratory metabolism.3,21
Total blood carbon dioxide (TCO₂), which exists predominantly in bicarbonate-related forms, may provide supplementary information on acid–base balance and respiratory metabolic status; however, TCO₂ alone cannot identify specific changes in ventilation or CO₂ excretion and should be interpreted alongside other biochemical or blood-gas parameters, where available.
Thermal stress can also involve oxidative and immune pathways, making antioxidant and immune-related measurements useful complements to plasma metabolic indices.22 Recent experiments in Monopterus albus, Gymnocypris eckloni, and Micropterus salmoides have reported changes in antioxidant, inflammatory, or immune-related responses under elevated-temperature conditions; however, these responses depend on the exposure regime and measured biological compartment.23–25
Heat shock proteins contribute to cellular protein homeostasis during environmental stress, and their transcriptional responses provide a molecular complement to circulating stress indicators.26,27 A recent study on farmed fish exposed to heat treatment in a recirculating aquaculture system reported changes in heat-shock and cytokine transcripts, emphasizing the value of combining molecular and physiological measurements.28
Physiological responses to elevated temperatures vary depending on temperature, heating rate, and exposure duration. As these factors may interact, comparisons among exposure regimes should account for the full temperature profile rather than a single component of it.5,7,12
Although previous studies have examined short-term thermal stress, exposure duration, temperature fluctuations, and associated metabolic responses in several fish species, relatively few studies have directly compared acute and gradual high-temperature exposure within the same experimental system while simultaneously evaluating multiple plasma biochemical pathways. This distinction is particularly relevant in aquaculture environments, where fish may experience both abrupt thermal events and gradual increases in water temperature.5,7,12
In the present study, starry flounder were assigned to control, gradual high-temperature exposure, and acute high-temperature exposure groups, and plasma biochemical changes were compared among these groups. ALT, AST, ALP, and LDH levels were analyzed, along with glucose, total cholesterol, triglyceride, lipase, total protein, albumin, and TCO₂. The objectives were to characterize survival and plasma biochemical, endocrine, immune-related, and heat-shock responses in starry flounder across three specified temperature regimes, and to identify biochemical variables warranting further evaluation as indicators of high-temperature exposure.
Materials and methods
Experimental fish and acclimation
A total of 140 starry flounder were used in this study. Twenty fish were allocated to the initial sampling group to establish their baseline physiological status. The remaining 120 fish were randomly assigned to one of three treatment groups: control, gradual high-temperature exposure, or acute high-temperature exposure. Each treatment comprised two replicate tanks, with 20 fish per tank, for a total of 40 fish per treatment group. The mean body weight and total length of the experimental fish were approximately 100.0 ± 10.8 g and 20 cm, respectively. After introduction into the experimental tanks, fish were acclimated for 110 h (approximately 5 days) in 60-L rectangular recirculating tanks at 20.0 ± 0.2°C or below, under a 12:12 h light:dark photoperiod, with the water circulation rate maintained at 1,200% per day. The fish were fasted throughout the experimental period until final sampling. Twenty fish in the initial sampling group were used for dissection and blood collection to establish the baseline physiological status, whereas the remaining 120 fish were used in the temperature-exposure trial.
Experimental design and high-temperature exposure
To compare physiological responses to different patterns of high-temperature exposure, the fish were assigned to three experimental groups: control, gradual high-temperature exposure, and acute high-temperature exposure. Each treatment was independently replicated in two tanks, with 20 fish per tank and 40 fish assigned to each treatment group. The control group was maintained at a water temperature of 20°C or below throughout the experimental period. In the gradual high-temperature exposure group, the water temperature was raised stepwise over approximately 110 h to 26–27°C. The acute high-temperature exposure group was maintained under the same conditions as the control group and then exposed to 29°C for 6 h immediately before the final blood sampling. The gradual high-temperature exposure group was designed to simulate a sustained temperature increase that could occur over several days under aquaculture conditions, whereas the acute high-temperature exposure group was designed to assess the biochemical response to an abrupt temperature rise occurring over a short period.
Blood collection and plasma separation
To assess the baseline plasma biochemical status of the starry flounder before high-temperature treatment, initial sampling was performed 2 d after tank introduction. Twenty fish were allocated to the initial sampling group, and samples collected from 10 fish were used for biochemical analysis and subsequent statistical evaluation (n = 10). Fish were anesthetized using 200 mg/L MS-222 (tricaine methanesulfonate), after which the total length and body weight were measured. Approximately 2 mL of blood was collected from the caudal vein using 3-mL EDTA-treated syringes. Blood samples were chilled immediately after collection and centrifuged at 4,000 × g for 10 min at 4°C to separate plasma, which was stored at −80°C until biochemical analysis.
Final sampling was performed 5 days after the start of the experiment in the control, gradual high-temperature exposure, and acute high-temperature exposure groups, following the same anesthesia, blood collection, and plasma separation procedures used for initial sampling.
Plasma biochemical analysis
Plasma biochemical analysis was performed using the FUJI DRI-CHEM system (Fujifilm, Tokyo, Japan) to evaluate physiological changes in starry flounder in response to high-temperature exposure. Eleven plasma biochemical indices were measured: ALT, AST, ALP, LDH, glucose, total cholesterol, total protein (TP), triglyceride, albumin, TCO₂, and lipase. ALT, AST, ALP, and LDH levels were analyzed as indices of tissue-level metabolic burden and changes in enzyme activity. Glucose was used to assess the carbohydrate-based energy mobilization response to stress, and total cholesterol and triglycerides were used to evaluate lipid metabolism and energy storage status. Total protein and albumin served as auxiliary indices of protein and nutritional metabolic status, while TCO₂ served as an auxiliary index of acid–base and respiratory metabolic status. Lipase was included to assess the changes in lipid-related enzyme activity. Samples with values falling outside the analyzer’s measurement range or for which an instrument error was identified were reanalyzed. Results that remained outside the quantifiable range after reanalysis were interpreted with consideration of the analyzer’s measurement limits.
ELISA measurement of plasma stress-, metabolic-, oxidative-, and immune-related parameters
Plasma catalase, glucose, cortisol, and immunoglobulin M (IgM) concentrations were measured using fish-specific ELISA kits (MyBioSource, Inc., San Diego, CA, USA), according to the manufacturer’s instructions. Plasma samples were analyzed without dilution in triplicate, and the mean of the three technical replicates was used as the value for each fish. Three fish per group were analyzed for each assay (n = 3). Assay detection ranges, sensitivities, and intra- and inter-assay coefficients of variation were determined according to the respective manufacturers’ instructions.
Relative expression analysis of heat shock protein genes
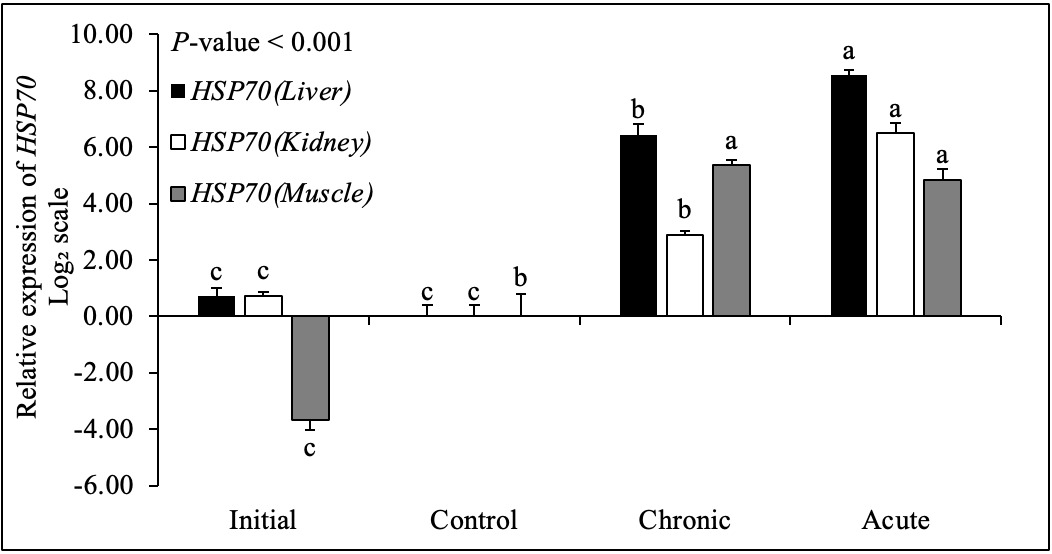
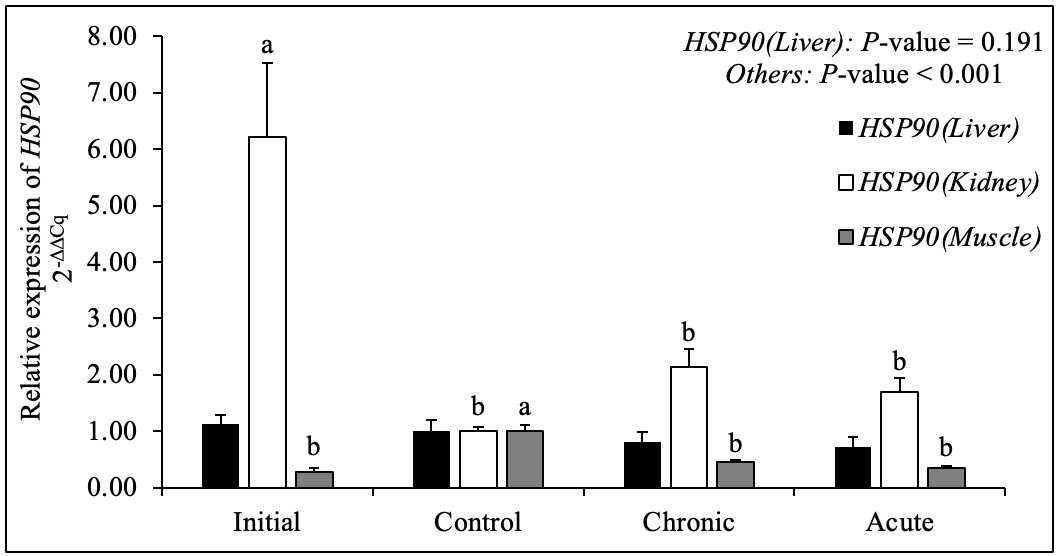
Total RNA was extracted from the liver, kidney, and muscle tissues of starry flounder using TRIzol reagent (Invitrogen, Carlsbad, CA, USA). Briefly, each tissue sample was homogenized in 1 mL TRIzol reagent, mixed with 200 μL chloroform, and incubated at −20°C for 5 min. After centrifugation at 12,000 rpm for 15 min at 4°C, the aqueous phase was collected, mixed with an equal volume of isopropanol, and incubated at room temperature for 10 min. Following a second centrifugation, the supernatant was discarded, and the RNA pellet was washed with 100 μL 80% ethanol. After complete removal of the ethanol, the RNA pellet was dissolved in 100 μL diethyl pyrocarbonate-treated water. To eliminate genomic DNA contamination, the extracted RNA was treated with DNase I (Qiagen, Hilden, Germany). RNA concentration and purity were assessed using a NanoDrop One C spectrophotometer (Thermo Fisher Scientific, Waltham, MA, USA), and RNA integrity was evaluated using 1% agarose gel electrophoresis. Complementary DNA (cDNA) was synthesized from the purified RNA using PrimeScript RT Master Mix (TaKaRa Bio Inc., Shiga, Japan) and stored at −80°C until analysis. Relative mRNA expression levels of heat shock protein 70 (HSP70) and heat shock protein 90 (HSP90) were evaluated using a CronoSTAR 96 Real-Time PCR System (TaKaRa Bio Inc.). Each 25-μL reaction mixture contained 1.6 μL each of forward and reverse primers (10 pM), 1 μL cDNA, 6.8 μL sterile water, and 14 μL TB Green Premix Ex Taq (Tli RNaseH Plus; TaKaRa Bio Inc.). The thermocycling conditions were 94°C for 30 s followed by 40 cycles of 94°C for 30 s, 60°C for 30 s, and 72°C for 30 s. Glyceraldehyde-3-phosphate dehydrogenase (GAPDH) was used as the reference gene. Primer sequences, GenBank accession numbers, and expected amplicon sizes are listed in Table 2. For each tissue, GAPDH-normalized expression in the control group was used as a calibrator. Relative expression was calculated using the 2-ΔΔCq method, where ΔCq = Cq(target gene) − Cq(GAPDH) and ΔΔCq = ΔCq(sample) − mean ΔCq(control).29 For graphical presentation, HSP70 values are expressed as log2 fold change (−ΔΔCq), whereas HSP90 values are expressed as untransformed relative fold change (2−ΔΔCq); 0 on the log2 scale and 1 on the untransformed scale correspond to the control calibrator. Three fish from each treatment group were analyzed as biological replicates (n = 3).
Statistical analyses
Statistical analyses were performed using IBM SPSS Statistics, version 32.0. One-way analysis of variance (ANOVA) was used to evaluate differences among treatment groups for plasma biochemical, ELISA, and gene expression data. When the treatment effect was significant, Tukey’s honestly significant difference test was used for post hoc comparisons. Cumulative survival was evaluated using the log-rank test and Fisher’s exact test, as indicated for survival analysis. Statistical significance was set at p < 0.05. Results are presented as the mean ± standard error of the mean.
Results
Survival and biological indices
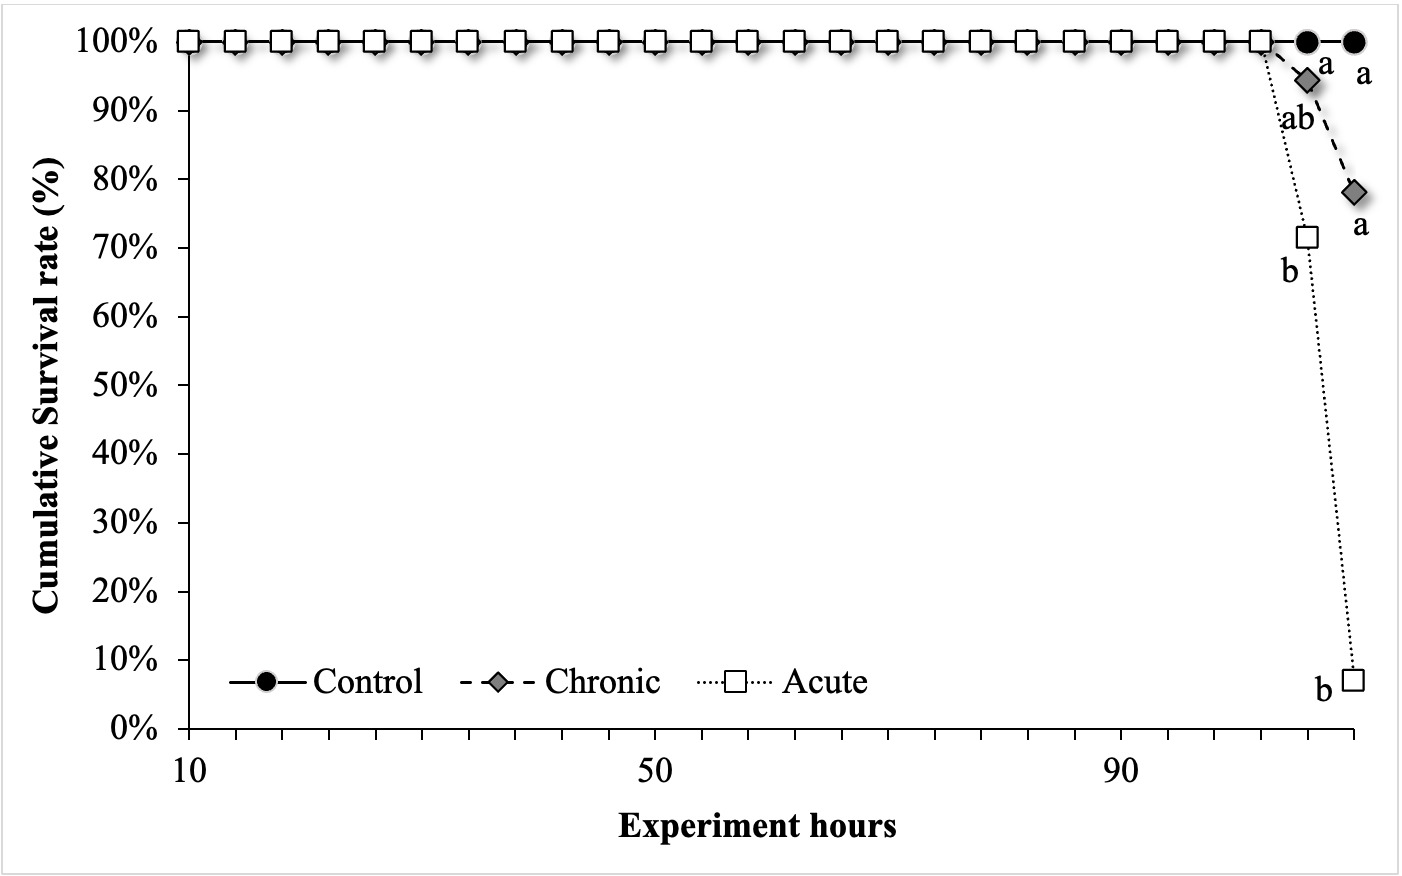
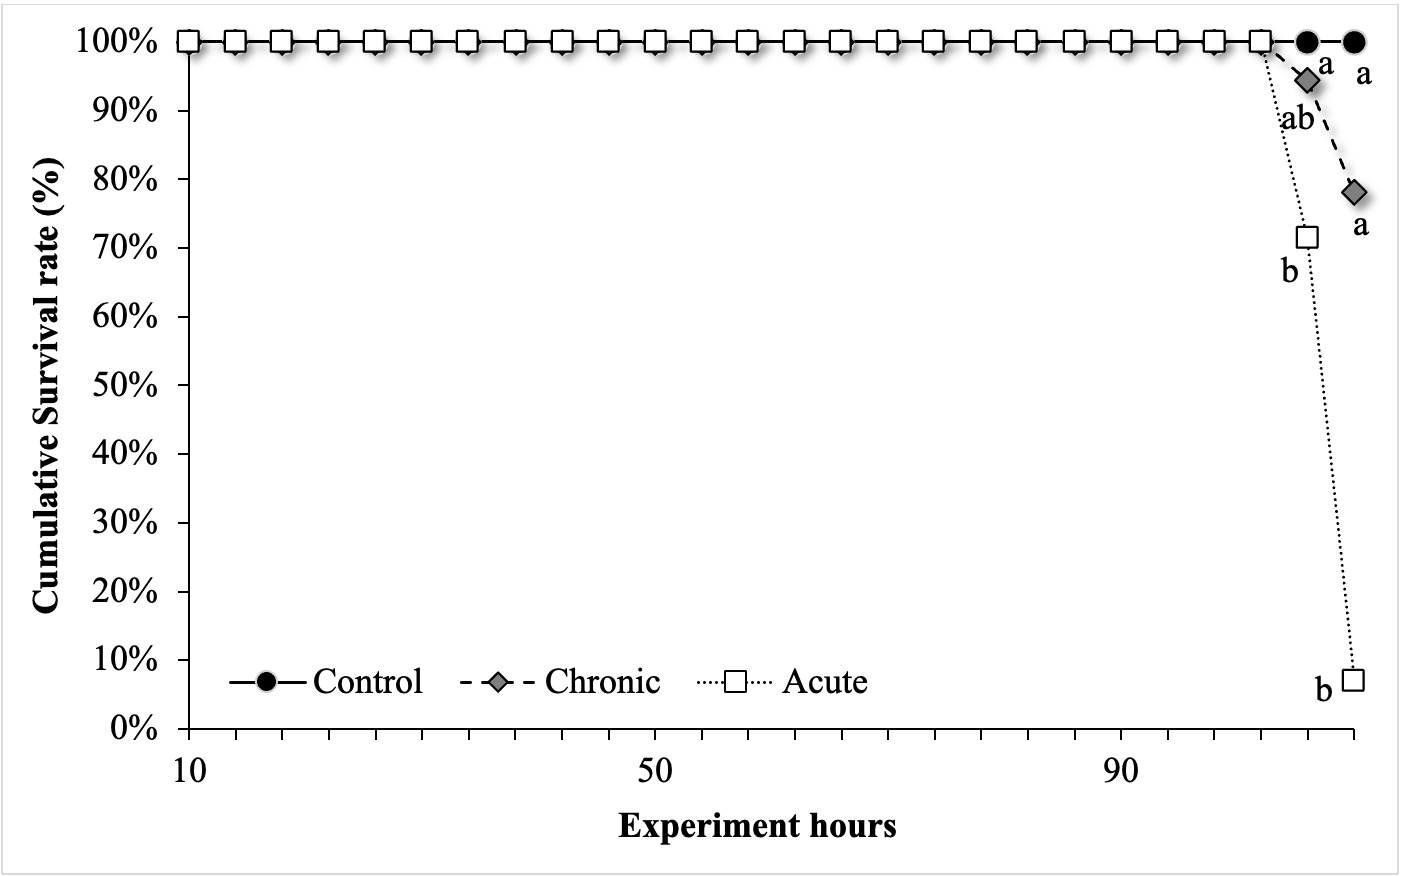
In the control group, survival was 100% at the end of the 110-h experimental period. Mortality occurred progressively in the gradual high-temperature group, whereas a marked decline in survival was observed near the end of exposure in the acute high-temperature group (Fig. 1). The final survival rates were 100% in the control group, 77.5% in the gradual group, and 7.5% in the acute group. Survival was significantly lower in the acute group than in the control and gradual groups (p < 0.05). The hepatosomatic index was 1.03% ± 0.21% in the control group, 1.27% ± 0.29% in the gradual group, and 1.15% ± 0.12% in the acute group, with no significant differences among treatments (p > 0.05; Table 1).
Changes in plasma enzymes activities related to tissue metabolism
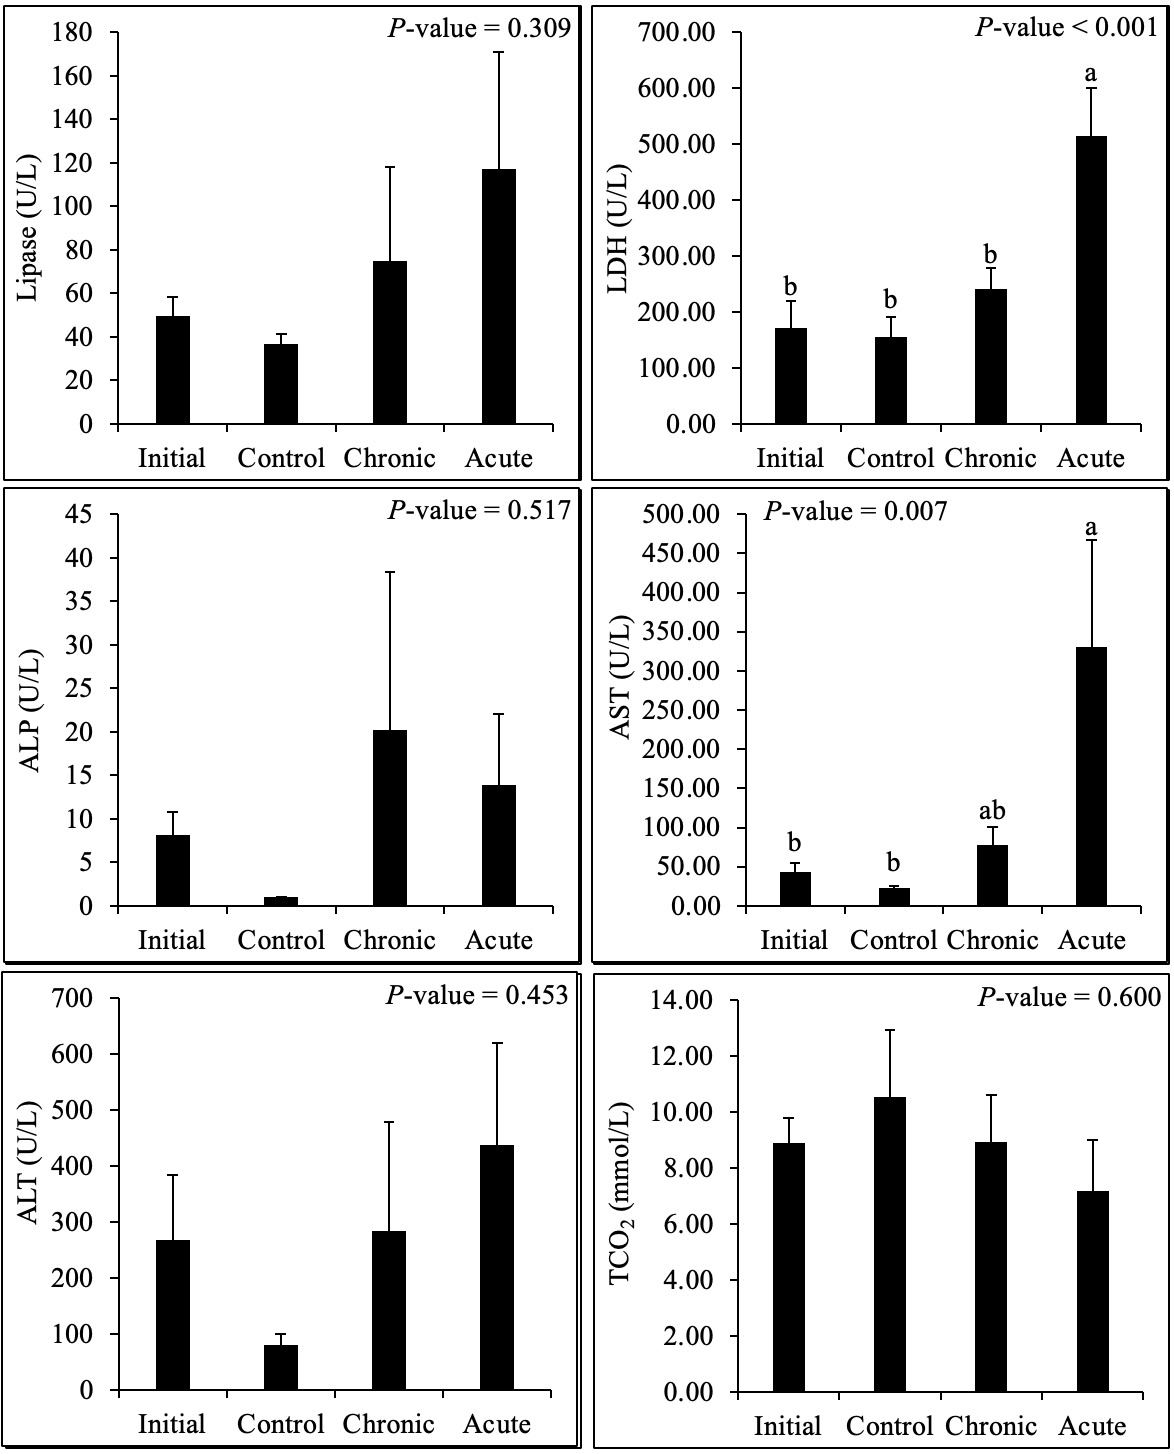
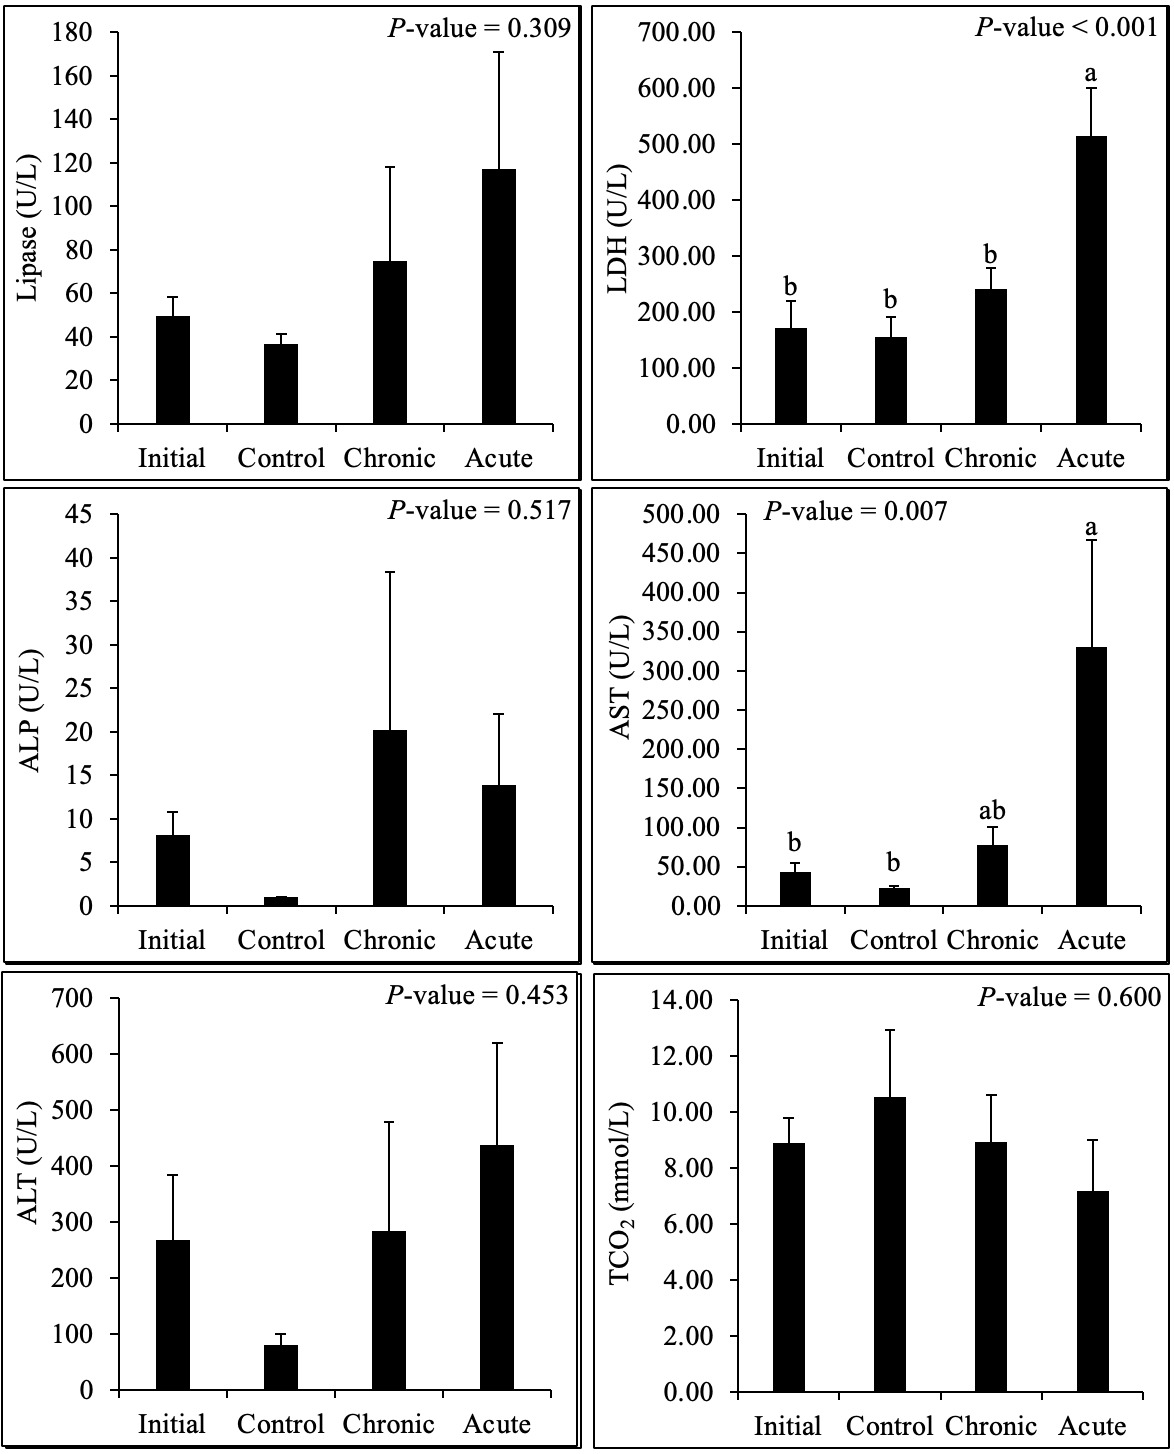
Plasma ALT activity was 80.67 ± 18.59 U/L in the control group, 283.50 ± 195.01 U/L in the gradual group, and 437.00 ± 183.02 U/L in the acute group. Although the mean ALT activity was numerically highest in the acute group, the overall difference between groups was not statistically significant (p > 0.05). Several ALT measurements were above the quantifiable range of the DRI-CHEM analyzer, contributing to the large within-group variation and limiting the interpretation of the absolute values. Plasma AST activity increased from 23.00 ± 1.88 U/L in the control group to 78.00 ± 23.21 U/L in the gradual group and 330.83 ± 136.14 U/L in the acute group. AST activity was significantly higher in the acute group than in the control group (p < 0.05), whereas that in the gradual group did not differ significantly from either group. ALP activity was 1.00 ± 0.00 U/L, 20.17 ± 18.17 U/L, and 13.83 ± 8.24 U/L in the control, gradual, and acute groups, respectively, with no significant treatment effect (p > 0.05). Because most ALP measurements were close to the lower detection limit, this variable’s ability to discriminate between treatments was limited. LDH activity was significantly affected by treatment, increasing from 155.67 ± 36.14 U/L in the control group and 240.67 ± 38.08 U/L in the gradual group to 515.17 ± 85.85 U/L in the acute group. The LDH activity was significantly higher in the acute group than in the control and gradual groups (p < 0.05), whereas the control and gradual groups did not differ significantly (Fig. 2).
Changes in plasma indices related to carbohydrate and lipid metabolism
Plasma glucose concentration was 25.50 ± 1.61 mg/dL in the control group, 110.83 ± 16.05 mg/dL in the gradual group, and 156.50 ± 41.12 mg/dL in the acute group. Both high-temperature groups had significantly higher glucose concentrations than the control group (p < 0.05), whereas the glucose concentrations in the gradual and acute groups did not differ significantly from each other. Total cholesterol concentrations were 113.17 ± 6.49, 155.00 ± 14.53, and 117.83 ± 10.82 mg/dL in the control, gradual, and acute groups, respectively. No significant treatment-related differences were detected (p > 0.05). Triglyceride concentrations were numerically higher in the gradual and acute groups than in the control group (88.67 ± 11.32, 84.17 ± 10.68, and 59.00 ± 4.23 mg/dL, respectively), but the overall group difference was not significant (p > 0.05). Lipase activity was 36.83 ± 4.38 U/L in the control group, 75.00 ± 43.20 U/L in the gradual group, and 117.00 ± 54.13 U/L in the acute group. Although the mean lipase activity increased numerically across the temperature regimes, the difference was not statistically significant (p > 0.05), and the variability was substantial in both high-temperature groups (Fig. 2).
Changes in plasma indices related to protein metabolism and acid–base balance
Total protein concentrations were 3.65 ± 0.40 g/dL in the control group, 4.97 ± 0.94 g/dL in the gradual group, and 3.40 ± 0.31 g/dL in the acute group. Albumin concentrations were 1.22 ± 0.14, 1.27 ± 0.08, and 1.33 ± 0.17 g/dL, respectively. The total protein and albumin levels did not differ significantly among the treatment groups (p > 0.05). TCO₂ concentrations were 10.53 ± 2.41 mmol/L in the control group, 8.92 ± 1.68 mmol/L in the gradual group, and 7.17 ± 1.82 mmol/L in the acute group. Although the mean TCO₂ concentration was numerically lower in the high-temperature groups, particularly in the acute group, the overall treatment effect was not significant (p > 0.05). Therefore, these data do not independently demonstrate alterations in blood acid–base regulation.
Plasma stress-, oxidative-, and immune-related indices
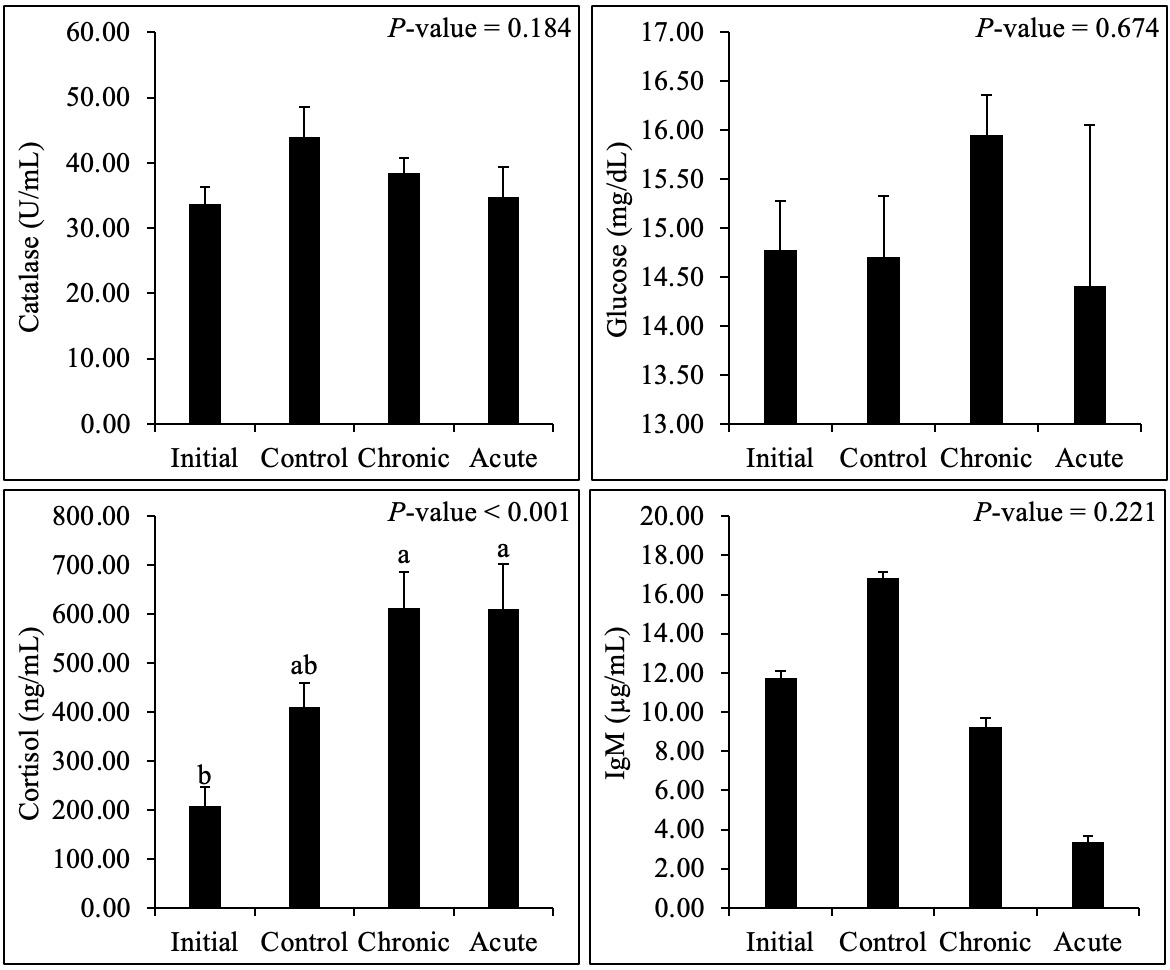
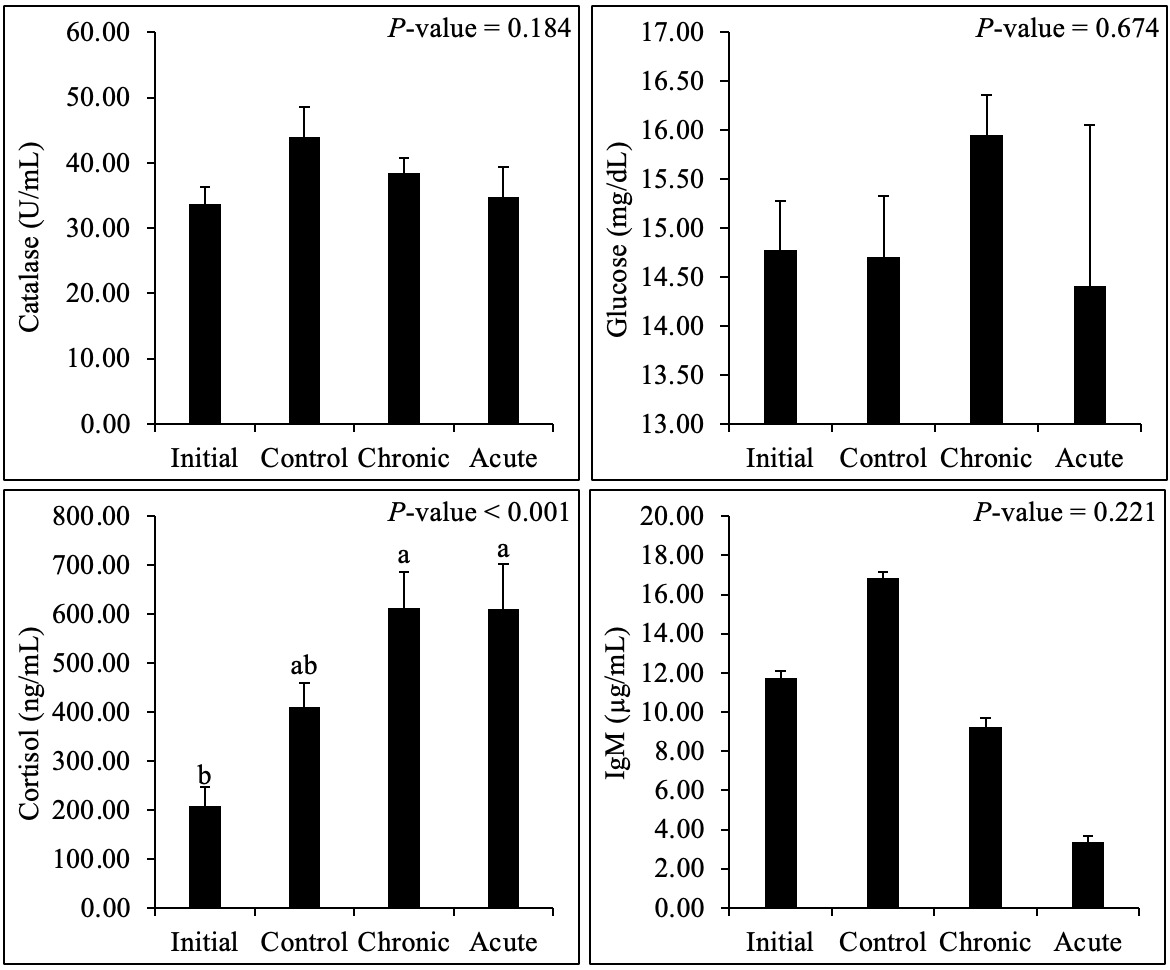
ELISA measurements showed no significant differences in plasma catalase or glucose concentrations among the groups (both p > 0.05; Fig. 3; Table 1). Catalase concentrations were 43.90 ± 4.64 U/mL in the control group, 38.41 ± 2.30 U/mL in the gradual group, and 34.79 ± 4.55 U/mL in the acute group. ELISA-based glucose concentrations were 14.70 ± 0.63, 15.95 ± 0.41, and 14.41 ± 1.64 mg/dL, respectively. Plasma cortisol concentrations differed significantly among the groups (overall, p < 0.001). Cortisol concentrations were significantly higher in the gradual and acute groups than in the initial group, whereas the final control group did not differ significantly from either the initial or the high-temperature groups. Mean IgM concentrations decreased from 16.87 ± 0.29 µg/mL in the control group to 9.25 ± 0.44 µg/mL in the gradual group and 3.35 ± 0.33 µg/mL in the acute group. Although plasma IgM concentrations decreased numerically following high-temperature exposure, the differences among groups were not statistically significant (p > 0.05; Fig. 3; Table 1).
Heat shock protein gene expression
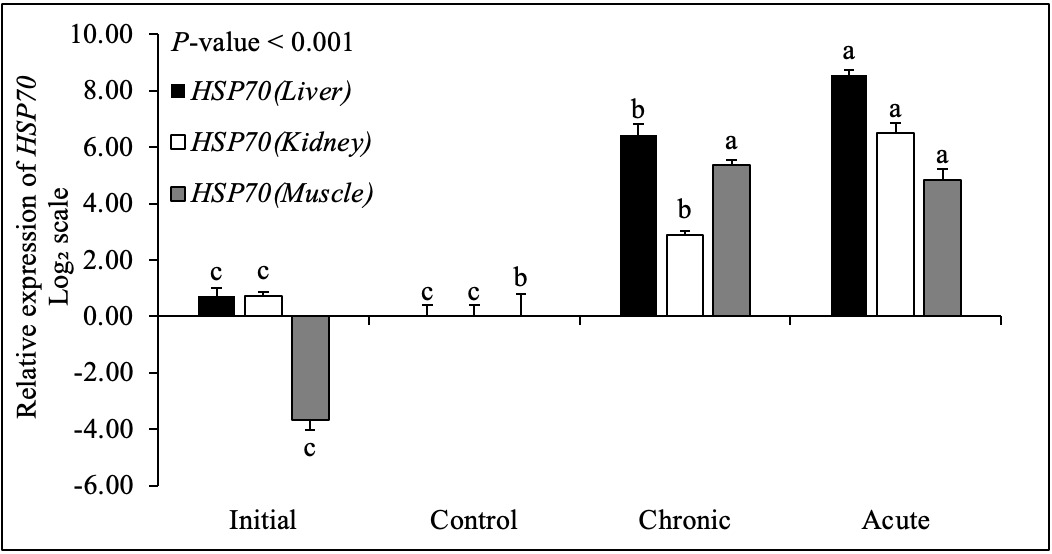
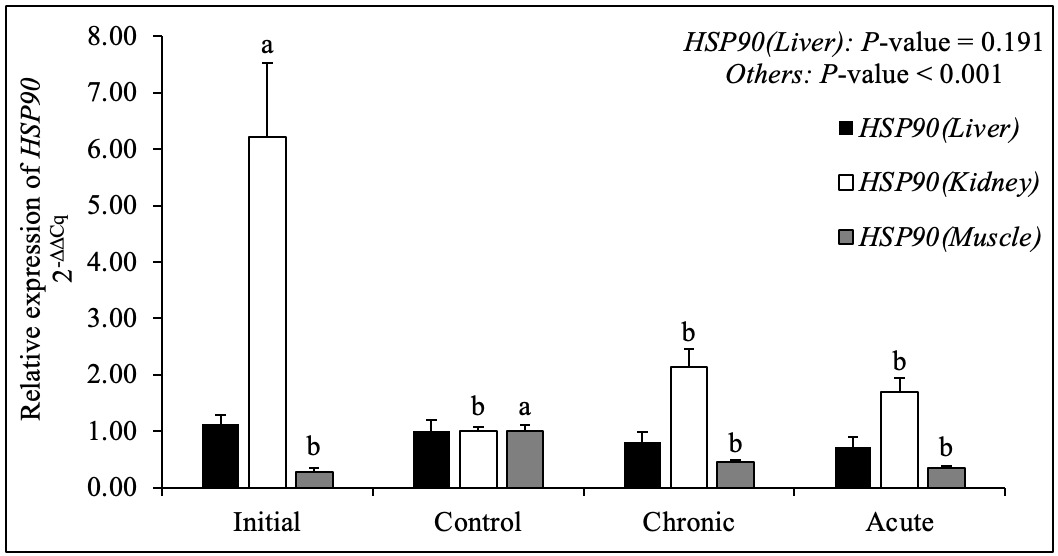
HSP70 expression differed significantly among the treatment groups in the liver, kidney, and muscle (overall, p < 0.001 for each tissue; Fig. 4). Expression was elevated under high-temperature conditions, with the highest levels observed in the liver and kidneys of the acute group. Pairwise differences among groups are indicated by different superscript letters in Fig. 4. HSP90 expression varied by tissue type (Fig. 5). Liver HSP90 expression did not differ significantly among the groups (p = 0.191), whereas significant treatment effects were detected in the kidney and muscle (overall, p < 0.001 for both tissues). These findings indicated that HSP90 responses were tissue-dependent. Primer sequences, accession numbers, and expected amplicon sizes are listed in Table 2.
Discussion
This study evaluated the effects of different modes of high-temperature exposure on biological indices and plasma biochemical characteristics of starry flounder. Although responses varied among indices, high-temperature treatment was associated with changes in several parameters, including glucose, AST, LDH, lipase, and TCO₂, with some responses being particularly pronounced in the acute high-temperature group. These findings suggest that the high-temperature response of starry flounder depends not only on the maximum temperature reached but also on the rate of temperature increase and exposure duration. A summary of the biological indices and plasma biochemical parameters is presented in Table 1.
When exposed to environmental changes, fish exhibit stress responses mediated by the neuroendocrine system that can alter energy metabolism and blood biochemical parameters. Glucose is one of the most widely used indicators of the secondary stress response in fish, and its blood concentration may increase to meet the elevated energy demands of stress. In the present study, glucose concentrations tended to increase progressively across the control, gradual high-temperature, and acute high-temperature groups, with the highest levels observed in the acute high-temperature group. This pattern suggests that energy mobilization may have increased in response to the abrupt rise in water temperature.1,2 Previous studies on starry flounder have identified temperature-associated cortisol and glucose responses, as well as changes in liver glycolysis/gluconeogenesis pathways.8,9 Therefore, the glucose response observed in this study is broadly consistent with previous evidence of altered energy metabolism under high-temperature conditions.
Similarly, the AST and ALT levels were relatively high in the high-temperature treatment groups, particularly in the acute group. These enzymes have been used in fish studies as biochemical indices to assess environmental stress and tissue-level physiological changes; however, as AST and ALT are not found exclusively in specific organs, it is not appropriate to conclude that increased plasma activity directly indicates liver damage. Accordingly, the increases in AST and ALT levels observed in the present study are more appropriately interpreted as indirect changes reflecting the systemic metabolic burden or tissue-level physiological disturbances associated with the abrupt rise in water temperature. Because histopathological analysis and tissue-specific enzyme activity measurements were not performed in the present study, damage to specific organs could not be directly confirmed. Size-dependent enzyme and heat-shock responses in spotted sea bass further show that plasma enzyme changes should be interpreted within experimental and biological contexts.15
LDH levels also tended to increase in the high-temperature treatment groups, with relatively high values observed in the acute high-temperature group. As a glycolytic enzyme that catalyzes the interconversion of pyruvate and lactate, LDH responds sensitively to shifts in the oxygen utilization and energy production pathways. Under high-temperature conditions, fish metabolic rate and oxygen demand can increase, which in turn may increase the burden on energy metabolism.3 The upward trend in LDH observed in this study is therefore considered to reflect a possible increase in glycolytic activity and overall energy metabolic demand in starry flounder under high-temperature conditions. Notably, the concurrent increase in AST, ALT, and LDH levels in the acute high-temperature group suggests that a rapid temperature increase may impose a tissue-level metabolic burden more rapidly than a gradual one. Changes in LDH-related pathways under hypoxic conditions and enzyme activity during acute thermal stress have also been reported in other fish species.13,14
Lipase activity tended to increase in the high-temperature treatment groups; however, this finding does not directly demonstrate increased lipid digestion or mobilization of stored body fat. Because plasma lipase activity can be influenced by various metabolic factors, these findings should be interpreted with caution and treated as supplementary evidence that lipid-related enzyme activity may change in response to high-temperature exposure. Future studies incorporating analyses of tissue lipid content, fatty acid composition, and expression of genes related to lipid metabolism may provide a clearer understanding of the changes in lipid metabolism induced by high-temperature exposure.
TP and albumin levels did not differ significantly among the treatment groups. These parameters can be influenced by various physiological factors, including nutritional status, protein synthesis and degradation, and liver function, and their responses to short-term environmental changes may be less pronounced than those of acute stress-related indicators such as glucose. Moreover, because all experimental groups were fasted under identical conditions, external nutrient supply did not differ among groups. Therefore, the absence of clear changes in TP and albumin levels should not be interpreted as evidence that high temperatures had no effect. Rather, it suggests that changes in plasma protein levels may not have been detectable during the short exposure period under uniform fasting conditions. Feed restriction experiments in channel catfish have demonstrated that feeding conditions can modulate heat-associated endocrine and oxidative responses. This supports considering fasting as part of the experimental context rather than attributing all biochemical changes solely to temperature.19
TCO₂ tended to decrease in the high-temperature treatment groups compared with the control group. Because TCO₂ in the blood exists predominantly in forms that include bicarbonate, it can be used as an indirect indicator related to acid–base balance and respiratory metabolism. As water temperature increases, fish metabolic rate and oxygen demand may rise, potentially altering respiratory activity and acid–base regulation, which in turn may affect blood TCO₂ levels. Because blood pH, pCO₂, bicarbonate, and lactate levels were not measured directly in the present study, the precise physiological mechanism underlying the decrease in TCO₂ could not be determined. Therefore, these findings are more appropriately interpreted as supplementary evidence suggesting that changes related to acid–base regulation or respiratory metabolism may have occurred under high-temperature conditions. Temperature-dependent changes in oxygen consumption and metabolic status, as observed by respirometry, further support the close relationship between thermal conditions and respiratory metabolism.21
A notable finding of the present study was that changes in several plasma biochemical parameters were greater in the acute high-temperature exposure group than in the gradual high-temperature exposure group. This suggests that the response of starry flounder to high temperature may depend not only on temperature itself but also on the rate of temperature increase and exposure duration. During acute high-temperature exposure, metabolic demand and stress responses may increase rapidly before fish have sufficient time to acclimate, whereas gradual increases in water temperature may allow some degree of physiological acclimation or compensatory response. Previous studies on starry flounder have also reported that survival and physiological responses may vary with temperature change patterns and nutritional status.7 The relatively higher levels of glucose, AST, and LDH observed in the acute high-temperature exposure group in the present study support the need to consider not only the final water temperature but also the rate of temperature increase and exposure duration when evaluating high-temperature stress. Nevertheless, the gradual and acute heat treatments also differed in their final temperatures; this design did not isolate the independent contributions of heating rate, exposure duration, and final temperature.4
The cortisol and heat-shock protein results provide additional evidence that high-temperature exposure affects stress-related physiological pathways in starry flounder. Cortisol concentrations were elevated in both high-temperature groups, whereas expression of HSP70 differed significantly among the treatment groups in all three tissues, and HSP90 varied by tissue (Figs. 3–5). These responses should be interpreted alongside plasma biochemical changes, which indicate that thermal exposure is accompanied by endocrine and molecular stress responses, as well as changes in circulating metabolites and enzymes. Heat-shock protein transcript responses reported in spotted seabass and heat-treated farmed fish provide useful comparisons, although increased transcript abundance alone does not establish successful physiological protection.15,28
The absence of a significant difference in plasma catalase levels and the reported non-significant IgM response should not be interpreted as an absence of oxidative or immune effects. Studies in G. eckloni and M. albus measured tissue, inflammatory, and immune responses that are not directly comparable to the plasma endpoints assessed here.23,24 Similarly, the largemouth bass study examined multiple oxidative, immune, and histological endpoints during chronic heat exposure.25 A broader assessment of immune effects would therefore require additional functional or tissue-level measurements.22
Some limitations should be considered when interpreting the findings of the present study. First, plasma biochemical analyses were performed using the FUJI DRI-CHEM system. For some parameters, values either exceeded the instrument’s measurement range or were close to the lower detection limit. Therefore, the analyzer’s measurement range and sensitivity should be considered when interpreting the absolute values of certain parameters and differences among treatment groups. Second, because all experimental fish were maintained under fasting conditions, it was difficult to distinguish completely between the metabolic changes induced by high-temperature exposure and those caused by fasting. Third, the gradual high-temperature exposure period was relatively short (approximately 110 h), limiting the assessment of complete physiological acclimation or chronic metabolic changes associated with long-term high-temperature exposure. Thus, the treatment is more appropriately described as gradual high-temperature exposure rather than chronic exposure in the strict sense. The interpretation of blood-based indicators also depends on analytical performance and sampling conditions, supporting the need for assay-specific validation when different methods produce discordant values.11
In addition, as the present study focused primarily on plasma biochemical parameters, the tissue- and molecular-level mechanisms underlying the response to high-temperature exposure could not be elucidated directly. Cortisol concentrations were compared between the baseline and treatment groups at the final sampling point. In contrast, HSP70 and HSP90 expression was evaluated only at the final sampling point using a limited number of biological replicates; therefore, the temporal patterns of the heat-shock response during gradual and acute high-temperature exposure could not be fully characterized. Furthermore, the changes in HSP70 and HSP90 mRNA expression were not validated at the protein level. Future studies incorporating multiple sampling time points, larger biological sample sizes, and protein-level analyses could provide a more comprehensive understanding of the thermal stress response in starry flounder. Histopathological analyses of tissues, such as the liver, gills, and muscles, could help clarify the physiological significance of changes in plasma enzymes, such as AST, ALT, and LDH. Long-term high-temperature experiments that include both fed and fasted groups could also provide a more systematic evaluation of the interactions between water temperature and nutritional status, and their effects on energy metabolism and survival in starry flounder.
Conclusions
The plasma biochemical responses of starry flounder to high-temperature exposure varied among parameters. Glucose and several metabolic enzymes appeared relatively responsive to rapid increases in water temperature, whereas changes in lipid- and protein-related parameters were limited given the short experimental duration and fasting conditions. Together with the survival, cortisol, and heat-shock protein responses, changes in glucose, AST, LDH, lipase, and TCO₂ may serve as candidate plasma biochemical indicators of physiological responses to high-temperature exposure. Further experiments incorporating tissue- and molecular-level analyses are required to verify the reproducibility and physiological significance of these findings.
Acknowledgements
The authors sincerely thank Dr. Il-Young Lee of Marine Seed for providing the starry flounder used in this experiment. This research was supported by the Ministry of Education of the Republic of Korea and the National Research Foundation of Korea (NRF-2020S1A6A3A01109908).
Author Contributions
Methodology: Da-Been Baek (Supporting), Hyeonji Yoo (Supporting), Jeong-Hyeon Cho (Lead). Validation: Da-Been Baek (Supporting), Jeong-Hyeon Cho (Lead). Formal Analysis: Da-Been Baek (Equal), Hyeonji Yoo (Equal), Jeong-Hyeon Cho (Supporting). Investigation: Da-Been Baek (Equal), Hyeonji Yoo (Equal). Data curation: Da-Been Baek (Equal), Hyeonji Yoo (Equal). Writing – original draft: Da-Been Baek (Equal), Hyeonji Yoo (Equal). Visualization: Da-Been Baek (Lead), Hyeonji Yoo. Conceptualization: Jeong-Hyeon Cho (Lead). Resources: Jeong-Hyeon Cho (Lead). Writing – review & editing: Jeong-Hyeon Cho (Lead). Supervision: Jeong-Hyeon Cho (Lead). Project administration: Jeong-Hyeon Cho (Lead). Funding acquisition: Jeong-Hyeon Cho (Lead).
Conflict of Interest
The authors declare that they have no known competing financial interests or personal relationships that could have appeared to influence the work reported in this paper.
ETHICAL CONDUCT APPROVAL – IACUC
All experimental procedures involving animals were performed in compliance with institutional and international ethical standards for the use of experimental animals, including the ARRIVE guidelines. The study protocol was reviewed and approved by the Institutional Animal Care and Use Committee (IACUC) of Mokpo National University, Republic of Korea (Approval Code: MNU-IACUC-2025-018).
Attestation Statement
The statement regarding concomitant participation in other randomized trials is not applicable because this study involved experimental animals rather than human participants. Data related to any of the animals included in this study have not been published previously. All study and manuscript data will be made available to the journal editors upon reasonable request, either before or after publication, for review or clarification. The authors followed the ARRIVE 2.0 guidelines for reporting animal research.
Data Sharing Statement
The datasets generated and/or analyzed during the current study are not publicly available in a data repository but are available from the corresponding author upon reasonable request. All data necessary to evaluate the conclusions of the study will also be made available to the journal editors upon request.
Declaration of Generative AI Usage
No generative AI or AI-assisted technologies were used in the preparation of this manuscript.