
Introduction
Against the backdrop of fisheries multifunctionalization and upgrading consumption structures, freshwater fisheries are gradually evolving from a single production-oriented system centered on aquatic product supply1 into a composite system integrating production, ecological, and recreational service functions.2 Through technological progress and factor intensification, freshwater aquaculture has continuously improved production efficiency and constitutes a fundamental pillar for ensuring the stable supply of aquatic products and fisheries security.3 Meanwhile, recreational fisheries, developed on aquaculture waters, fisheries culture, and ecological landscapes, have emerged as an important pathway for promoting fisheries transformation and upgrading, expanding fishers’ livelihoods, and fostering regional economic diversification.4 At the global scale, this multifunctional transition is also regarded as a critical lever for the coordinated advancement of key goals in the United Nations 2030 Agenda for Sustainable Development, including food security (SDG 2), decent work and economic growth (SDG 8), and the conservation and sustainable use of aquatic ecosystems (SDG 14).
However, within the same freshwater waters and spatial units, the coexistence of production and recreational functions implies that improvements in freshwater aquaculture efficiency do not necessarily translate into synergies with recreational fisheries. High-intensity development may amplify system mismatch risks through spatial crowding, ecological disturbance, and land- and water-use conflicts.5 Consequently, achieving the relevant sustainable development objectives hinges not on the rapid expansion of a single function, but rather on the appropriate adaptation and co-evolution among different functional systems.
A substantial body of research has examined the development of recreational fisheries and the efficiency of freshwater aquaculture. On the one hand, studies on recreational fisheries have primarily focused on industrial scale,6 functional structure,7 spatial distribution,8 and their impacts on regional economies and ecosystems,9 highlighting the role of recreational fisheries in fisheries multifunctional transformation,10 the diversification of fishers’ livelihoods,11 and the integration of fisheries with tourism and leisure activities.12 On the other hand, research on freshwater aquaculture efficiency has emphasized technological progress13 and the measurement of production efficiency under constraints related to factor allocation and environmental regulation,3 with particular attention to the performance of aquaculture systems in ensuring supply security and improving resource-use efficiency.14
Despite these contributions, previous studies have largely examined recreational fisheries development and freshwater aquaculture efficiency as two separate subsystems. A comprehensive analysis of their synergistic relationship remains limited, especially one that integrates a multi-dimensional Adaptation framework with explainable machine learning to capture dynamic evolution, regional differentiation, and nonlinear driving mechanisms. This gap constrains a systematic understanding of the evolutionary dynamics of multifunctional freshwater fisheries systems.
Accordingly, using provincial-level data from China for 2008–2023, this study constructs a composite index of recreational fisheries development and evaluates freshwater aquaculture efficiency within a unified analytical framework. It then employs a multi-dimensional Adaptation model to characterize the temporal evolution and spatial differentiation of the relationship between the two systems. In addition, by incorporating Random Forest and SHAP methods, the study identifies key driving factors and reveals their nonlinear effects and threshold characteristics. In doing so, this study extends existing research from separate subsystem assessments to an integrated analysis of multifunctional synergy and provides empirical evidence for promoting high-quality fisheries development.
Materials and Methods
Development of the Evaluation Indicator System
Indicator System for Assessing Recreational Fisheries Development
As a composite industry integrating fisheries production, cultural experiences, and recreational consumption, the development level of recreational fisheries depends not only on industrial scale but is also jointly influenced by multiple dimensions, including market structure, efficiency of factor inputs, resource and environmental endowments, and infrastructure conditions.15 Accordingly, an evaluation indicator system for recreational fisheries development is constructed from the following aspects.
First, the economic scale and market competitiveness of recreational fisheries are used to reflect the industry’s relative position within the regional fisheries economy and its contribution to the national market. The former captures the absolute scale of development, while the latter emphasizes market share; together, they measure industrial scale and outward-oriented competitiveness.15
Second, recreational fisheries labor scale and labor input intensity are used to characterize employment absorption capacity and labor input characteristics from the perspectives of factor scale and labor occupancy per unit of output.16 Specifically, recreational fisheries labor scale is estimated by allocating total fisheries employment according to the share of recreational fisheries output in total fisheries output, thereby reflecting the equivalent labor scale associated with recreational fisheries. Meanwhile, labor input intensity of recreational fisheries is measured as the number of recreational fisheries employees per unit of recreational fisheries output.
In addition, the industrial status of recreational fisheries is evaluated with reference to the tertiary sector, measuring its functional positioning and contribution within the regional service-industry structure and highlighting its role in industrial structure upgrading.17
In the context of industrial dynamics, the annual output value change coefficient for recreational fisheries is used to assess the magnitude of output fluctuations. By comparing year-to-year changes in output value, this indicator reflects growth stability and risk resilience; larger fluctuations indicate weaker industrial resilience, making it a necessary complement for evaluating the industry’s healthy development.18 Regarding resource and environmental conditions, the area of waters suitable for recreational fisheries directly represents regional endowments of water resources available for recreational activities and constitutes the natural foundation constraining the industry’s potential scale and long-term sustainability.19 Finally, recreational fisheries accessibility is measured by the ratio of highway mileage to provincial land area, which captures intra-regional transportation convenience. Improved accessibility helps attract visitors and reduce transaction costs, thereby enhancing market demand and service capacity for recreational fisheries.20 The specific indicators are presented in Table 1.
Indicator System for Evaluating Freshwater Aquaculture System Efficiency
The study adheres to the core concept of total factor productivity by conceptualizing efficiency as the overall transformation performance arising from the joint effects of multiple inputs and multiple outputs, including both desirable and undesirable outputs.21 Rather than focusing solely on the economic optimality of resource allocation, this approach emphasizes coordination between production activities and the ecological environment, thereby providing a robust theoretical framework for the objective and comprehensive assessment of the efficiency of freshwater aquaculture systems.
On the input side, the indicator system incorporates five key production factors, namely cultured area, labor, intermediate inputs, seed (fingerlings), and energy, in order to comprehensively capture all critical inputs involved in the production process, including natural resources, human labor, material inputs, and capital. This approach establishes a holistic accounting of resource costs for efficiency evaluation.22 On the output side, both economic output and food output are included as desirable outputs. This not only reflects the direct economic benefits of freshwater aquaculture but also situates the system within the broader context of aquatic product supply and national food security, highlighting its dual economic and social functions. In addition, non-point source pollutants generated by aquaculture activities—such as total nitrogen, total phosphorus, and chemical oxygen demand—as well as carbon emissions are integrated as undesirable outputs.23 From a theoretical perspective, this framework internalizes the environmental externalities associated with production activities, enabling efficiency assessment to more accurately reflect the net productive performance of the system under resource and environmental constraints. Further details are provided in Table 2.
Research Methods
Adaptation Index Model
To comprehensively characterize the level of recreational fisheries development, this study employs a composite index model that integrates multidimensional indicators via weighted aggregation. Under a multi-indicator framework, this model transforms indicators with different units and attributes into a comparable composite score, thereby reflecting each province’s overall performance across multiple dimensions.24 Specifically, all positive and negative indicators are first normalized using a unified interval standardization approach to eliminate dimensional differences and ensure consistent indicator directionality. Indicator weights are then determined using the entropy weighting method. Finally, the normalized indicator values are multiplied by their corresponding weights and summed to obtain the composite index. The basic formulation of the model is presented as follows:
\[CI_{i} = \sum_{j = 1}^{n}w_{j}z_{ij}\tag{1}\]
In Equation (1), CIi denotes the composite index of region i, wj represents the weight of indicator j, and zij is the standardized value of region i for indicator j.
Benevolent Cross-efficiency Model
When estimating the efficiency of freshwater aquaculture systems, this study departs from the self-evaluation models commonly used in traditional Data Envelopment Analysis (DEA), such as the SBM model, which may lead to weight distortion and insufficient discriminatory power. Instead, the benevolent cross-efficiency model is adopted. This methodological choice is motivated by two main considerations. First, the benevolent cross-efficiency model establishes a more objective efficiency evaluation framework through a peer-evaluation mechanism, thereby mitigating the problem of extreme weights chosen by decision-making units (DMUs) to maximize their own efficiency scores. Second, the secondary optimization strategy embedded in this model is consistent with the principle of mutual benefit, as it allows the identification of improvement potential and relative advantages of each DMU, rather than merely providing a ranking of decision-making units. Relevant studies can be found in the literature,25 and the specific formulation is presented as follows:
\[\scriptsize \begin{matrix} \text{s.t.} \leq \left\{ \begin{matrix} \sum_{i = 1}^{m}v_{ik}\left( \sum_{\substack{j = 1 \\ j \neq k}}^{n}x_{ij} \right) = 1 \\ \sum_{r = 1}^{s}u_{rk}y_{rk} + \sum_{f = 1}^{h}w_{fk}b_{fk} - \theta_{kk}^{*}\sum_{i = 1}^{m}v_{ik}x_{ik} = 0 \\ \sum_{r = 1}^{s}u_{rk}y_{rj} + \sum_{f = 1}^{h}w_{fk}b_{fj} - \sum_{i = 1}^{m}v_{ik}x_{ij} \leq 0,\quad j = 1,\ldots,n;\ j \neq k \end{matrix} \right.\ \\ {\overline{E}}_{j}^{\max} = \frac{1}{n}\sum_{k = 1}^{n}E_{kj}^{\max} \end{matrix}\tag{2}\]
In the formulas, n denotes the number of decision-making units (DMUs); represents the average cross-efficiency value of DMU j; denotes the maximum cross-efficiency of DMU k relative to DMU j; is the self-evaluation efficiency score of DMU k. Variables and represent, respectively, the i-th input, the r-th desirable output, and the f-th undesirable output of DMU j or DMU k. Correspondingly, and denote the weights assigned by DMU k to its i-th input and r-th desirable output. and denote, respectively, the value and the weight of the r-th desirable output of DMU k. Similarly, and represent the value and weight of the f-th undesirable output for DMU k.
Composite Adaptation Model
Adaptation emphasizes the coherence and coordination of different systems during development and is commonly used to reveal the synergies and regulatory relationships that emerge from interactions among multiple actors. It has been widely applied in studies on structural optimization, supply–demand coordination, and resource allocation.26 On this basis, this study constructs a composite Adaptation model from three dimensions, namely adaptability, matching, and Adaptation, to characterize the interactive relationship between recreational fisheries development and freshwater aquaculture efficiency.
Specifically, adaptability reflects a system’s capacity to achieve coordinated development through internal adjustment under mutual interactions. It is commonly measured using the coupling coordination degree model to capture the linkage intensity and synergistic trends between the two systems.27 Matching focuses on the consistency of systems in terms of relative levels or ranking structures and is used to assess whether their development trajectories are synchronized.28 In contrast to adaptability, which emphasizes interaction intensity, matching reveals structural deviations or synchronicity between systems through differences in their ordered sequences. Accordingly, a sequence matching degree model is introduced to quantify the proximity of the two systems in terms of their ranking relationships.
Finally, Adaptation serves as an integrated expression of these two types of information. By weighting and aggregating the adaptability index and the matching index, a composite Adaptation index is constructed to simultaneously reflect both the quality of system synergy and structural consistency. This approach enables a more comprehensive depiction of the coordinated state and evolutionary dynamics of recreational fisheries development and freshwater aquaculture efficiency across temporal and spatial dimensions.
(1) The calculation formula of the adaptability evaluation model is given as follows:
\[D = \sqrt{C \times T}\tag{3}\]
\[C = \sqrt{\frac{xy}{(x + y)^{2}}}\tag{4}\]
\[T = \alpha x + \beta y\tag{5}\]
In the above equation, x and 𝑦 represent the level of recreational fisheries development and freshwater aquaculture efficiency, respectively; 𝐷 denotes the coupling coordination degree; 𝐶 is the coupling degree; and 𝑇 refers to the comprehensive evaluation index. Following related studies, the weights are set to a=0.6 and b=0.4, giving slightly greater importance to adaptability because coordinated interaction constitutes the primary basis of the Adaptation relationship, while matching serves as a supplementary assessment of structural consistency.29,30 The adaptability index ranges from 0 to 1, with higher values indicating a higher level of adaptability.
(2) The calculation formula of the matching evaluation model is given as follows:
\[M_{j} = 1 - \frac{\left| x_{j} - y_{j} \right|}{U - 1}\quad(j = 1,2,\ldots,U)\tag{6}\]
In the equation, Mj denotes the matching degree in year j; xj, yj and represent the rankings of the 𝑥-value series and the 𝑦-value series in ascending order, respectively; and 𝑈 is the number of provinces. When xj=yj, Mj=1, indicating perfect matching between the two systems. The closer Mj is to 1, the higher the level of matching, whereas values closer to 0 indicate poorer matching.
(3) The calculation formula of the composite Adaptation model is given as follows:
\[A_{i} = aD_{i} + bM_{i}\tag{7}\]
In the equation, Ai denotes the Adaptation degree in year i, while a and b represent the weights assigned to adaptability and matching, respectively. Following related studies, the weights are set to a=0.6 and b=0.4.29 Based on the classification framework of Adaptation levels proposed by He et al.,31 this study retains the original hierarchical structure while recalibrating the threshold values in a data-driven manner according to the empirical distribution of Adaptation values in the present study, where the mean is 0.29, the 75th percentile is only 0.365, and the maximum value is 0.449. Accordingly, the Adaptation levels are classified as follows: High adaptation level (A≥0.40); Moderate adaptation level (0.36≤A<0.40); Basic adaptation level (0.30≤A<0.36); Sub-optimal adaptation level (0.20≤A<0.30); and Poor adaptation level (A<0.20).
Random Forest Model
This study employs the Random Forest machine learning approach to investigate the Adaptation mechanisms between the level of recreational fisheries development and freshwater aquaculture efficiency in China. The selection of this method is motivated by three main advantages. First, Random Forest is capable of effectively capturing complex nonlinear relationships between explanatory variables and the Adaptation index, thereby avoiding the restrictive assumptions inherent in traditional linear models.32 Second, its ensemble learning framework offers high predictive accuracy and robustness, reducing the risk of overfitting and making it well suited for heterogeneity analysis in panel data settings.33 Third, the model provides strong interpretability, as the contributions and directional effects of driving factors can be quantified through feature importance rankings and SHAP value decomposition.34
Specifically, this study constructs a Random Forest regression model incorporating 10 explanatory variables spanning multiple dimensions, including climate conditions, environmental factors, aquaculture structure, economic development, and tourism characteristics. A grid search procedure is first applied to the national sample to identify the optimal model parameters, after which SHAP values are calculated to characterize the marginal effects of each variable and their nonlinear response patterns. Subsequently, to explore regional heterogeneity, the sample is divided into four major regions—eastern, central, western, and northeastern China—and region-specific sub-models are estimated to compare differences in the effects of key driving factors. Finally, robustness checks are conducted using simplified Random Forest specifications and LASSO regression as benchmark models to ensure the reliability of the results. The findings are visualized and quantitatively reported through feature effect curves, regional comparison plots, and model performance metrics, thereby providing empirical evidence for understanding the Adaptation mechanisms between recreational fisheries development and freshwater aquaculture efficiency.
Data sources
To examine the long-term evolution of the Adaptation relationship between recreational fisheries development and freshwater aquaculture efficiency in China, this study constructs a provincial-level panel dataset covering the period from 2008 to 2023. The sample includes 29 provinces (autonomous regions and municipalities), excluding Qinghai Province, the Tibet Autonomous Region, Taiwan Province, and the Hong Kong and Macao Special Administrative Regions due to severe data unavailability.
Core fisheries statistics and recreational fisheries data are obtained from the China Fishery Statistical Yearbook. Data on water use, gross domestic product, transportation infrastructure, environmental regulation, and tourism consumption are sourced from the China Statistical Yearbook, the China Tourism Statistical Yearbook, and the China Culture, Cultural Relics and Tourism Statistical Yearbook. Pollutant discharge coefficients for different freshwater aquaculture species are derived from the Handbook of Pollutant Generation and Discharge Coefficients for the Aquaculture Industry compiled under the First National Pollution Source Census. All monetary variables are deflated to constant prices using 2007 as the base year to eliminate the effects of inflation. A small number of missing observations are addressed using linear interpolation to ensure data continuity and consistency across provinces and years.
Results
Temporal Evolution of the Adaptation Level between Recreational Fisheries Development and Freshwater Aquaculture Efficiency
Temporal Evolution Characteristics
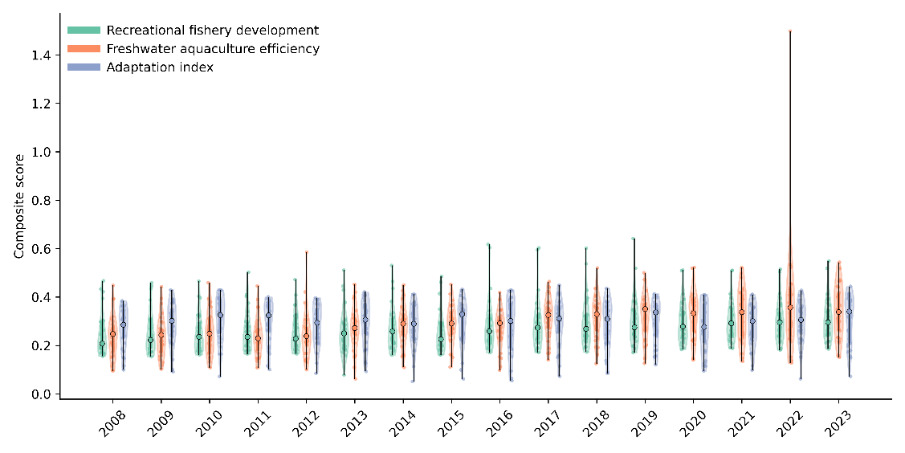
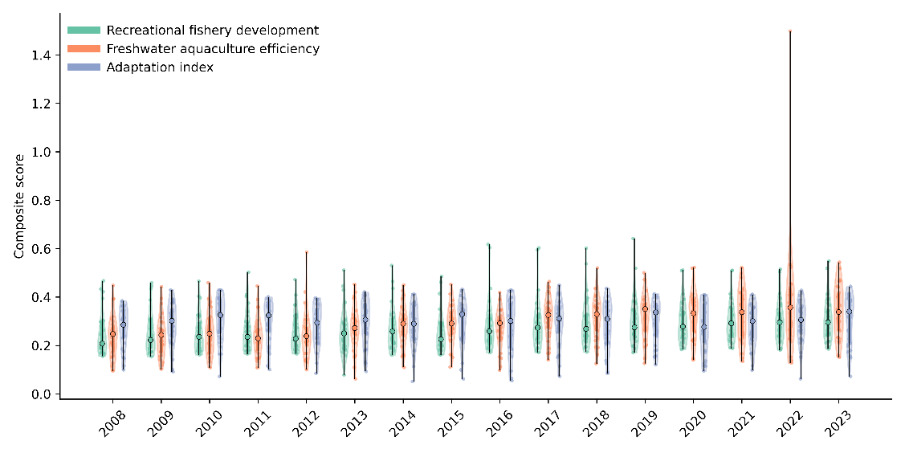
As shown in Figure 1 the following findings can be observed. (1) Subsystem levels exhibit a steady upward trend, with more pronounced efficiency gains. In terms of annual averages, the level of recreational fisheries development increased from 0.25 in 2008 to approximately 0.31 in 2023, representing a rise of about 25%. Over the same period, freshwater aquaculture efficiency increased from 0.24 to around 0.34, an increase of more than 40%. Moreover, since 2015, freshwater aquaculture efficiency has consistently exceeded that of recreational fisheries development, with the gap reaching about 0.03 in 2015 and stabilizing at 0.02–0.07 after 2020. This pattern is reflected in the figure by an overall upward shift of the median values over time. In particular, the boxplots and violin contours of freshwater aquaculture efficiency show a more pronounced upward movement. After 2018, the upper tails of the distribution gradually extend, and an extreme high value emerges in 2022, indicating substantial efficiency improvements in certain regions driven by increased technological inputs and more intensive production practices.
(2) The Adaptation index fluctuates at a low level, with little change in stage-wise averages. In contrast to the continuous growth of the two subsystems, the annual mean of the Adaptation index fluctuates within a relatively narrow range of 0.27–0.31. Specifically, it stands at 0.274 in 2008, reaches stage-specific peaks of 0.310 in 2010 and 0.307 in 2023, but falls back to around 0.28–0.30 in most years between 2012 and 2021. According to the Adaptation classification criteria, only 2010 and 2023 marginally enter the basic adaptation level, while the remaining years are predominantly characterized by a sub-optimal adaptation level. From a stage-wise perspective, the average Adaptation index remains close to 0.29 across the three periods of 2008–2012, 2013–2017, and 2018–2023, showing almost no upward shift. This indicates that although both recreational fisheries development and freshwater aquaculture efficiency have improved over time, the matching relationship between the two systems has not been enhanced synchronously, and the release of synergistic effects remains limited.
Overall, during the period from 2008 to 2023, recreational fisheries development and freshwater aquaculture efficiency in China have entered a phase of steady improvement. However, the Adaptation index has persistently hovered around the threshold of basic adaptation, suggesting the continued presence of mismatches in efficiency, demand, and spatial configuration along the industry chain. On the one hand, recreational fisheries have expanded rapidly under policy support and consumption upgrading. On the other hand, efficiency gains in freshwater aquaculture are mainly reflected in output growth and resource-use optimization, while effective transmission channels to recreational fisheries remain underdeveloped. Further improvements in the Adaptation level require the optimization of linkage mechanisms between freshwater aquaculture and recreational fisheries, the enhancement of supporting infrastructure for recreational fisheries, and closer alignment between aquaculture regions and tourism markets as well as urban consumer catchments, so as to narrow the gap between high efficiency and low Adaptation across regions and provinces.
Dynamic Evolution Characteristics
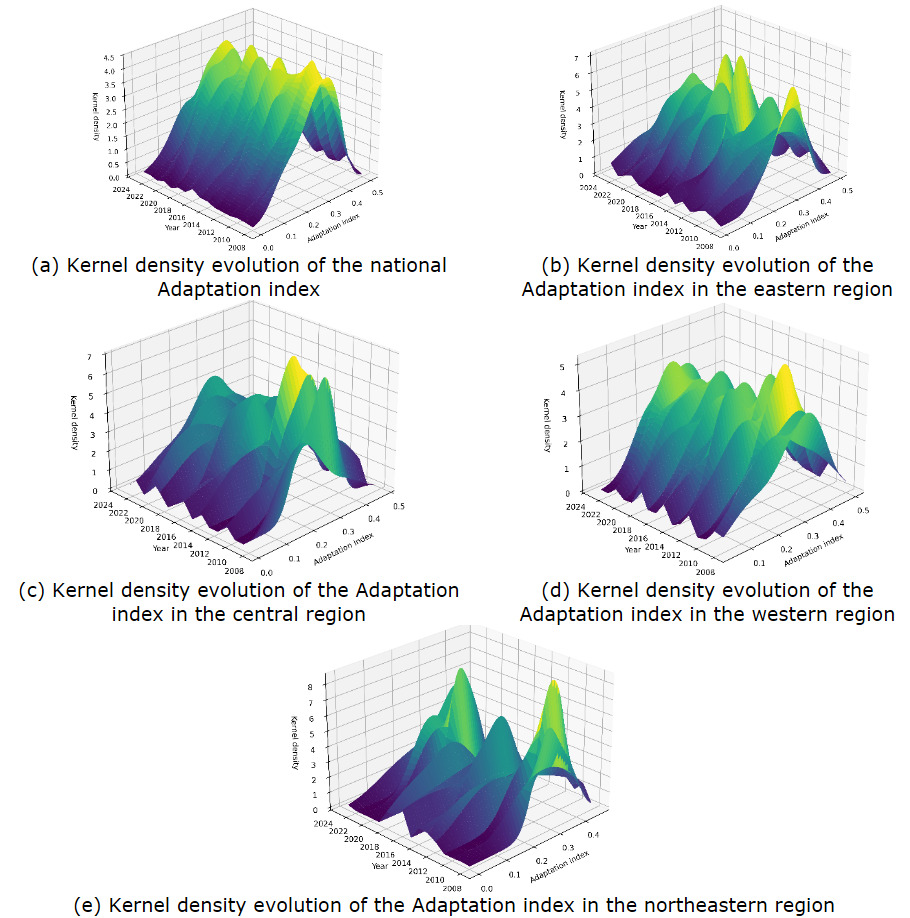
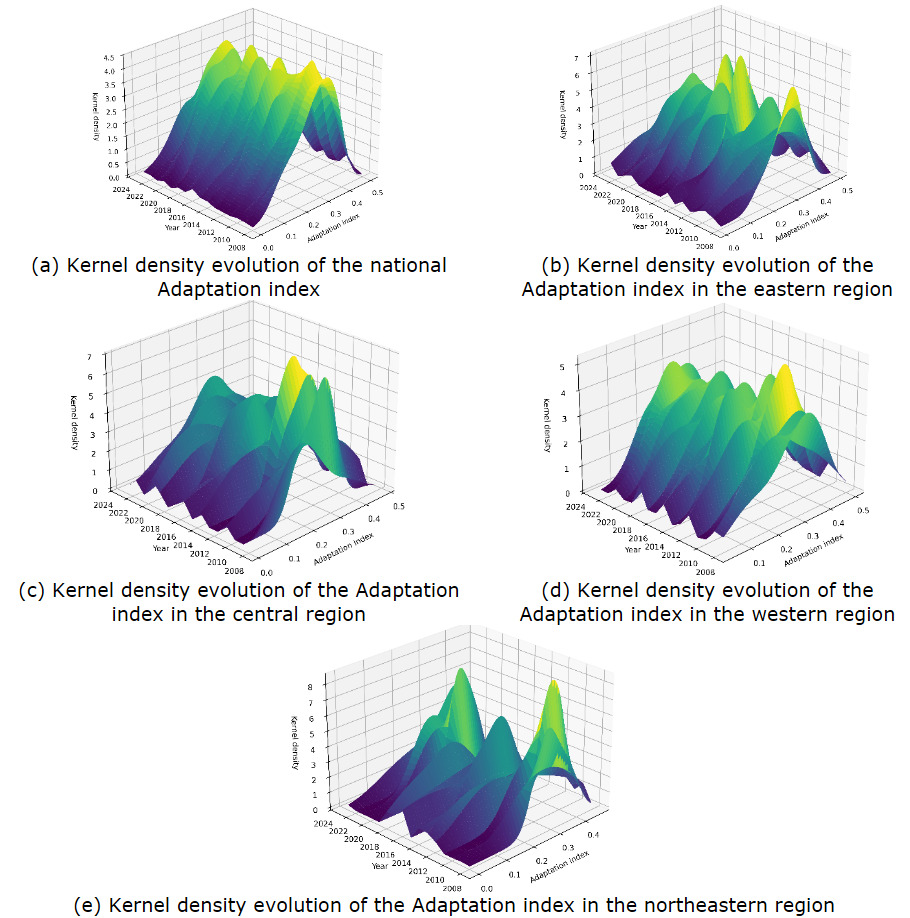
Based on kernel density estimation, the dynamic evolution of the Adaptation level between recreational fisheries development and freshwater aquaculture efficiency in China is examined. As shown in Figure 2, during the period 2008–2023, the Adaptation index exhibits a set of salient dynamic characteristics, including a generally low-to-medium level, a relatively stable central tendency, a fluctuating rightward shift, and increasing regional differentiation without the emergence of pronounced polarization. At both the national and regional levels, kernel density peaks remain concentrated around the threshold of basic adaptation. The eastern region shows a mild tendency toward higher values, the central region closely follows the national pattern, while the western and northeastern regions persistently remain in low Adaptation intervals, with no substantial increase in the share of highly adapted provinces.
(1) National level: stable peak with limited rightward shift and overall low Adaptation. At the national scale, the main peak consistently lies within the range of 0.20–0.35, displaying only a slight rightward movement and gradual flattening over time. In terms of distribution shape and spread, the kernel density curve evolves from a narrow, sharp unimodal distribution to a broader, flatter unimodal distribution. The high-value tail extends marginally toward 0.40, while the low-value tail remains below 0.20 throughout the study period. This pattern suggests a widening of internal disparities in Adaptation levels nationwide, but without the formation of a clear bimodal or polarized structure. Instead, the changes mainly reflect redistribution within the low- to medium-Adaptation range.
(2) Eastern region: relatively high Adaptation with notable potential for improvement. The Adaptation index in the eastern region is generally higher, with strong potential for high Adaptation. Its kernel density peak is mainly concentrated in the interval of 0.28–0.36 and approaches 0.40 in some years. Over time, the peak gradually shifts rightward, accompanied by a pronounced extension of the right tail, indicating that a small number of provinces are moving toward higher Adaptation levels. The distribution is predominantly right-skewed and unimodal, with occasional shoulder peaks in certain years, reflecting a layered structure in which moderately and relatively highly adapted provinces coexist. Overall, the eastern region has taken the lead in aligning recreational fisheries development with freshwater aquaculture efficiency, although a stable and large-scale agglomeration of high Adaptation has yet to emerge.
(3) Central region: concentrated distribution and close alignment with the national trend. The kernel density evolution of the Adaptation index in the central region closely mirrors the national pattern, while exhibiting a more concentrated distribution. Compared with the national level, horizontal dispersion is lower and high-density areas are more compact, indicating that interprovincial differences in Adaptation remain relatively manageable. The distribution is mainly unimodal, with weaker tail extension than in the eastern region and an absence of a pronounced high-value tail. This suggests that no clear leading provinces with high Adaptation have yet formed. Such a pattern may be attributed to constraints related to consumer markets, transport accessibility, and branding in recreational fisheries, as well as the fact that efficiency gains in freshwater aquaculture have not been fully integrated into culture–tourism convergence.
(4) Western region: left-skewed distribution dominated by low Adaptation. The Adaptation index distribution in the western region is distinctly left-skewed, with a high proportion of low-Adaptation provinces. Kernel density mass is concentrated in the low-value range, and the left tail is markedly extended, indicating that most provinces have long remained in sub-optimal or poor Adaptation states. In some years, weak bimodal or shoulder features appear around 0.20 and 0.30, suggesting that while a few provinces have experienced improvements in Adaptation, the region as a whole continues to lag behind, exhibiting weak polarization. This pattern is closely associated with weak freshwater aquaculture foundations, limited market reach for recreational fisheries, and inadequate transport and supporting services, which hinder the simultaneous realization of high efficiency and high Adaptation.
(5) Northeastern region: large fluctuations and the most delayed improvement. The northeastern region shows large fluctuations and relatively low peak values in the Adaptation index, with the slowest rate of improvement among all regions. The main kernel density peak is mostly concentrated between 0.20 and 0.28 and varies substantially across years. In some periods, density clusters around 0.20, indicating a persistently low and unstable Adaptation level. The high-value tail is short and shows little tendency to extend beyond 0.35, while the low-value tail rises noticeably in certain years, implying a high share of low or extremely low Adaptation provinces. Constrained by population outflow, weak consumer demand, and rigid aquaculture structures, the northeastern region faces significant bottlenecks in translating freshwater aquaculture efficiency gains into drivers of recreational fisheries development.
Spatial Differentiation of the Adaptation Level between Recreational Fisheries Development and Freshwater Aquaculture Efficiency
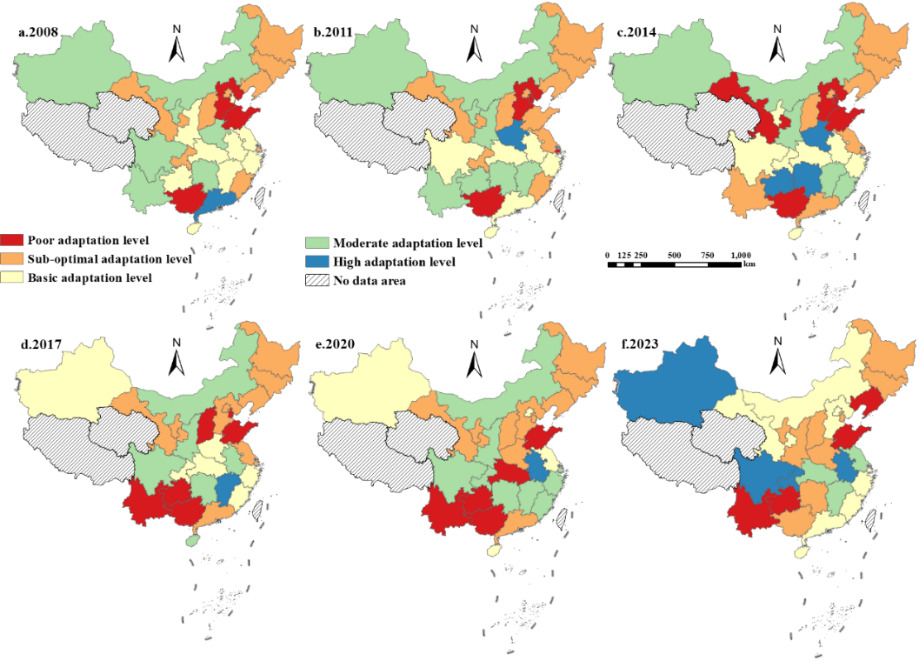
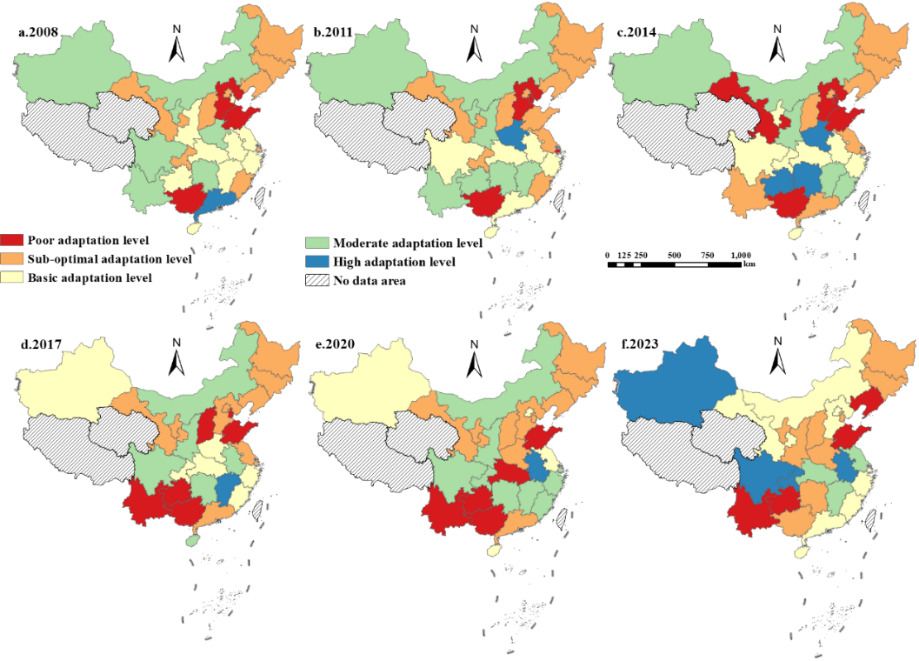
As shown in Figure 3, during the period 2008–2023, the Adaptation level between recreational fisheries development and freshwater aquaculture efficiency in China is generally at a moderate level, with pronounced regional disparities. A spatial pattern characterized by “persistently high Adaptation in the central region, moderate Adaptation in the western region, an evolution from low to medium–high Adaptation in the eastern region, and overall low and weakening Adaptation in the northeastern region” can be observed. High-Adaptation types are mainly concentrated in the middle and lower reaches of the Yangtze River and in parts of the inland western region, whereas low-Adaptation and mismatched types are relatively clustered in the Bohai Rim, the northeastern region, and parts of southwestern China. Specifically:
(1) Eastern region: transition from low to medium–high Adaptation. During 2008–2012, the average Adaptation index in the eastern region was only about 0.25, the lowest among the four regions. With coordinated advances in recreational fisheries expansion and improvements in aquaculture efficiency, the regional average increased to approximately 0.303 in 2019–2023, approaching levels observed in the central and western regions. Along the Beijing–Shanghai corridor and in the Yangtze River Delta, areas initially characterized by low Adaptation gradually shifted to green tones on the map, indicating a marked increase in medium–high Adaptation types. This suggests that under the combined effects of fisheries upgrading and culture–tourism integration, structural mismatches between recreational fisheries development and freshwater aquaculture efficiency in the eastern region have been progressively alleviated.
(2) Central region: persistently high Adaptation. In 2008–2012, the central region exhibited an average Adaptation index of about 0.35, the highest nationwide. Although this value slightly declined to around 0.324 in 2019–2023, the region has maintained its leading position. Provinces such as Henan, Anhui, Hubei, and Jiangxi recorded Adaptation values mostly between 0.34 and 0.44 in 2008, and Anhui, Hubei, and Jiangxi re-entered the national top tier after 2019. Figure 3 shows that central provinces are predominantly represented by blue and green colors, forming a contiguous belt of high or relatively high Adaptation. This pattern reflects a solid freshwater aquaculture foundation in the region, which enables recreational fisheries development to effectively absorb and transform efficiency gains.
(3) Western region: moderate overall Adaptation with pronounced internal disparities. The western region recorded an average Adaptation index of approximately 0.30 in 2008–2012, followed by a slight decline to around 0.292 in the later period, indicating minor fluctuations. On the map, provinces and municipalities such as Sichuan, Chongqing, and Xinjiang consistently display green or light-yellow colors, forming a high-Adaptation core within the western region. In contrast, Yunnan, Guizhou, and parts of northwestern China show a marked deterioration in Adaptation levels. For instance, Yunnan declined from 0.377 to 0.158, Guizhou from 0.346 to 0.138, and Ningxia from 0.399 to 0.229. These changes reveal insufficient coordination among resource expansion, efficiency improvement, and recreational fisheries development.
(4) Northeastern region: generally low and declining Adaptation. During 2008–2012, the average Adaptation index in the northeastern region was about 0.278, close to the national average. However, it subsequently weakened continuously, dropping to approximately 0.242 in 2019–2023, making it the only region among the four to exhibit a clear downward trend. Liaoning declined from 0.295 to 0.167, Heilongjiang from about 0.29 to 0.246, while Jilin remained around 0.25 for an extended period. Correspondingly, the northeastern region is predominantly characterized by orange tones indicating sub-optimal Adaptation in Figure 3. This reflects the combined effects of tightening resource and environmental constraints, population outflow, and insufficient recreational market demand, under which recreational fisheries development has failed to effectively absorb improvements in freshwater aquaculture efficiency, resulting in a lagging Adaptation relationship.
Spatiotemporal Interaction Characteristics of the Adaptation Level between Recreational Fisheries Development and Freshwater Aquaculture Efficiency
Relative Length and Curvature of the LISA Time Path
As indicated in Table 3, during the study period, the Adaptation relationship between recreational fisheries development and freshwater aquaculture efficiency in China exhibits moderate overall adjustment, limited net displacement, relative path lengths mostly slightly above 1, and pronounced regional heterogeneity in path curvature. The Beijing–Tianjin–Hebei region, the middle reaches of the Yangtze River, and parts of southwestern and northwestern China simultaneously display high values of total path length, straight-line distance, relative length, and curvature, indicating the most intense spatiotemporal fluctuations and structural adjustments in Adaptation. In contrast, several southeastern coastal, northeastern, and southwestern provinces show consistently low values across these indicators, suggesting strong local spatial lock-in effects and evolutionary inertia in their Adaptation relationships.
In terms of total path length and straight-line distance, provincial total path lengths range from 5.31 to 15.19, with a mean of approximately 9.14, while straight-line distances vary between 0.08 and 3.13, with an average of about 1.33. This indicates that although most provinces experience shifts in spatial position, their overall net displacement remains limited, and no fundamental restructuring of the Adaptation pattern has occurred. Provinces such as Hebei, Guangxi, Tianjin, and Yunnan are characterized by both long paths and large displacements, implying trend-oriented adjustments in Adaptation from low to high or from high to medium levels, which are consistent with the expansion of recreational fisheries and the optimization of aquaculture structures. By contrast, Shanxi, Inner Mongolia, and Shaanxi exhibit relatively long paths but minimal straight-line displacement, reflecting oscillatory evolution with frequent deviations but without sustained improvement. Provinces such as Jilin, Jiangxi, and Fujian record low values for both indicators, suggesting high spatial stability and limited changes in Adaptation, indicative of strong path dependence.
Regarding relative length, the national average is close to 1, indicating that the temporal paths of Adaptation generally lie between straight-line translation and circuitous adjustment, though interprovincial differences are substantial. Provinces including Hebei, Hubei, Guangxi, and Shanghai show relative lengths significantly greater than 1, suggesting frequent switching among local spatial regimes and typifying highly deviated paths. This pattern aligns with rapid expansion of recreational fisheries, tightening environmental constraints, and concurrent adjustments in aquaculture structures. In contrast, provinces such as Jilin, Jiangxi, Chongqing, and Fujian display relative lengths well below 1, indicating smoother, more unidirectional evolution with fewer reversals, and thus stronger path convergence and local spatial stability.
Path curvature reflects the frequency and intensity of directional changes in temporal trajectories. After excluding the extreme case of Shanxi, the national average curvature is approximately 9, whereas Shanxi exhibits an exceptionally high curvature of 130.99, indicating repeated reversals in movement direction on the Moran scatterplot and frequent oscillation between different spatial polarization states. Provinces such as Inner Mongolia, Shaanxi, and Hubei also show curvature values exceeding 20, implying multiple turning points during evolution and high sensitivity of Adaptation patterns to policy adjustments, resource constraints, and changes in neighboring provinces. By contrast, Chongqing, Guizhou, Yunnan, Xinjiang, Ningxia, and Gansu fall into the lowest curvature group nationwide. Even where total path length or straight-line distance is not particularly small, their movement directions remain relatively consistent, characterized by steady progression along a given trajectory rather than repeated reversals. In these low-curvature regions, Adaptation relationships are more strongly shaped by local industrial foundations and market conditions, with weaker interregional spillover and feedback effects.
Spatiotemporal Transition Characteristics
As shown in Table 4, the Adaptation relationship between recreational fisheries development and freshwater aquaculture efficiency is characterized by high spatial cohesion and low spatiotemporal transition intensity. The spatial pattern is predominantly locked into persistent HH and LL states, whereas the transitional HL and LH types exhibit greater instability. The transition matrix indicates that among HH states, 102 cases remain HH in the subsequent period, while 58 LL cases continue as LL, with only a limited number transitioning to other types. This demonstrates strong inertia in both high-Adaptation and low-Adaptation units, resulting in a relatively stable polarized structure. In contrast, the self-retention frequencies of HL and LH states are only 9 and 3, respectively, with most observations shifting toward either higher or lower Adaptation states. This suggests that these transitional types are more prone to oscillation between high and low Adaptation and constitute the most sensitive zones of spatial reconfiguration.
In terms of transition types, Type IV transitions account for 72.18%, far exceeding the shares of Types I, II, and III. Together with the high spatiotemporal cohesion index (0.8253) and low spatiotemporal transition index (0.1747), this indicates that the Adaptation pattern is shaped mainly by the persistence of existing spatial structures, with only limited marginal adjustments. Overall, the Adaptation relationship between recreational fisheries development and freshwater aquaculture efficiency exhibits a relatively stable pattern of high–low differentiation, while transitional areas remain the key zones for future policy intervention and structural optimization.
Visualization of Spatiotemporal Interactions
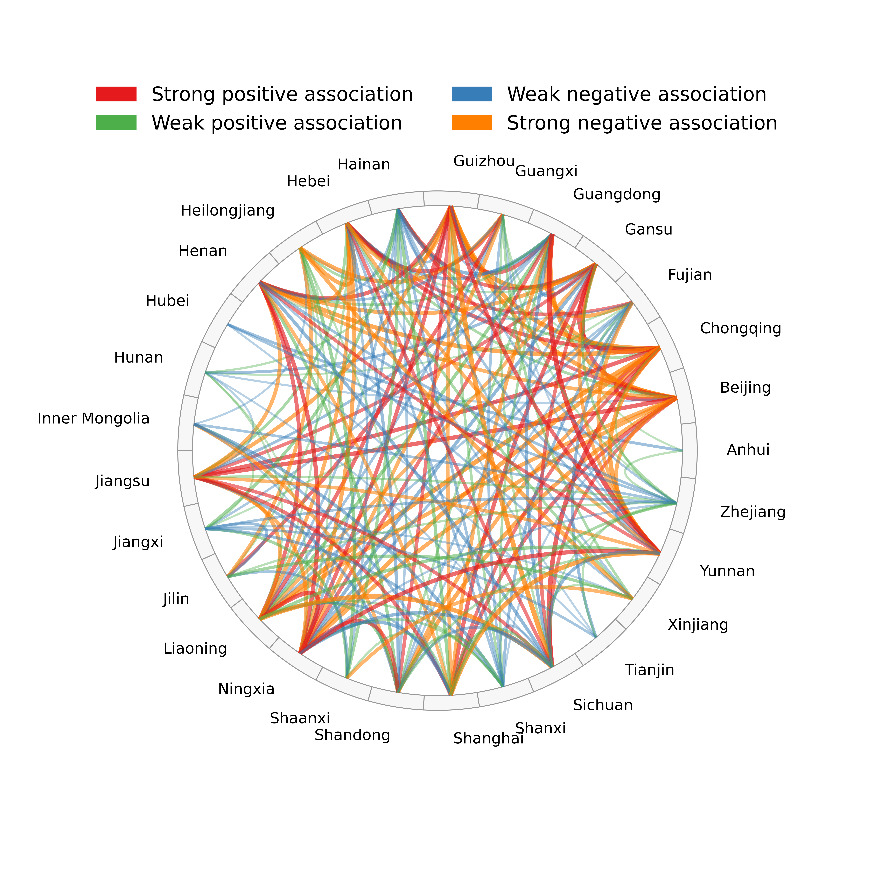
To reveal the temporal interlinkages of provincial Adaptation levels, this study integrates the Adaptation indices of all provinces from 2008 to 2023 into a time-series matrix and calculates interprovincial Pearson correlation coefficients to construct a correlation matrix representing co-evolutionary relationships. Thresholds are then applied based on correlation strength, retaining only statistically meaningful associations with absolute values greater than 0.3, among which coefficients with absolute values of 0.6 or higher are regarded as strong correlations. Different colors and line widths are used to distinguish the direction and magnitude of these correlations. A chord diagram is employed to visualize interprovincial relationships, thereby illustrating the spatiotemporal linkage patterns of Adaptation between recreational fisheries development and freshwater aquaculture efficiency at the regional scale.
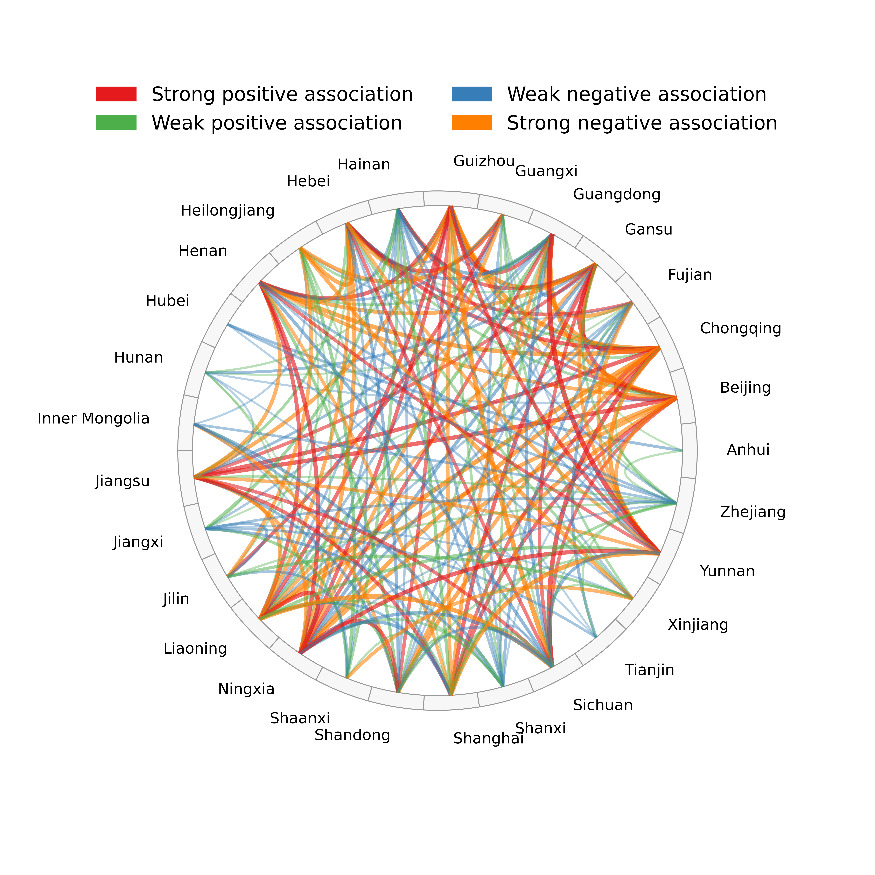
As illustrated in Figure 4, the interprovincial Adaptation levels between recreational fisheries development and freshwater aquaculture efficiency in China are dominated by positive co-movements, while negative linkages are relatively limited. A pronounced high-correlation synergy network has emerged among provinces in the eastern and central regions. In the diagram, red and green chords are predominant and densely connect provinces along the coastal areas and the Yangtze River Economic Belt, indicating highly synchronous temporal fluctuations in Adaptation indices. This pattern highlights strong linkage effects driven by industrial policies, market demand, and technological diffusion.
A limited number of blue chords span across eastern–western and northern–southern regions, reflecting inverse movements in Adaptation levels between certain provinces with markedly different resource endowments. This suggests that improvements in Adaptation in one province do not necessarily lead to simultaneous improvements elsewhere, particularly under heterogeneous conditions of water resources, aquaculture practices, and recreational demand structures. Accordingly, greater emphasis should be placed on strengthening the demonstrative and leading roles of core regions in the eastern and central parts of the country. At the same time, enhanced institutional coordination, technical support, and market connectivity are needed to improve the capacity of western and resource-disadvantaged regions to integrate into the national network of Adaptation enhancement, thereby reinforcing overall synergistic effects.
Driving Mechanism Analysis of the Adaptation Level between Recreational Fisheries Development and Freshwater Aquaculture Efficiency
Selection of Driving Factor Indicators
To systematically examine the driving mechanisms underlying the Adaptation relationship between recreational fisheries development and freshwater aquaculture efficiency, this study focuses on three categories of factors: resource and environmental conditions and natural endowments, economic and spatial support conditions, and the scale and structure of tourism demand.
(1) Resource and environmental conditions and natural endowments constitute the fundamental constraints shaping the Adaptation relationship. Annual mean temperature represents aquatic ecological conditions and the seasonality of tourism activities and is measured using gridded climate data.35 Freshwater aquaculture water-withdrawal intensity and water quality pressure respectively reflect water resource consumption and environmental load and are proxied by (total agricultural water use × (fishery output value / total agricultural output value)) / freshwater aquatic product output.36 Environmental regulation captures the intensity of environmental governance and influences industrial operation modes through emission constraints; it is measured as the ratio of local fiscal expenditure on environmental protection to regional gross domestic product.37 The aquaculture structural index reflects structural upgrading and the level of facility-based production, forming an important foundation for promoting efficient and green aquaculture as well as its integration with recreational fisheries.38
(2) Economic and spatial support conditions play a key role in shaping the Adaptation relationship. GDP per capita reflects regional economic strength and governance capacity, influencing both the quality of industrial supply and the level of ecological investment, and is measured as regional GDP divided by year-end permanent population.39 Urbanization expands market demand through population agglomeration but may also intensify ecological pressure by encroaching on shorelines and water bodies through construction land expansion, thereby exerting complex effects on Adaptation.40 Tourism accessibility determines tourist inflows and the spatial distribution of activities. While improved accessibility can expand the recreational fisheries market and strengthen fishery–tourism linkages, increased visitor flows may also generate pressure on aquatic and spatial resources, resulting in both promotional and disruptive effects.41
(3) Tourism demand scale and structure directly influence the Adaptation relationship. Rising tourist density can occupy shoreline and water spaces, intensify ecological disturbances, and reshape the demand structure of recreational fisheries; this factor is measured by the ratio of total tourist arrivals to permanent population.42 Per capita tourism expenditure reflects tourists’ purchasing power and demand composition and can promote the upgrading of recreational fisheries from sightseeing-oriented activities toward experience-based and high-quality supply, thereby strengthening industrial linkages with freshwater aquaculture.43
Driving Effect Identification and Model Robustness Assessment
To ensure the adequacy of model fit and the reliability of subsequent mechanism identification, this study first conducts a systematic optimization of the Random Forest model. Optimal hyperparameters are determined through grid search combined with five-fold cross-validation, yielding a configuration with 500 trees, a minimum leaf size of one (min_samples_leaf = 1), and no predefined restriction on tree depth (max_depth = None). This specification enables the model to fully capture potential nonlinearities and interaction effects among driving factors, while the ensemble learning framework effectively mitigates the risk of overfitting associated with individual trees.
Model performance indicates an 𝑅2 of 0.932 and an MSE of 0.0006 on the training set, and an 𝑅2 of 0.657 with an MSE of 0.0030 on an independent test set. The gap between training and testing 𝑅2 values remains within a reasonable range, with no evidence of a sharp performance decline due to excessive model complexity. The test set results explain approximately two-thirds of the total variance, demonstrating satisfactory generalization ability and structural stability. Under the current sample size and indicator system, the Random Forest model therefore provides an adequate representation of the main sources of variation in the Adaptation index between recreational fisheries development and freshwater aquaculture efficiency, forming a solid foundation for subsequent analyses of nonlinear driving mechanisms.
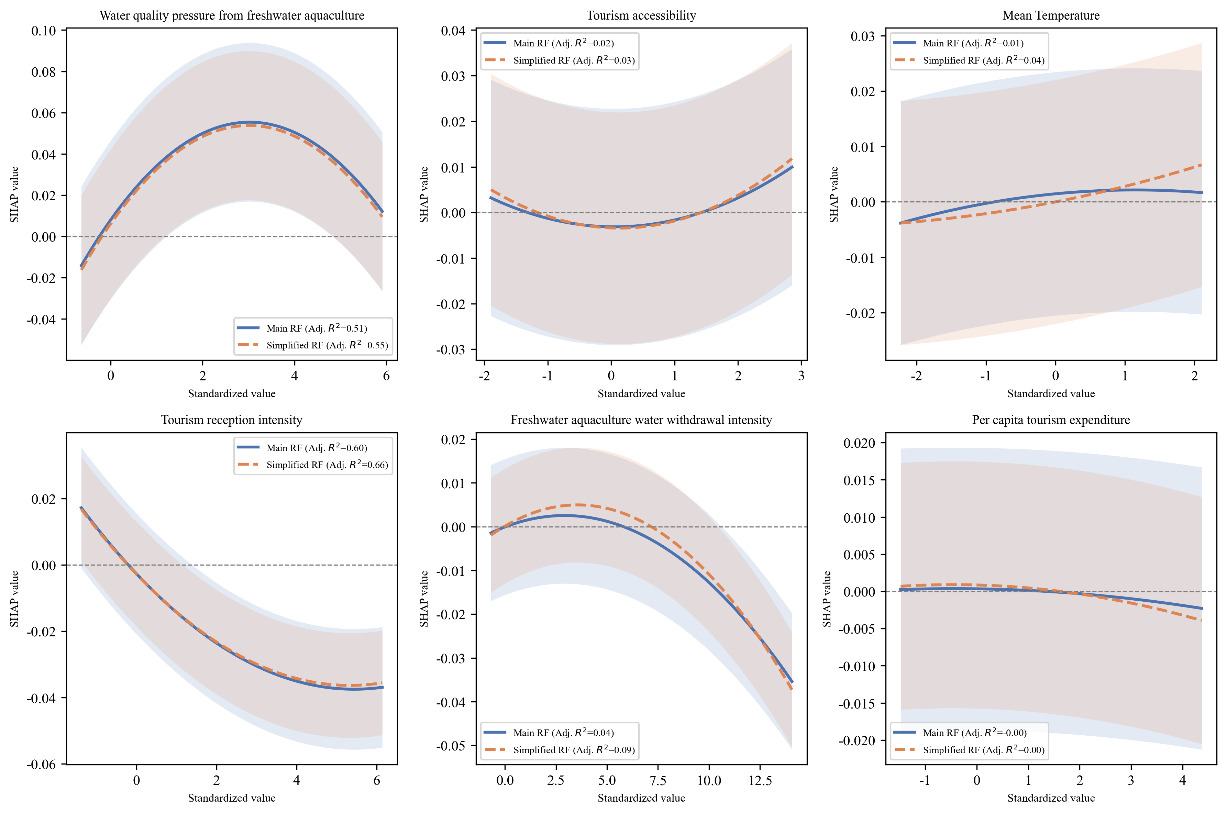
To further validate the robustness of the main model, two benchmark specifications are constructed: (1) a simplified Random Forest model with constrained tree depth and leaf size, and (2) a linear baseline model represented by LASSO regression. The results show that the simplified model achieves a test 𝑅2 of 0.641, which is highly consistent with that of the main model (0.657), with similarly stable prediction errors. This indicates that the findings are not sensitive to specific model settings and are not driven by artificial complexity. In contrast, the LASSO model exhibits extremely low explanatory power (𝑅2=0.05 for the training set and 𝑅2=−0.01for the test set), suggesting that linear specifications fail to capture the true relationships among variables. This contrast provides further support for the necessity of using Random Forest models to identify nonlinear effects and threshold mechanisms.
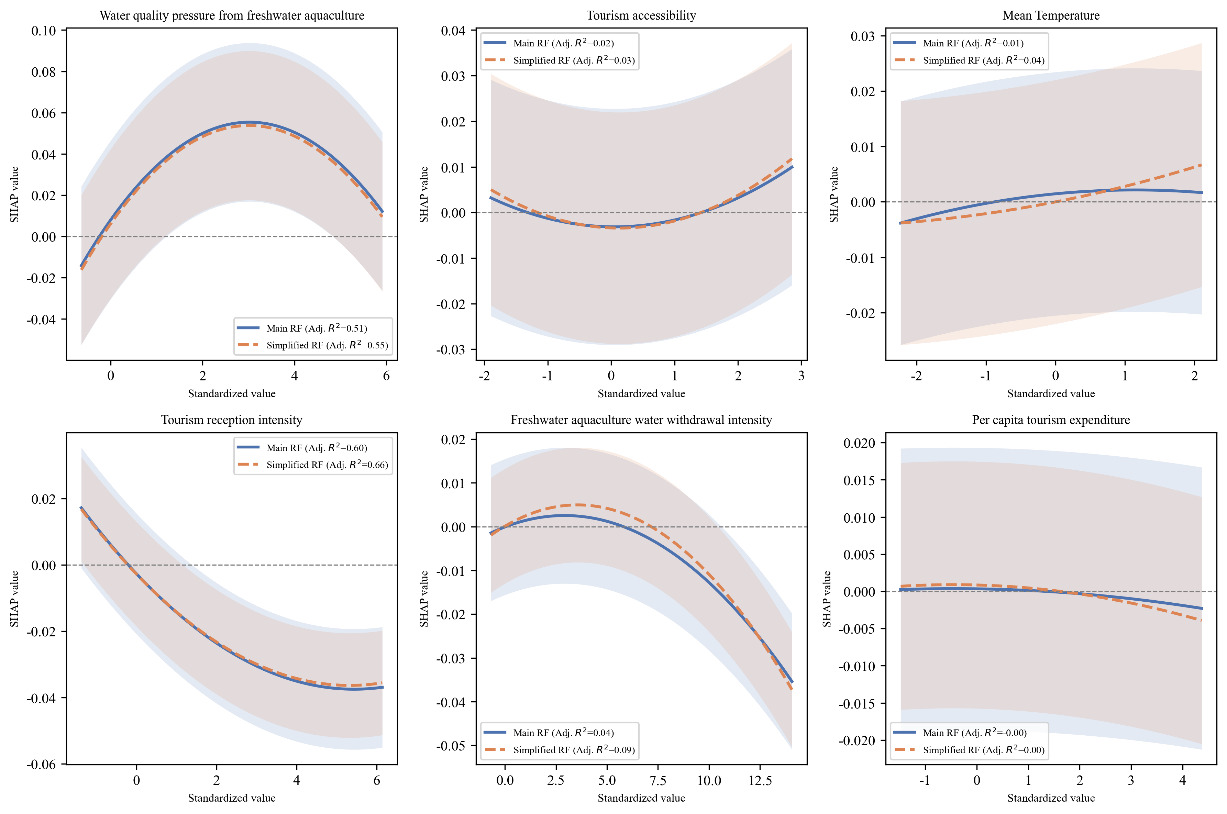
A comparison of SHAP dependence plots (Figure 5) reveals a high degree of consistency between the simplified and main models in terms of effect directions, curve shapes, marginal response patterns, and threshold locations for key driving factors, with substantial overlap in confidence intervals. These results indicate that the nonlinear features of the Adaptation mechanism are inherent in the data itself, rather than artifacts of specific model complexity or tree structure choices, thereby demonstrating strong structural robustness. Although the 𝑅2 values of individual-variable local response curves are relatively low, this does not undermine the robustness assessment, as SHAP is designed to decompose overall predictive contributions rather than to evaluate the goodness of fit of single-variable regressions.
Nonlinear Driving Mechanisms and Threshold Characteristics
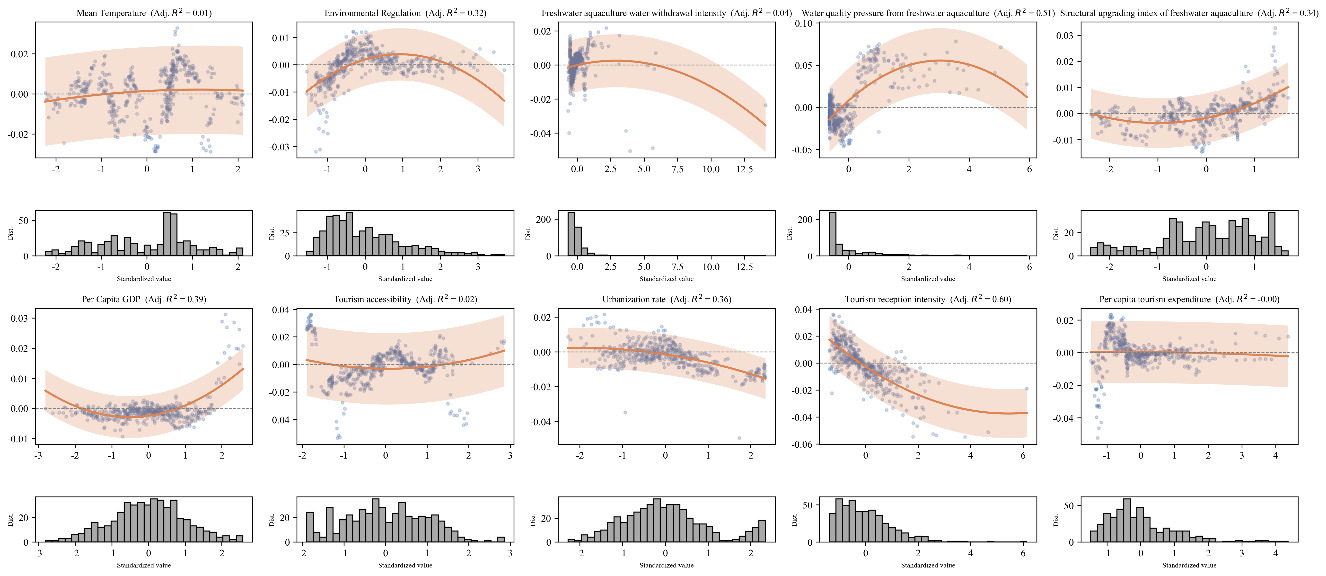
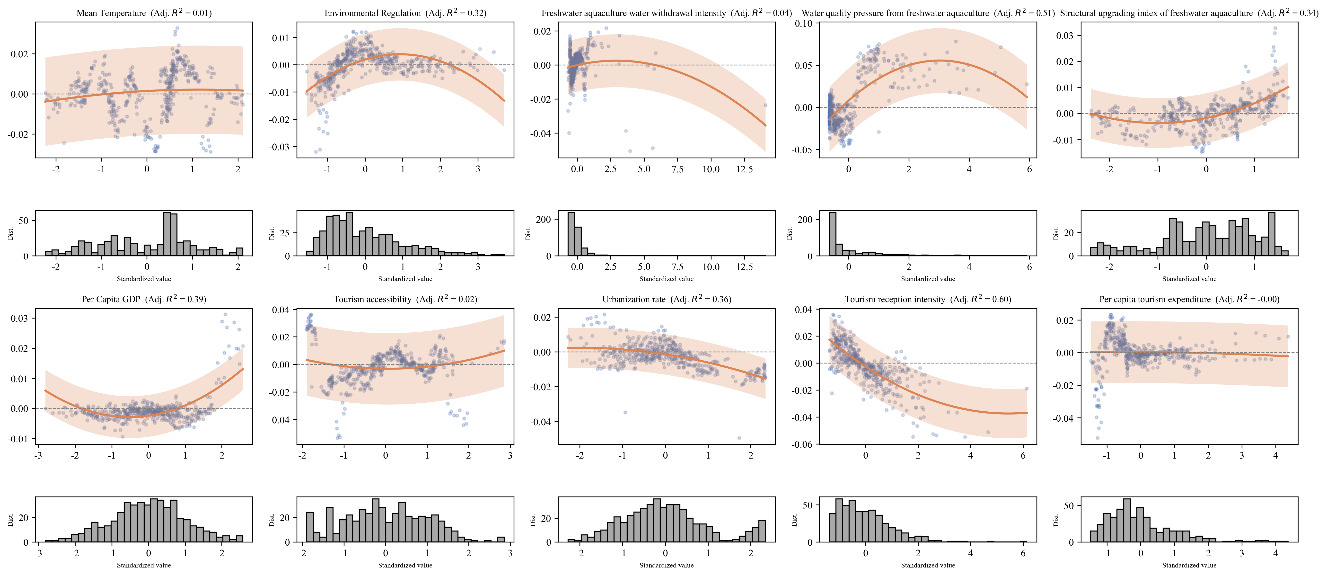
As shown in Figure 6, the formation of the Adaptation index is jointly influenced by three categories of factors: resource and environmental conditions, economic and spatial support conditions, and tourism demand. Among these, water environmental pressure and tourism intensity exhibit the most pronounced threshold effects and constitute the core constraints on Adaptation levels. In contrast, economic development, environmental regulation, and aquaculture structural upgrading display stage-dependent role shifts, while climate conditions and tourism consumption exert relatively limited influence. Overall, these results indicate that the Adaptation mechanism is not a simple linear aggregation of effects but is jointly determined by ecological carrying capacity and development stages. Specifically:
(1) Resource and environmental conditions and natural endowments exert the strongest constraints. The SHAP dependence curve for water quality pressure exhibits a pronounced inverted U-shaped pattern and shows the highest explanatory power among all factors. Within the low-to-moderate pressure range, moderate intensification and improvements in water environmental management enhance Adaptation levels. However, once pressure exceeds a threshold of approximately 3, the effect rapidly turns negative, indicating that surpassing ecological carrying capacity significantly crowds out the space for fishery–tourism synergy. Environmental regulation also follows an inverted U-shaped relationship, with moderate regulatory intensity being most conducive to Adaptation, whereas overly weak or excessively stringent regulation diminishes its effectiveness. Aquaculture structural upgrading displays a U-shaped pattern, with its effect shifting from negative to positive once the structural index exceeds about 0.2, suggesting that species optimization and facility-based production can substantially promote functional integration between the two sectors. Annual mean temperature exerts only a minor influence and serves as an auxiliary natural endowment factor.
(2) Economic and spatial support conditions exhibit stage-dependent effects. GDP per capita shows a clear U-shaped relationship with Adaptation. At low income levels, Adaptation remains limited due to insufficient infrastructure and governance capacity. After surpassing the middle-income stage, consumption upgrading and increased investment in environmental governance lead to a positive effect. In contrast, the urbanization rate displays a persistently negative relationship, as urban expansion and the accumulation of ecological pressures continuously compress the space for synergy. Given that most provinces are already in medium-to-high urbanization stages, this finding carries strong practical relevance.
(3) Tourism demand scale and structure generate pronounced pressure effects. Tourism intensity emerges as the strongest negative factor, with higher intensity associated with lower SHAP values, reflecting intensified competition for water space and environmental disturbance caused by high-density tourist flows. Tourism accessibility shows a weak positive effect only at medium-to-high levels, while per capita tourism expenditure exerts no substantive influence. This suggests that the current demand structure is insufficient to drive meaningful improvements in fishery–tourism synergy.
Regional Heterogeneity of Key Driving Factors
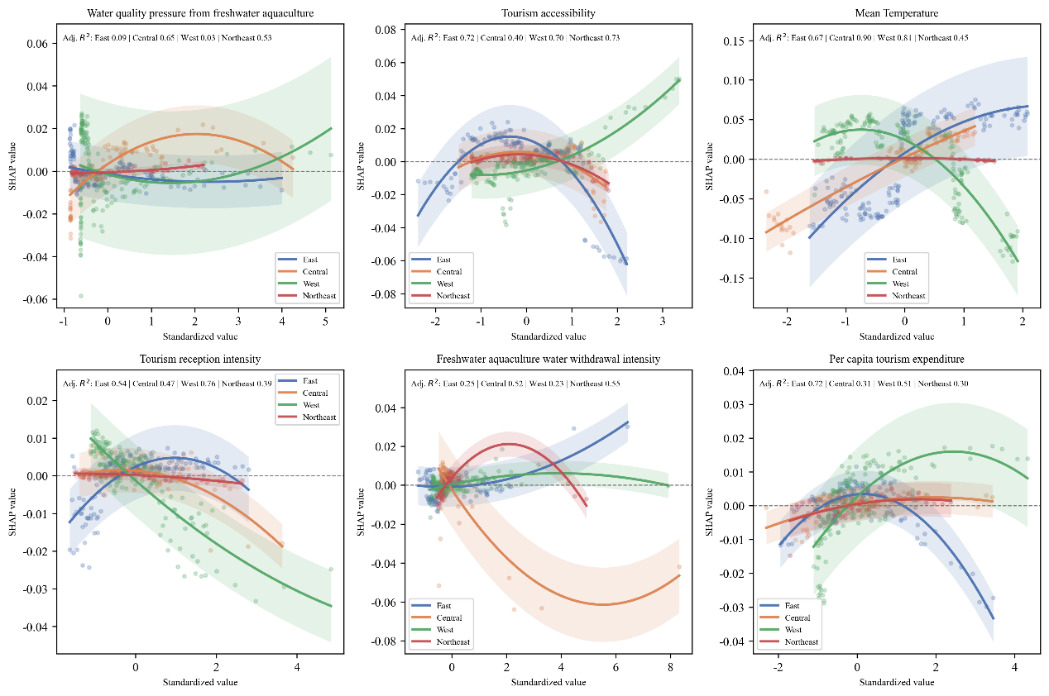
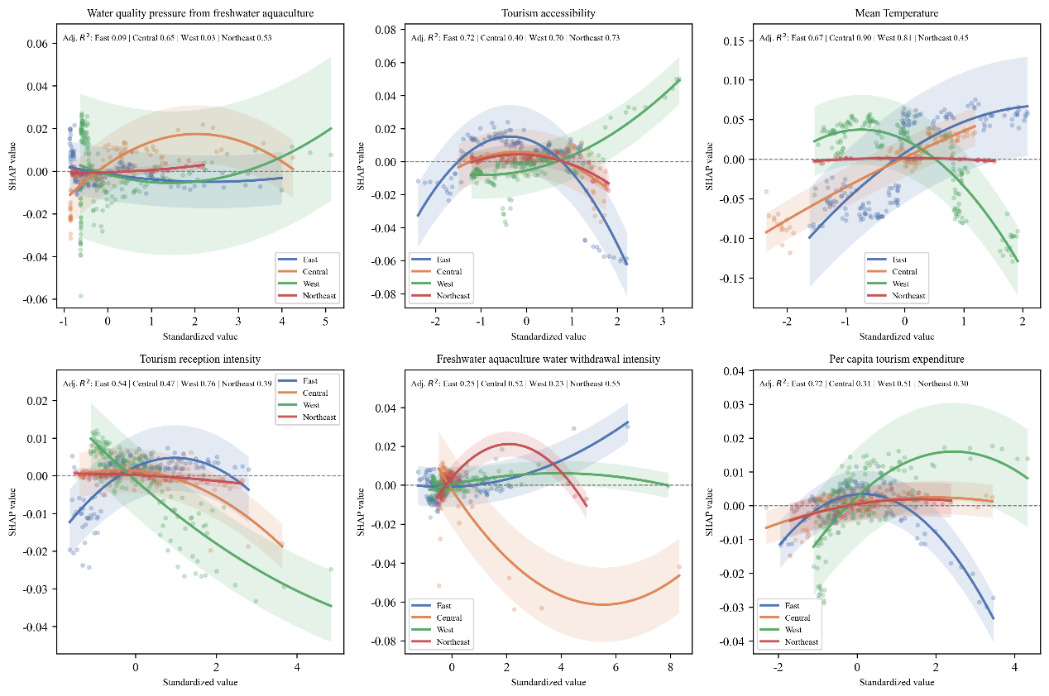
Based on the SHAP importance ranking, the explanatory power of response curves, and policy relevance, six key variables are selected to analyze regional differentiation mechanisms. As shown in Figure 7, water environmental pressure and tourism intensity exhibit consistent directional effects at the national level, but substantial regional heterogeneity exists across the eastern, central, western, and northeastern regions in terms of sensitivity and threshold locations. In contrast, tourism accessibility and tourism expenditure display opposite effects between the eastern and western regions, while water resource intensity imposes much stronger constraints in the central and northeastern regions than in the eastern and western regions. The main findings are as follows:
(1) Resource and environmental conditions and natural endowments: strongest constraints in the central and northeastern regions. Water quality pressure shows a typical inverted U-shaped relationship, with the central and northeastern regions being the most sensitive. Once pressure exceeds the threshold, the effect rapidly turns negative, indicating that ecological carrying capacity is more fragile in these regions. In contrast, changes in the eastern and western regions are relatively mild, suggesting that water environmental pressure has not yet become a binding constraint. Aquaculture water-withdrawal intensity also exhibits pronounced regional differentiation. In the eastern region, the effect is positive and increasing, reflecting that scale expansion still generates synergistic benefits. In the central and northeastern regions, however, the relationship follows an inverted U-shape, with high withdrawal intensity exerting negative impacts on Adaptation. The effect in the western region is the weakest, consistent with its relatively limited aquaculture scale. Although temperature effects are generally modest, the central region shows a stable positive effect, while the western region exhibits an inverted U-shaped pattern, indicating that arid climatic conditions combined with high temperatures may constrain further improvements in Adaptation.
(2) Economic and spatial support conditions: clear regional differentiation across development stages. Tourism accessibility displays a pronounced “negative in the east, positive in the west” pattern. Improvements in accessibility generate significant positive effects in the western region, suggesting that transport infrastructure upgrades effectively alleviate market disadvantages. By contrast, the response curves in the eastern and northeastern regions are predominantly negative, implying that high accessibility intensifies spatial competition and environmental pressure.
(3) Tourism demands scale and structure: stronger pressure effects in the east and highest sensitivity in the west. Tourism intensity exerts negative effects across all four regions, with the steepest decline observed in the western region, where ecological fragility amplifies sensitivity to high tourist density. The eastern and central regions also show pronounced negative effects, indicating that high-volume tourism continues to crowd out space for fisheries. The effect in the northeastern region is relatively moderate. Per capita tourism expenditure has a strong negative effect in the eastern region, where high-end consumption tends to concentrate on coastal scenic resources, thereby displacing fishery–tourism composite spaces. In contrast, the western region exhibits a weak inverted U-shaped relationship, suggesting that moderate upgrading of tourism consumption may expand market space. Effects in the central and northeastern regions are close to zero.
Discussion
Constraints on the Transformation of Freshwater Aquaculture Efficiency Improvements into Recreational Fisheries Development and Their Structural Causes
The results indicate that although both freshwater aquaculture efficiency and the level of recreational fisheries development exhibit upward trends, the improvement in their composite Adaptation level remains relatively limited. This suggests that efficiency gains do not automatically translate into synergistic advantages for recreational fisheries development. This phenomenon reveals that the relationship between the two systems is not governed by a simple linear transmission mechanism, but is instead jointly shaped by differences in industrial functional attributes and structural constraints. This finding is consistent with existing studies on the multifunctional transformation of fisheries, which suggest that improvements in production efficiency do not necessarily lead to simultaneous enhancement of recreational or service functions.10 However, much of the related literature has focused primarily on identifying empirical patterns, while providing relatively limited explanations of the internal mechanisms that hinder the spillover of efficiency gains.
The present study further suggests that the decoupling between efficiency and recreational functions may be related to structural differences between production-oriented and service-oriented industries in terms of objective functions, spatial requirements, and factor allocation. Improvements in freshwater aquaculture efficiency are mainly driven by technological progress and input intensification on the production side, with the core objective of reducing unit costs and increasing output efficiency. In contrast, the development of recreational fisheries relies more heavily on environmental quality, spatial organization, and consumption experiences, and its development logic is not fully congruent with that of production efficiency enhancement.7 Under these conditions, efficiency advantages in aquaculture can spill over into recreational fisheries only through mediating mechanisms such as demand pull, product form transformation, and institutional linkages. When these transmission channels are insufficient or constrained, efficiency gains tend to be “locked in” within the production system, manifesting as a structural pattern in which efficiency continues to improve while the Adaptation level increases only slowly. This indicates that synergistic development within multifunctional industrial systems depends not merely on the degree of efficiency improvement in a single system, but more critically on the smooth functioning of transformation mechanisms and the degree of structural alignment among different functions.
Spatial Conditions and Pathways Underlying Regional Differentiation in the Adaptation Level
Against the backdrop of generally constrained transformation of freshwater aquaculture efficiency into recreational fisheries functions, substantial regional differences in Adaptation levels persist. This indicates that the underlying structural constraints do not operate uniformly across regions, but are jointly shaped by resource and environmental conditions, spatial configurations, and demand-side contexts. Specifically, the relatively high and stable Adaptation observed in the central region does not imply that structural barriers to efficiency transformation have been overcome; rather, it reflects a buffering effect arising from regional spatial structure and development stage. More abundant water and shoreline resources, a relatively dispersed distribution of production factors, and moderate tourism demand intensity prevent efficiency improvements from approaching ecological and spatial carrying thresholds, thereby avoiding pronounced crowding-out effects on recreational functions. Under such conditions, transformation constraints remain in place, but their negative impacts are attenuated, resulting in a relatively stable Adaptation level.
By contrast, the eastern region follows a different pathway. Highly concentrated industrial and population structures, tightly constrained water and shoreline resources, and intensive tourism activities cause efficiency gains to approach ecological and spatial thresholds more rapidly, amplifying structural tensions between efficiency enhancement and the expansion of recreational functions. In this context, even where recreational fisheries demand is strong and market and service infrastructures are well developed, efficiency improvements may erode Adaptation through the accumulation of environmental pressure and intensified spatial competition. The outcome is therefore more often characterized by a gradual recovery from low to moderate Adaptation, rather than sustained upward progression.
The persistently low Adaptation in the northeastern region reflects yet another spatial context. When demand-side contraction, population outflow, and industrial structural rigidity coexist, constraints on efficiency transformation are reinforced. Improvements in freshwater aquaculture efficiency lack sufficient recreational carriers and market feedback, making it difficult for Adaptation levels to achieve effective breakthroughs and leading to pronounced path dependence.
Overall, regional differences in Adaptation do not indicate whether a given region performs “better” or “worse” in terms of recreational fisheries or freshwater aquaculture development per se. Rather, they reflect heterogeneous outcomes of a common efficiency–recreation transformation mechanism operating under distinct spatial conditions. While existing studies often attribute regional disparities to differences in development level or resource endowment, the present findings suggest that the critical factor lies not in efficiency improvement itself, but in whether such gains fall within spatial and demand ranges that can be effectively absorbed by recreational functions. This implies that efficiency–function synergy is not a process that can be simply replicated or linearly scaled across space, but a fundamentally context-dependent outcome. The findings suggest that when ecological carrying capacity, spatial availability, and industrial structure are more compatible, efficiency advantages are more likely to be translated into higher Adaptation levels; otherwise, Adaptation may stagnate or even decline despite continued efficiency growth. In this sense, regional differentiation in Adaptation should be understood not as a transitional deviation in multifunctional development, but as an endogenous outcome of multifunctional expansion under spatial constraints. By foregrounding the role of spatial conditions and pathways, this study extends current understandings of fisheries multifunctionalization and provides a new analytical lens for interpreting regional heterogeneity in Adaptation outcomes.
Policy Implications
Building on the foregoing discussion of the structural constraints that limit the transformation of freshwater aquaculture efficiency into recreational fisheries development, as well as the pronounced regional differentiation in their Adaptation levels, related policies should place greater emphasis on optimizing inter-system coordination rather than focusing solely on the growth rate or scale expansion of individual subsystems.
First, greater efforts should be devoted to improving the institutional arrangements and implementation vehicles that facilitate the transformation of freshwater aquaculture efficiency into recreational fisheries functions. Given that efficiency improvements do not automatically translate into synergistic advantages for recreational fisheries development, policy priorities should shift from the exclusive promotion of production efficiency toward strengthening the application scenarios and realization pathways through which efficiency gains can be embedded in recreational fisheries.44 This can be achieved by promoting facility-based, experience-oriented, and multifunctional recreational fisheries models, thereby enhancing the effective linkage between technological progress in aquaculture, improvements in product quality, and evolving recreational consumption demand, and reducing structural frictions in inter-system transformation.
Second, differentiated and place-based pathways should be adopted to advance the coordinated development of recreational fisheries and freshwater aquaculture. Regional disparities in Adaptation indicate substantial differences across regions in terms of resource endowments, industrial foundations, and spatial constraints, implying that uniform development models are unlikely to achieve optimal coordination.45 The central region can further consolidate the coupling between efficiency advantages and recreational functions while maintaining its existing structural balance. In contrast, the eastern region should place greater emphasis on spatial and ecological constraints, enhancing industrial quality while preventing the risk of system mismatch. Regions with relatively low Adaptation levels should prioritize addressing institutional linkages and functional transformation bottlenecks, rather than simply replicating high-intensity development trajectories.
Third, the Adaptation relationship should be incorporated as a key evaluative perspective in coordinating the multifunctional development of fisheries. Compared with assessments that focus solely on aquaculture efficiency or the level of recreational fisheries development, an Adaptation-oriented perspective more effectively captures the quality of inter-system coordination and potential systemic risks. Integrating Adaptation indicators into fisheries transformation and regional development evaluation frameworks would help identify latent issues characterized by efficiency gains without corresponding improvements in coordination, thereby providing more precise decision support for optimizing industrial structures, spatial allocation, and resource utilization.
Limitations and Future Research
Although this study provides a systematic analysis of the synergistic relationship between recreational fisheries development and freshwater aquaculture efficiency from a composite Adaptation perspective, several limitations should be acknowledged. First, this study relies on aggregated provincial-level data, which may mask substantial intra-provincial heterogeneity across cities, counties, and specific water bodies. As a result, localized differences in the Adaptation relationship may not be fully captured. Second, the Adaptation relationship exhibits clear multi-scale evolutionary characteristics. The present analysis is conducted mainly at the provincial level and does not further explore finer-grained differences at the municipal, county, or specific water-body levels. Third, while the results focus on identifying inter-system association structures and interaction patterns, there remains scope for deeper investigation into causal mechanisms. Future research could integrate higher-resolution data and causal inference approaches to provide a more comprehensive understanding of the formation and evolution of Adaptation relationships.
Conclusion
Based on provincial panel data for China from 2008 to 2023, this study systematically examines the spatiotemporal evolution and underlying mechanisms of the relationship between recreational fisheries development and freshwater aquaculture efficiency from a composite Adaptation perspective. The main conclusions are as follows:
(1) During the study period, both the level of recreational fisheries development and freshwater aquaculture efficiency exhibit steady upward trends. However, their composite Adaptation level remains persistently within a low-to-medium range, with limited changes in stage-wise averages. This indicates that improvements in efficiency have not been translated into synergistic benefits for recreational fisheries development, and that significant structural mismatches persist between the two systems.
(2) The composite Adaptation relationship displays pronounced regional differentiation, characterized by a pattern of “persistently high Adaptation in the central region, a transition from low to medium–high Adaptation in the eastern region, moderate and differentiated Adaptation in the western region, and generally low and weakening Adaptation in the northeastern region.” Adaptation levels are not determined solely by industrial scale or economic development, but depend more critically on the degree of structural alignment among freshwater aquaculture foundations, resource and environmental conditions, and the capacity to transform efficiency gains into recreational functions.
(3) Analysis of the driving mechanisms reveals that the composite Adaptation level is shaped by the nonlinear joint effects of multiple factors. Among these, ecological and environmental constraints and tourism intensity emerge as key limiting factors, while aquaculture structural optimization and economic development exert facilitating effects within specific ranges. Overall, the coordinated development of recreational fisheries and freshwater aquaculture appears to depend on reducing structural frictions in the transformation of efficiency gains into functional outcomes and improving the overall Adaptation level of the system through differentiated, place-based regulatory pathways.
(4) More broadly, the Adaptation perspective provides a useful analytical framework for managing multifunctional systems, as it helps identify not only the performance of individual subsystems but also the quality of their coordination and the risks arising from structural mismatch.
Acknowledgments
This research was supported by the Key Scientific Research Project of the Hunan Provincial Department of Education under the project “Mechanisms and Policy Responses for High-Quality Development of Red Tourism in Hunan Enabled by Digital Technologies” (No. 22A0519).
CRediT - Authors’ Contribution
Writing – review & editing: Xianglan Hu (Equal), Jingzhou Liu (Equal). Funding acquisition: Xianglan Hu (Lead). Resources: Xianglan Hu (Lead). Supervision: Xianglan Hu (Lead). Conceptualization: Jingzhou Liu (Lead). Methodology: Jingzhou Liu (Lead). Formal Analysis: Jingzhou Liu (Lead). Investigation: Jingzhou Liu (Lead). Writing – original draft: Jingzhou Liu (Lead).
Competing of Interest – COPE
No competing interests were disclosed.
Ethical Conduct Approval – IACUC
No animal or plant experiments were involved in this study, and therefore ethical approval was not required.
Informed Consent Statement
All authors and institutions have confirmed this manuscript for publication.
Data Availability Statement
All are available upon reasonable request.