
INTRODUCTION
Channa argus and Channa maculata belong to the genus Channa, family Channidae, order Perciformes1. C. argus is primarily distributed from the Yangtze River basin to the Amur River basin, whereas C. maculata primarily occurs within the Yangtze and Pearl River basin2. Both species are important freshwater economic fishes in China. Furthermore, in recent years, with the rapid development of hybrid breeding techniques, interspecific hybridization between C. argus and C. maculata has successfully produced hybrid snakeheads, such as C. argus♀ × C. maculata♂ and C. maculata♀ × C. argus♂, which exhibit desirable traits from both parent species. Because of their superior growth performance and enhanced stress resistance, these hybrid snakeheads have been widely promoted in aquaculture practices3. Nevertheless, the expanding aquaculture has raised ecological concerns. Studies have shown that both C. argus♀ × C. maculata♂ and C. maculata♀ × C. argus♂ are fertile hybrid progenies4. Escaped farmed individuals can mate bidirectionally with wild C. argus and C. maculata in natural waters, leading to genetic introgression. This disrupts the genetic structure of wild populations, contaminates native germplasm gene pools, and impairs the genetic integrity of wild germplasm, thereby posing a potential threat to wild resource conservation and aquatic selective breeding programs. A key challenge is that hybrids are highly morphologically similar to their parental species, making accurate identification difficult using traditional morphological methods alone.
Molecular genetic methods, such as microsatellite markers, mitochondrial DNA (mtDNA) sequencing, and single-nucleotide polymorphism (SNP) genotyping, are generally recognized as the gold standard for hybrid identification and detection of genetic introgression. However, these approaches rely on specialized laboratory equipment, high analytical costs, trained technical personnel and long turnaround times. They also require invasive tissue sampling, which makes them unsuitable for rapid on-site screening on aquaculture farms, large-scale wild-resource surveys, and scenarios where laboratory facilities are inaccessible. In contrast, morphological identification is cost-effective, fast to perform, and directly applicable in field conditions without sophisticated instruments, making it an indispensable practical tool for routine germplasm screening and preliminary identification.
Morphology-based identification represents a practical complementary approach to molecular methods. Fish body and otoliths morphology is an important tool for fish species and population identification5,6. The external morphological characteristics of fish can directly reflect their group-specific differences and adaptations to the environment7. Traditional morphometrics, which primarily rely on simple comparisons of meristic characteristics, often prove inadequate for the accurate identification of different populations8. The truss network method works by establishing a set of anatomical landmark points and then connecting them longitudinally, transversely, and obliquely to generate distances that cover the head, trunk, and tail regions. By capturing shape variations throughout the entire body, this approach markedly improves the taxonomic resolution and stock-identification accuracy9. Otoliths are biogenic carbonate structures that accumulate in the inner ear during fish growth. Because of their metabolic inertness, they resist resorption, distortion, and postmortem degradation, and thus have become the structure of choice for stock discrimination across a wide range of species10. In addition, Fourier analysis, which is valued for its strong operability and broad applicability, effectively describes otolith contours, and its intuitive and interpretable results make it particularly favored by researchers11–13. Current morphological research on Channa species remains relatively limited. To date, only Liu et al.14 have analyzed the morphological variation in two native snakehead species and their hybrid progeny using traditional morphological measurements and truss network analysis. No previous studies have comprehensively investigated the morphological differentiation and otolith morphological characteristics of C. argus, C. maculata and their reciprocal hybrid offspring.
This study aims to employ traditional morphological measurements, truss network analysis, and otolith elliptical Fourier analysis to systematically investigate morphological differences among the four Channa populations and establish a high-precision, comprehensive discrimination model. The results of this study will not only enable accurate identification of the four Channa populations but also further enrich the research on morphological differentiation of Channa species and improve the basic morphological data of Channa germplasm. Meanwhile, this study will provide technical support for parental identification in Channa breeding programs and serve as a reference method for morphological discrimination of different populations of other aquatic animals.
MATERIALS AND METHODS
EXPERIMENTAL ANIMAL
The samples used in this study were collected in September 2023 from Jinan City, Shandong Province. The collection comprised 53 C. argus individuals from the Modern Fisheries Science and Innovation Base of the Shandong Freshwater Fisheries Research Institute, along with 47 C. maculata, 48 C. argus ♀ × C. maculata ♂, and 52 C. maculata ♀ × C. argus ♂ individuals, which were sourced from the Pearl River Fisheries Research Institute of the Chinese Academy of Fishery Sciences, for a total of 200 specimens. Detailed rearing parameters, including exact age, generation, full parental pedigree, and fine-scale environmental conditions (e.g., water temperature profile, stocking density, and precise diet formulation), were not available for all groups, as the specimens were sourced from established cultured populations at two separate research institutes. Each variety was cultured in independent units under monoculture conditions, without polyculture with other fish species. After capturing the samples, the fish bodies were numbered as samples, measured, and their basic data, such as weight and body length, were recorded (shown in Table 1).
EXPERIMENTAL METHODS
FISH MORPHOMETRIC MEASUREMENTS
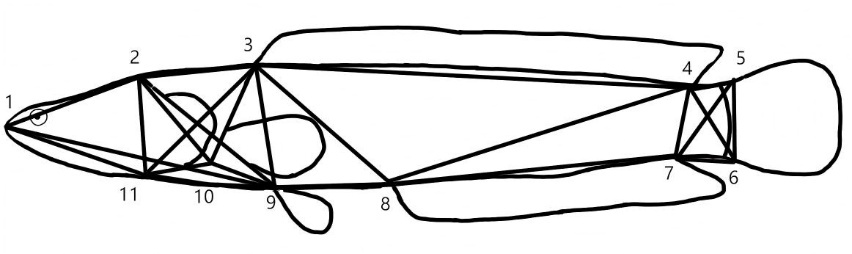
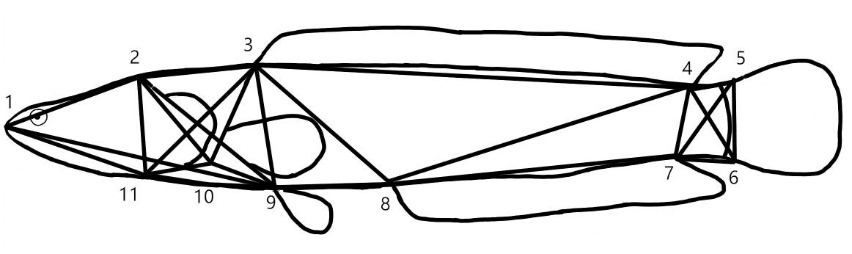
Morphometric data comprised traditional and truss network measurements, which were taken using a ruler (accurate to 0.1 cm) and digital calipers (accurate to 0.01 mm). Traditional morphometric traits included the 11 parameters, namely total length, standard length, caudal peduncle length, head length, snout length, eye diameter, body width, interorbital width, body depth, head depth, and caudal peduncle depth15,16. The standard length was used exclusively as the reference variable for size standardization, and the remaining 10 morphological parameters were included in subsequent statistical analyses. In addition, the truss network measurements were defined by 11 anatomical landmarks, namely the snout tip, posterior end of the head, origin of dorsal fin base, end of dorsal fin base, origin of upper caudal fin, origin of lower caudal fin, end of anal fin base, origin of anal fin base, origin of pelvic fin base, posterior edge of operculum, and posterior end of the maxilla8. A total of 24 truss distances between these anatomical landmarks were measured, as illustrated in Figure 1. The body mass was measured using an electronic scale (accurate to 0.1 g).
OTOLITH AND ITS MORPHOLOGICAL CONTOUR EXTRACTION
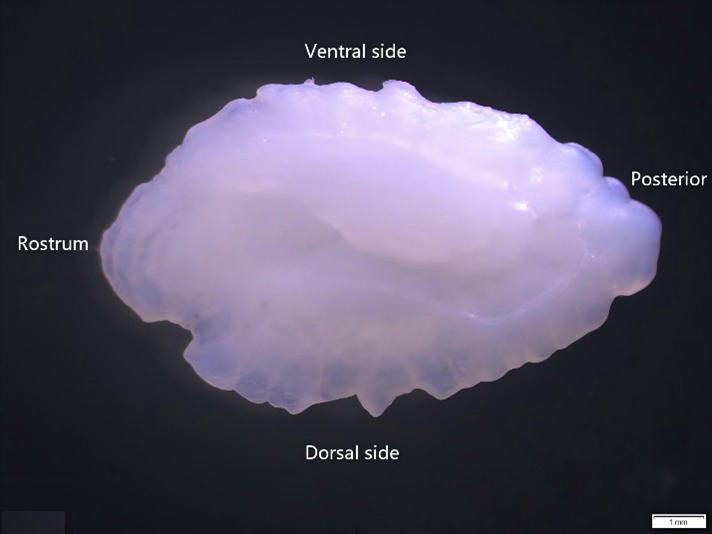
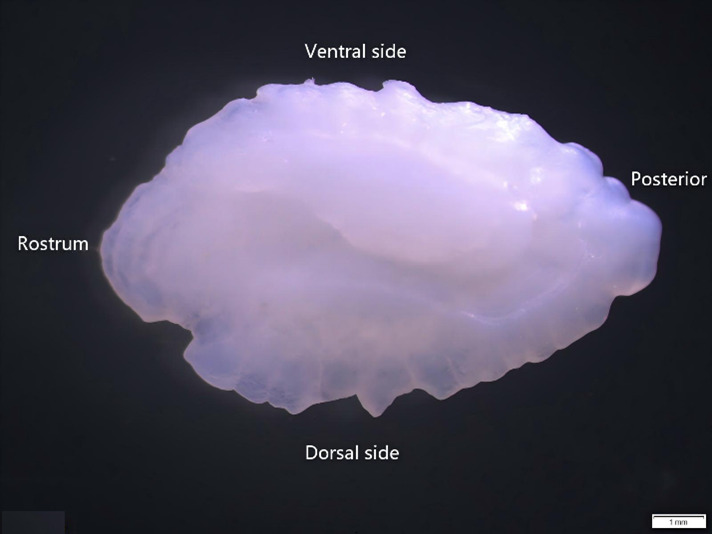
During the experiment, the otoliths were dissected from the vestibular sacs of each fish, washed with clean water to remove the surface membrane mucus and other impurities, dried and then stored at room temperature in centrifuge tubes. According to the position of the otoliths within the fish’s body, the directions towards the fish’s head, tail, back, and abdomen were respectively called the rostrum, posterior, dorsal side, and ventral side (as shown in Figure 2)17. Following the analytical method of Kélig et al.18, paired t-tests were performed separately on the left and right otoliths of the four groups. Results showed no significant differences between left and right otoliths in all four groups (P > 0.05). Morphological data from the left otolith were used for analysis in this study; if the left otolith was damaged or missing, the right otolith was used as a substitute. All right otolith images were horizontally mirrored prior to contour extraction to ensure consistent orientation (rostrum facing left, dorsal side upward) across all samples, so as to avoid introducing artificial shape variation. Severely damaged otoliths were excluded. Dried otoliths were placed with the convex surface facing upwards and the concave surface facing downwards in the 0.79× magnification setting of the Olympus optical microscope for photography. Otolith contours were extracted using the “Shape R” package in R software19, and 1000 continuous coordinate points were automatically sampled along each contour. These coordinate points were then transformed into Fourier coefficients to quantitatively describe otolith shape. Campana10 demonstrated that the Fourier parameters derived from the first 20 harmonics are sufficient to adequately describe and reconstruct otolith contours. Subsequent studies further confirmed that 8-12 harmonics are sufficient to capture more than 95% of the otolith shape variation for most teleost fishes20. Considering the morphological characteristics of the samples used in this study, we ultimately selected 9 harmonics for analysis. Each harmonic corresponds to four Fourier coefficients (aₙ, bₙ, cₙ, dₙ), yielding a total of 36 initial coefficients per sample. Meanwhile, since Fourier shape descriptors are sensitive to geometric transformations (i.e., position, size and orientation) of digitized otolith contours, the raw parameters must be standardized prior to subsequent statistical analyses. After fixing the coefficients of the first harmonic to a₁ = 1 and c₁ = 0 to remove two redundant coefficients, a total of 34 standardized Fourier coefficients were obtained for each otolith sample and subsequently subjected to stepwise discriminant analysis.
DATA PROCESSING
FISH MORPHOLOGICAL DATA ANALYSIS
To eliminate the influence of body size variation, size standardization was performed using the ratio method. For traditional morphometric traits, head measurements were divided by head length, caudal peduncle traits by caudal peduncle depth, and other body measurements by standard length; for truss network measurements, each characteristic value was divided by standard length. Data analysis was performed using SPSS 26.0 software. A one-way analysis of variance (ANOVA) was employed to evaluate the differences in the truss network measurements among the four fish groups, with the significance level determined based on the P-value, P > 0.05 indicated no significant difference, P < 0.05 indicated a significant difference, and P < 0.01 indicated a highly significant difference. Post hoc pairwise comparisons were performed using the least significant difference (LSD) test. The superscript letters (a/b/c) in Table 2 that denote inter-group differences were generated from the LSD test results. Principal component analysis (PCA) was performed on the 24 corrected truss measurement traits to extract principal components with larger eigenvalues. Stepwise discriminant analysis (SDA) was applied to both traditional morphometric data and truss morphometric data. Morphological parameters with the highest contribution to interspecific morphological differences were screened using Wilks’ Lambda statistic, discriminant functions were established, and the discriminant accuracy for each species and the overall discriminant rate were calculated. The formula for calculating discriminant accuracy is as follows11:
\[ P_{\mathrm{a}}=\frac{A}{B} \times 100 \% \]
where Pa represents the discriminant accuracy; A refers to the actual number of individuals measured in that group; and B indicates the number of individuals classified into that group.
\[ P_{\mathrm{c}}=\frac{\sum_{\mathrm{n}}^{i=1} A_i}{\sum_n^{i=1} B_i} \]
where Pc denotes the overall classification rate; Ai represents the number of correctly classified individuals in the i-th group; Bi refers to the actual number of individuals in the i-th group; and n is the total number of groups.
OTOLITH MORPHOLOGICAL DATA ANALYSIS
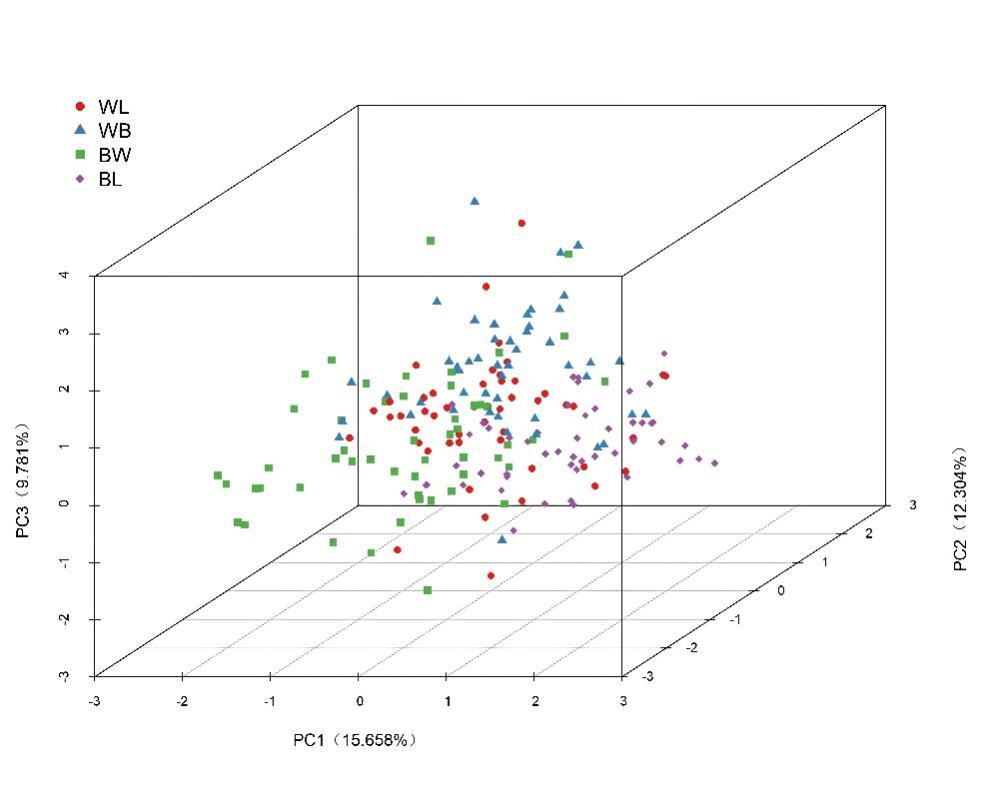
Homogeneity of variance test was performed on the 34 Fourier parameters using Levene’s method in SPSS. Parameters with non-homogeneous variance were excluded before conducting normality tests. Appropriate factors were selected for principal component analysis (PCA), and a three-dimensional principal component scatter plot was generated based on the scores of the first three principal components (PC1, PC2 and PC3). Finally, stepwise discriminant analysis (SDA) was performed to establish discriminant functions and calculate discriminant accuracies9.
RESULTS
FISH MORPHOLOGY RESULTS
PRELIMINARY COMPARISON BASED ON BODY TRUSS NETWORK MEASUREMENTS
The results for the standardized truss network measurement for C. argus, C. argus♀ × C. maculata♂, C. maculata♀ × C. argus♂, and C. maculata are presented in Table 2. The one-way ANOVA performed on the 24 standardized truss measurements 22 showed highly significant differences among the four groups (P < 0.01), and the remaining 2 traits (9-11 and 1-9) showed significant differences (P < 0.05). These morphological variations were distributed across the head, trunk, and caudal regions of the fish’s body.
PCA BASED ON BODY TRUSS NETWORK MEASUREMENTS
PCA extracted four principal components with eigenvalues > 1 from the 24 truss network parameters of C. argus, C. argus♀ × C. maculata♂, C. maculata♀ × C. argus♂, and C. maculata, as shown in Table 3. These components (PC1, PC2, PC3, and PC4) accounted for 43.718%, 11.687%, 8.316%, and 4.406% of the morphological variation, respectively, with a cumulative contribution of 68.127%. The traits with the highest loadings on PC1 were, in order: 2–11 (posterior end of head to posterior end of maxilla), 1–9 (snout tip to origin of pelvic fin base), 4–7 (end of dorsal fin base to end of anal fin base), 5–7 (origin of upper caudal fin to end of anal fin base), 3–8 (origin of dorsal fin base to origin of anal fin base), 3–11 (origin of dorsal fin base to posterior end of maxilla), and 3–10 (origin of dorsal fin base to posterior edge of operculum), which primarily reflected characteristics of the head and caudal regions. The key contributor to PC2 was trait 7–8 (end of anal fin base to origin of anal fin base), which primarily represents features of the trunk region.
DISCRIMINANT ANALYSIS BASED ON BODY MORPHOMETRIC PARAMETERS
SDA was performed on the 10 traditional and 24 truss morphometric parameters. This procedure ultimately selected 2 traditional measurement traits (standard length/total length, body width/standard length,) and 13 truss network measurements (1–2, 2–3, 4–5, 5–6, 6–7, 9–10, 10–11, 9–11, 2–10, 3–11, 3–9, 4–8, and 4–7) to construct the discriminant functions. Following Fisher’s discriminant criterion, each individual of the C. argus, C. argus♀ × C. maculata♂, C. maculata♀ × C. argus♂, and C. maculata species and hybrids were classified by substituting their traditional and truss morphometric traits into their respective established discriminant functions. Individuals were assigned to the group for which the corresponding discriminant function value (Yi) was highest. The results revealed that the traditional morphometric method achieved the highest identification rate for C. argus (66.7%), followed by reciprocal hybrid C. maculata♀ × C. argus♂ (43.8%) and C. maculata (40.8%), with the lowest rate observed for hybrid C. argus♀ × C. maculata♂ (35.4%). The overall correct classification rate using traditional measurements was 43.9%. The cross-validated discriminant results showed that the discriminant accuracies of the four groups in descending order were C. argus (66.7%), C. maculata♀ × C. argus♂ (45.8%), C. maculata (40.8%) and C. argus♀ × C. maculata♂ (33.3%), with an overall discriminant accuracy of 42.2%. In contrast, the truss network method produced higher identification accuracies for the four snakehead groups, in the order of C. maculata (96.7%), hybrid C. argus♀ × C. maculata♂ (95.8%), reciprocal hybrid C. maculata♀ × C. argus♂ (88.5%), and C. argus (87.8%), with an overall discriminant accuracy of 91.6%. The cross-validated discriminant results showed that the discriminant accuracies of the four groups in descending order were C. argus (96.7%), C. maculata (85.7%), C. argus♀ × C. maculata♂ (85.4%) and C. maculata♀ × C. argus♂ (84.6%), with an overall discriminant accuracy of 87.2%.
OTOLITH MORPHOLOGICAL RESULTS
OTOLITH MORPHOLOGICAL CHARACTERISTICS AND RECONSTRUCTION
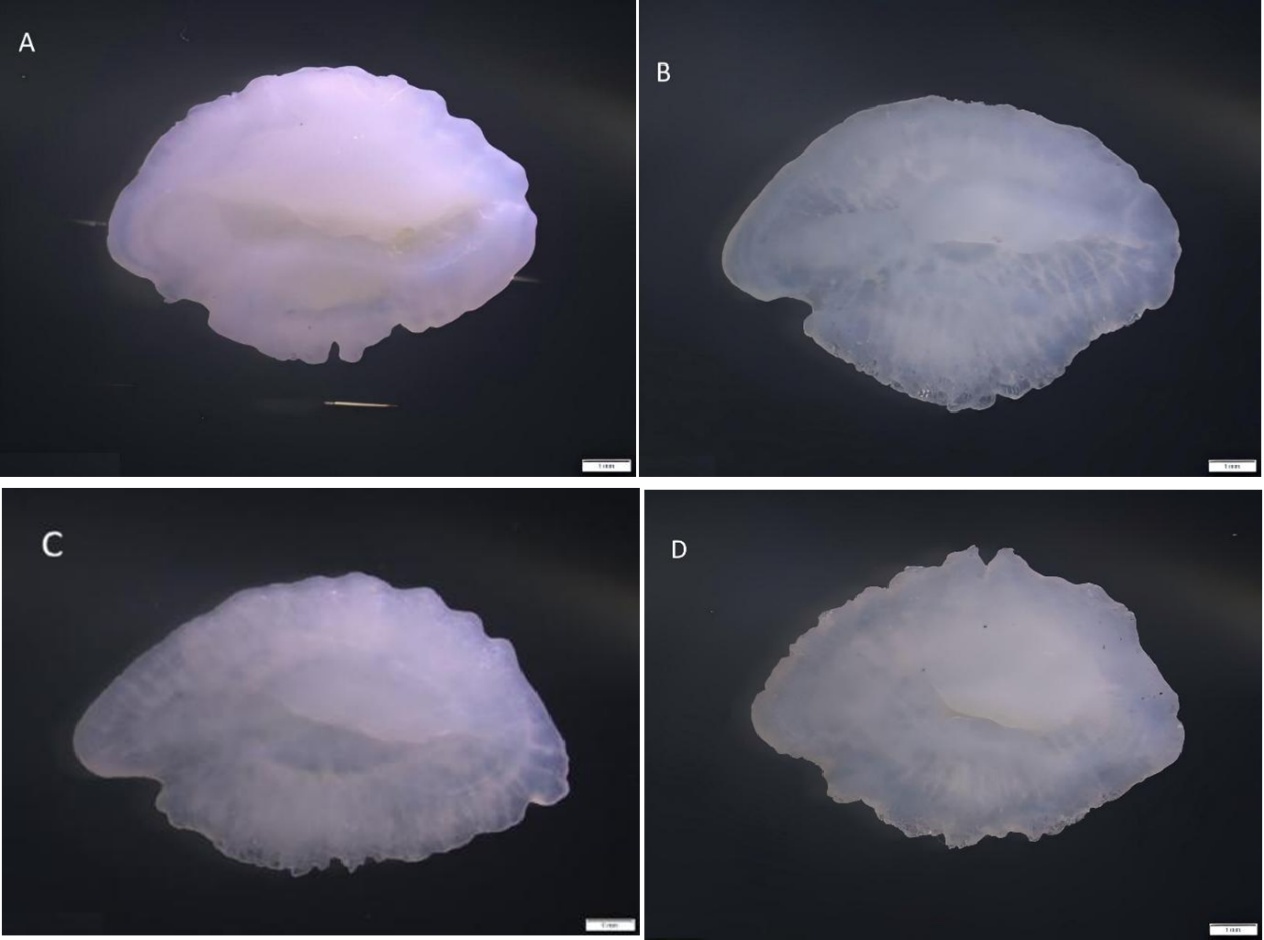
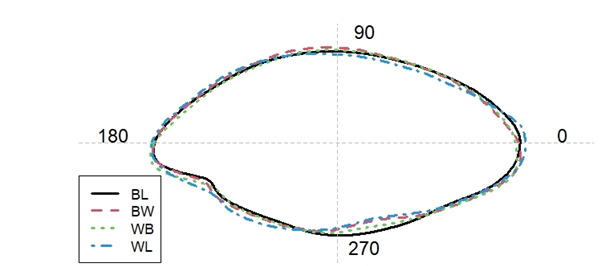
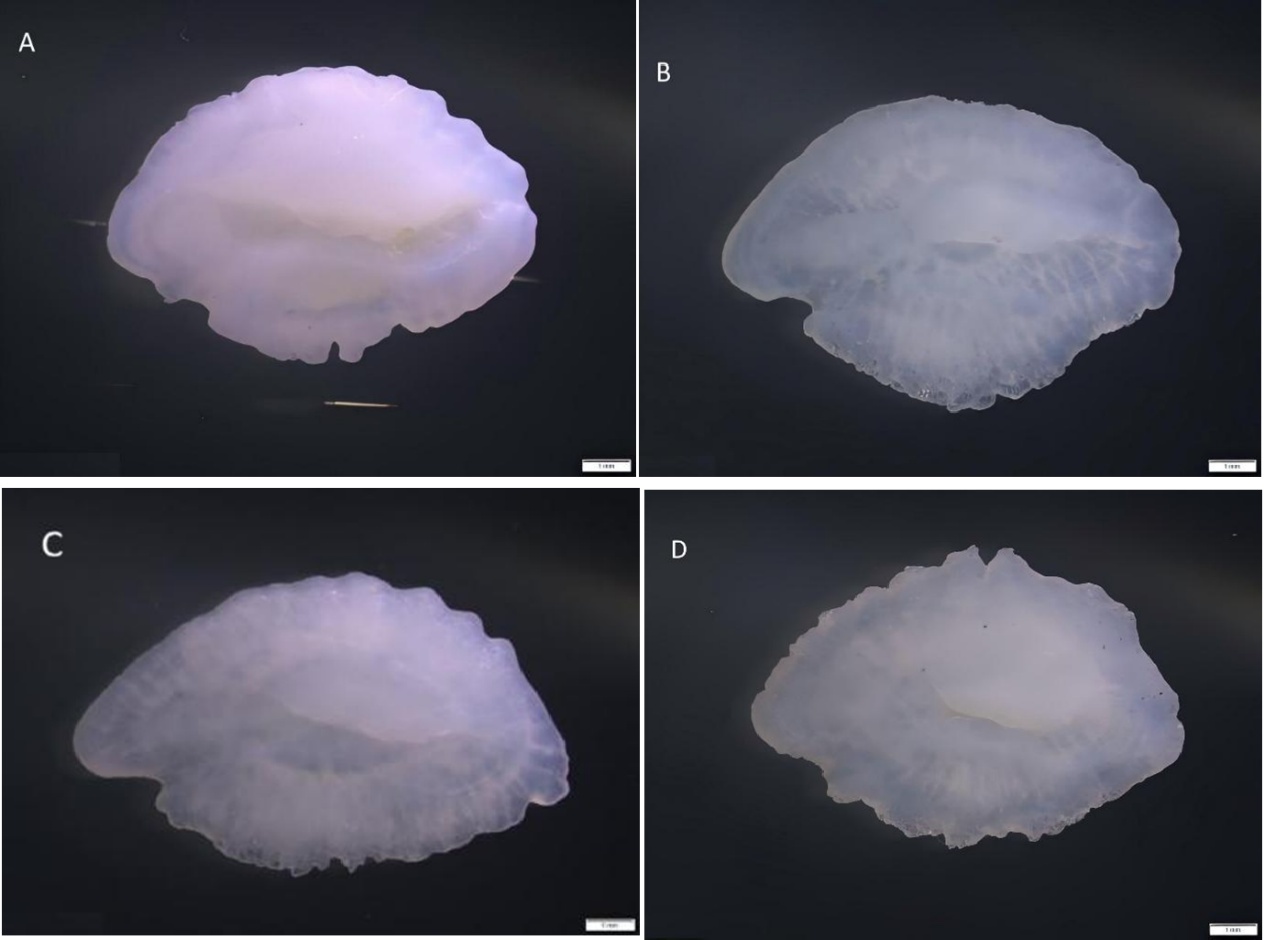
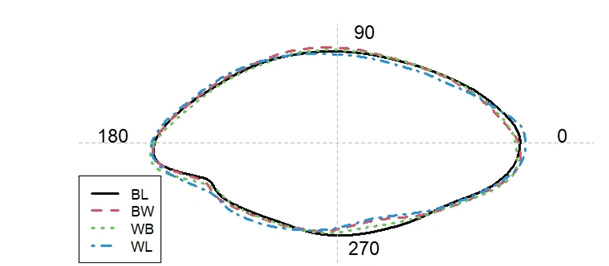
The left sagittal otoliths of the four Channa species are shown in Figure 3. It can be seen from Figure 4 that, the otoliths of C. argus, C. argus♀ × C. maculata♂, C. maculata♀ × C. argus♂, and C. maculata generally exhibited an overall oval-shaped contour with a long and rounded rostrum. The dorsal and ventral sides showed prominent, smoothly curved projections. The posterior region was broader, shorter, and relatively smoother compared to the anterior region. The anterior region was narrower, gradually widening toward the dorsal and ventral sides to reach its maximum width, then tapering toward the posterior. Comparative analysis of the otoliths from the four fish groups reveals distinct morphological differences, which were particularly evident in the anterior (180–260°), dorsal (270–300°), and posterior (0–20°) regions. In the anterior region (180–260°), the C. argus otolith displays the largest and flattest contour. A noticeable concavity is observed in the hybrids (C. argus♀ × C. maculata♂ and C. maculata♀ × C. argus♂) and C. maculata, with the deepest concavity found in C. maculata. In the dorsal region (270–300°), the C. argus otolith possessed the smallest contour, followed by C. maculata♀ × C. argus♂ and C. argus♀ × C. maculata♂. Furthermore, the C. maculata otolith exhibited the largest and most rounded contour in this area. In the posterior region (0–20°), the two hybrid groups showed similar structural contours, which were smaller than those of C. maculata. The C. argus otolith exhibited the largest contour in the posterior section.
PCA BASED ON OTOLITH MORPHOLOGICAL PARAMETERS
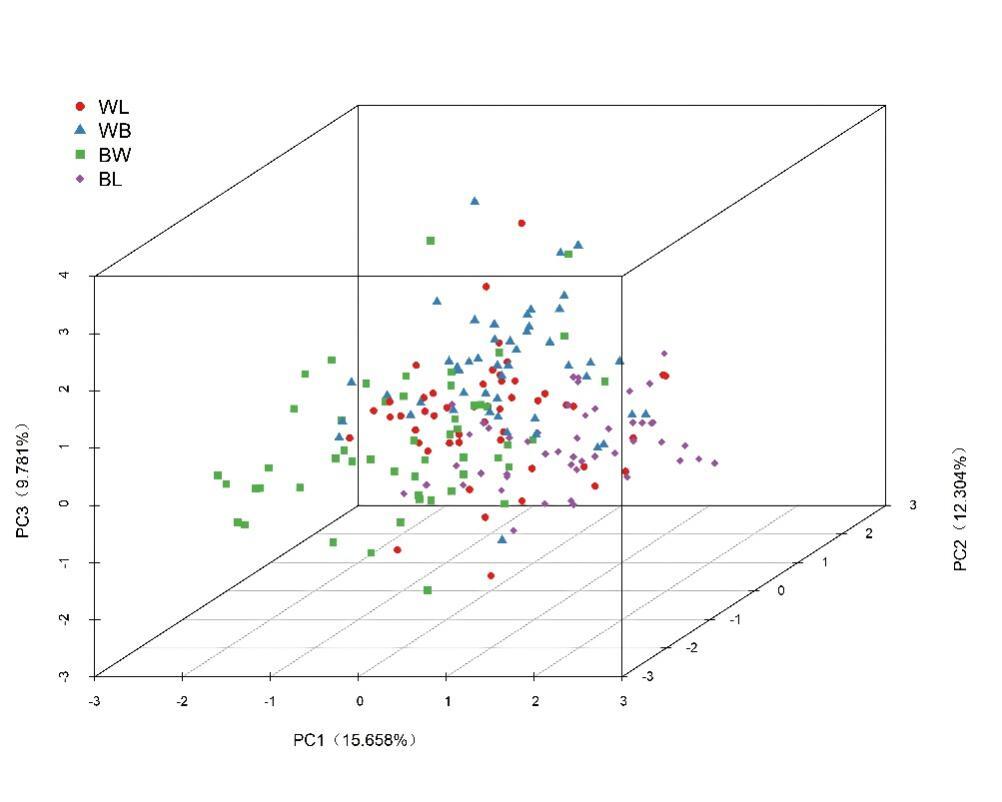
PCA was performed on the 34 otolith parameters that were obtained through Fourier analysis. The results are presented in Table 4. Ten principal components with initial eigenvalues greater than 1 were extracted, which collectively explained 76.908% of the total variance. The first three principal components (PC1, PC2 and PC3) accounted for 15.658%, 12.304% and 9.781% of the variance, respectively. The variable contributing the highest loading to PC1 was V21, while V16 exhibited a relatively high loading on PC2, and V19 showed the maximum loading value for PC3, with a cumulative contribution rate of 37.743%. These three principal components could well reflect the morphological differences among the four groups. A scatter plot was generated based on the scores of the first, second and third principal components (Figure 5).
DISCRIMINANT ANALYSIS BASED ON OTOLITH MORPHOLOGICAL PARAMETERS OF THE FOUR FISH GROUPS
After performing homogeneity of variance and normality tests on the 34 standardized otolith Fourier coefficients, 17 eligible coefficients (V2,V4,V5,V6,V8, V9, V10, V12, V14, V16, V17, V23, V24, V28, V29, V30, V32) remained after screening and were subjected to stepwise discriminant analysis (SDA) for the four fish groups. During the variable selection process, Wilks’ λ test indicated that as core variables were sequentially incorporated, the Wilks’ λ value decreased from 0.660 to 0.108(Table 5). Model tests at all steps were highly significant (P < 0.001), indicating that the included variables effectively improved intergroup discrimination. Finally, 9 parameters, namely V4(X1), V5(X2), V6(X3), V12(X4), V14(X5), V16(X6), V17(X7), V23(X8) and V28(X9), were selected to establish the discriminant functions. Discriminant functions (Yi) were established based on these 9 selected Fourier harmonics. The corresponding harmonic values from each otolith sample were substituted into the four discriminant functions, and each sample was assigned to the group corresponding to the function with the highest Y value. The results are presented in Table 6. The discriminant accuracy of C. maculata was the highest among the four groups at 90.0%, followed by C. argus at 83.7%, C. argus♀ × C. maculata♂ at 77.1%, and C. maculata♀ × C. argus♂ at 75.0%, with an overall discriminant accuracy of 81.4%. The cross-validated discriminant results showed that the discriminant accuracies of the four groups in descending order were C. maculata (88.0%), C. argus (81.6%), C. maculata♀ × C. argus♂ (75.0%) and C. argus♀ × C. maculata♂ (72.9%), with an overall discriminant accuracy of 79.4%.
DISCRIMINANT ANALYSIS BASED ON BODY AND OTOLITH PARAMETERS
SDA was used to screen 17 otolith Fourier analysis parameters and 24 fish truss morphometric measurements. Based on the discriminant analysis results, 4 parameters (V5, V9, V10 and V23) were selected from otolith data, and 12 parameters (1-2,2-3,3-4, 4-5, 5-6, 8-9, 10-11, 1-11, 2-11, 2-10, 4-8 and 4-7) were selected from truss data. A total of 16 parameters were used to establish the discriminant functions. The discriminant results showed that the discriminant accuracies of the four groups in descending order were C. argus (100%), C. maculata (100%), C. argus♀ × C. maculata♂ (95.8%) and C. maculata♀ × C. argus♂ (92.3%), with an overall discriminant accuracy of 97.0%. The cross-validated discriminant results showed that the discriminant accuracies of the four groups in descending order were C. argus (100.0%), C. maculata (95.9%), C. argus♀ × C. maculata♂ (89.6%), and C. maculata♀ × C. argus♂ (86.5%), with an overall discriminant accuracy of 92.9% (Table 7). The combined discriminant accuracy was higher than that of the traditional morphometric method, truss morphometric method and otolith Fourier analysis method alone.
DISCUSSION
ANALYSIS OF BODY MORPHOLOGICAL DIFFERENCES AMONG C. ARGUS, C. MACULATA, AND THEIR HYBRIDS
Principal component analysis (PCA) transforms multiple proportional morphological traits into several uncorrelated principal components, ranked by their contributions. The higher the contribution rate of a principal component, the stronger its ability to explain the variation in the original data21. The PCA results of this study showed that four principal components were extracted from 24 truss network measurement traits, with a cumulative contribution rate of 68.127%. Among them, the traits with high loading values on the first principal component mainly reflected the differences in the head, tail, and trunk of the fish. In the longitudinal dimension, the average values of head and trunk traits were the largest in C. maculata, the smallest in C. argus, and intermediate in the hybrids. For tail traits, the average value was the largest in C. maculata♀ × C. argus♂ and the smallest in C. argus. In the transverse dimension, the head length was the longest in C. argus♀ × C. maculata♂, while the trunk length was the longest in C. argus. In summary, C. argus in this study had an elongated trunk and the smallest head, with an overall streamlined contour that reduces water resistance and improves swimming efficiency 22. C. maculata had a more robust head and trunk with a stocky body shape, which may confer stronger ambush ability and instantaneous burst power, making it suitable for predation in still or complex habitats. C. maculata♀ × C. argus♂ exhibited more developed tail traits, showing obvious heterosis, suggesting its stronger swimming propulsion ability. C. argus♀ × C. maculata♂ had a relatively longer head, which may be more advantageous in predation and environmental perception, and these morphological differences may be related to feeding habits23. Previous studies have shown that morphological differences between wild and cultured populations of different fish species are mostly concentrated in the head, tail, and trunk. For example, in a study on natural and cultured populations of Oplegnathus fasciatus24, differences were mainly found in the head, trunk and pelvic fin. In a study on cultured and wild populations of Culter mongolicus in the Poyang Lake basin25, differences were mainly observed in body depth and head. In contrast, the streamlined body shape of C. argus and the robust body shape of C. maculata in this study represent different adaptive strategies under natural selection. The two hybrid snakeheads showed obvious complementary differences in two functional traits: the tail was more developed in C. maculata♀ × C. argus♂, while the head was longer in C. argus♀ × C. maculata♂, indicating that hybrid offspring may inherit the advantages of both parents in different functional traits. At present, morphological studies on Channa species in China are still relatively limited. Liu et al.14 systematically analyzed the morphological differences between C. maculata (♀), C. argus (♂), and their hybrid using traditional and truss network measurement methods. The results showed that the first principal component explained 47.23% of the morphological variation, and that traits with high loadings were concentrated in the head and trunk. In comparison, this study included the reciprocal hybrid C. argus♀ × C. maculata♂ and integrated otolith analysis, revealing that tail traits are the key to distinguishing the two hybrids and filling a gap in previous studies that examined only one hybrid.
The traditional morphometric method achieved only 66.7% identification accuracy for C. argus, while discrimination accuracy decreased sharply to 35.4% for C. argus♀ × C. maculata♂, with most misclassified individuals assigned to C. maculata♀ × C. argus♂. This result is similar to the discriminant analysis results of Que et al.26 on the Poyang Lake strain, Huangsha strain of Pelodiscus sinensis and their hybrid offspring. The discrimination rates were higher for the genetically pure populations (73.3% for Poyang Lake strain and 76.7% for Huangsha strain), but lower for the hybrid population (66.7%), which was speculated to be related to the genetic background of different populations. In this study, the phenotype of purebred C. argus was stable, while hybrids often exhibited traits intermediate between or biased towards one of the parents due to genetic recombination and phenotypic chimerism27, making it difficult for traditional measurements to capture their subtle differences28. The truss network measurement method established discriminant functions using truss traits covering the head, trunk and tail. The discriminant results showed that the correct discrimination rates for all four fish groups exceeded 85.0%, with an overall correct discrimination rate of 91.6%, markedly better than the 43.9% observed with the traditional measurement method. Specifically, the discrimination accuracy increased to 95.8% for C. maculata♀ × C. argus♂ and 88.5% for C. argus♀ × C. maculata♂. Compared with the traditional measurement method, the truss network measurement method can effectively utilize biological information by selecting representative coordinate points, and the geometric traits formed by cross-connecting these points can more comprehensively reflect fish morphological characteristics 29. Further analysis found that the discrimination accuracy could reach 100.0% when combining meristic traits with truss traits5, indicating that the comprehensive application of multiple measurement methods can complement the deficiencies of traditional and geometric information and markedly improve the reliability of hybrid identification.
OTOLITH MORPHOLOGICAL DIFFERENCES AMONG C. ARGUS, C. MACULATA, AND THEIR HYBRIDS
The two-dimensional contour morphology of sagittal otoliths exhibits significant interspecific variation among fishes, and this characteristic has become one of the most important criteria for species identification. According to Ye5, fish otolith morphologies can be broadly classified into rhombic, ovate, elliptical, and irregular shapes. The sagittal otoliths of C. argus, C. maculata and their reciprocal hybrids were characterized by smooth peripheral contours, a generally elliptical shape with continuous curved margins, and underdeveloped rostrum and antirostrum. This elliptical otolith morphology was similar to that of Hemiculter tchangi (Cypriniformes)30, but differed significantly from those of other perciform species, including the rectangular otoliths of Champsocephalus gunnari31, the shield-shaped otoliths of Larimichthys crocea32, and the tile-shaped otoliths of Scomber japonicus and Scomber australasicus33. These results indicate that otolith morphology has taxonomic value at the order and genus levels and suggest that it tends to be conservative among closely related species, making them difficult to distinguish by direct visual inspection. Further principal component analysis (PCA) of Fourier coefficients in this study revealed that the otolith morphologies of the two hybrid snakeheads were either intermediate between those of the two parental species or showed greater phenotypic resemblance to one parent, suggesting that genetic background may contribute to otolith morphological variation. The discriminant analysis results showed that the overall correct discrimination rate for the four fish groups based on Fourier analysis of otolith morphology was 81.4%, which was comparable to that obtained using the truss network measurement method for fish body morphology in this study. This demonstrates that otolith morphology also has high discrimination power for these four fish groups.
Compared with existing studies, Song et al.34 reported that the discrimination accuracy of Fourier analysis (80.0%) was higher than that of traditional morphometric methods (70.8%) in their study of Larimichthys polyactis from Liaodong Bay, Jiaozhou Bay and the Yangtze Estuary, indicating that Fourier analysis has advantages in distinguishing different geographic populations. Zhang et al.35 conducted Fourier analysis on the otoliths of three Sebastes species from Jiaozhou Bay, Qingdao, and the results showed that this method achieved a 100% correct discrimination rate. Compared with traditional morphometric methods, Fourier analysis can more accurately extract otolith contour features and discriminate among morphological differences, making it an effective tool for identifying closely related species. The discrimination accuracy of this study (81.4%) was lower than that of Zhang et al. but similar to that of the Larimichthys polyactis34 study. This discrepancy may be attributed to the two hybrid snakeheads in this study being artificially produced, whose otolith morphologies are intermediate between the parents and highly similar, thereby increasing the difficulty of discrimination. In contrast, the Sebastes species studied were natural populations with greater interspecific morphological differences. Secondly, the Larimichthys polyactis study focused on different geographic populations of the same species, where otolith morphological differences are usually influenced by a combination of environmental, genetic and dietary factors36–38, whereas the differences in this study originated from genetic background variations. Furthermore, this study found that the otolith morphology of hybrid snakeheads showed greater phenotypic resemblance to the paternal group, which is consistent with the results of Liu et al.14, who reported that the measurable traits of hybrid snakeheads (C. maculata♀ × C. argus♂) exhibited paternal inheritance biased towards C. argus. Most existing studies have focused on otolith morphological differences among geographic populations 39, while studies on the genetic patterns of otolith morphology in hybrid offspring are relatively scarce. This observed phenotypic pattern suggests a potential association with paternal genetic background. Notably, because specimens were sourced from two separate research institutes with independent rearing units, we cannot fully rule out potential confounding effects of subtle environmental differences among groups on the observed morphological patterns. Maternal effects, inter-individual developmental variation and sampling bias could all contribute to the observed phenotypic bias. While alternative explanations such as maternal effects, inter-individual developmental variation, and sampling bias cannot be entirely ruled out, the consistent paternal bias across all groups provides preliminary evidence for a genetic basis. Whether this pattern is driven by direct paternal genetic regulation remains a research hypothesis that warrants further verification. This finding provides clues for future studies on the genetic regulation of otolith morphology in hybrid fish. In addition, some studies have suggested that differences in fish otolith morphology may be similar to the adaptive body shape differences caused by swimming and foraging activities in flowing water environments40, meaning that otolith morphology is influenced by environmental factors such as water flow, water depth and feeding ecology. For example, Peng et al.41 found that the otoliths of Saurogobio dabryi from the upper reaches of the Jialing River were more elongated with more crests, while those from the middle and lower reaches were more rounded with fewer crests. They speculated that these morphological differences in otoliths resulted from active adaptation to environmental factors such as flow velocity. Bardarson et al.42 studied six commercially important fish species in the North Atlantic, namely Thunnus thynnus, Sarda sarda, Trachurus trachurus, Engraulis encrasicolus, Sardinops sagax and Cololabis saira. The results showed that the otolith aspect ratio of deep-sea populations was markedly higher than that of coastal populations. That is, fish otoliths in deep-sea waters with high flow velocities exhibited a streamlined shape, while those in coastal waters with low flow velocities tended to be rounded, further confirming the broad shaping effect of the water-flow environment on otolith morphology at the interspecific level.
The environmental shaping effect and genetic inheritance of otolith morphology are not mutually exclusive, but operate at different scales. In this study, C. argus, C. maculata and their hybrids mostly inhabit still or slow-flowing waters43,44, and their otoliths all showed an elliptical shape with smooth contours, making it difficult to distinguish them visually. This indicates that otolith morphology may converge under similar living environments. Taken together, there are still quantifiable subtle differences in otolith morphology among C. argus, C. maculata and their hybrid offspring. Fourier analysis can effectively identify them, but its effectiveness is lower than that in studies of natural species. This is mainly attributed to the phenotypic chimerism of hybrids and the consistency of their habitats.
SDA INTEGRATING BODY AND OTOLITH MORPHOLOGY
By combining truss network morphometrics and otolith Fourier analysis, this study conducted multi-dimensional discrimination of C. argus, C. maculata, and their reciprocal hybrids. The combined approach achieved an overall correct discrimination rate of 97.0%, markedly outperforming the traditional morphometric, truss network and otolith Fourier methods alone. The discrimination accuracy was 100% for C. argus, 100% for C. maculata, 95.8% for C. maculata♀ × C. argus♂ and 92.3% for C. argus♀ × C. maculata♂. This result is consistent with Xuan et al.45 on tilefishes, where combining otolith and body morphological parameters increased discrimination accuracy from 85.1% (otolith truss method) and 94.0% (body truss method) to 98%. Other researchers 46 applied wavelet transform and Fourier analysis to otoliths of seven Odontesthes species using the ShapeR package, finding that the combined method achieved 88.63% accuracy, markedly higher than the 71.83% for wavelet transform alone and the 78.81% for Fourier analysis alone. This demonstrates the effectiveness of combining multiple analytical methods for distinguishing morphologically similar species. Therefore, future fish identification studies should adopt multiple complementary methods to improve accuracy and provide more reliable evidence for fish taxonomy.
Collectively, both truss network morphometrics and otolith Fourier analysis effectively discriminated the four fish groups with comparable accuracy. Combining body and otolith parameters markedly enhanced discrimination performance. The otolith morphology of hybrid snakeheads generally showed greater phenotypic resemblance to the paternal group, which, together with the consistent inter-group differences observed despite different sample sources, suggests a potential contribution of genetic background to otolith shape variation, alongside the well-documented broad environmental shaping effects.
CONCLUSIONS
These results demonstrate that truss network analysis of body morphology and Fourier analysis of otolith shape effectively discriminated among the four fish groups, with otolith morphology achieving classification accuracy comparable to that of the truss network method. Integrating body and otolith parameters substantially enhanced the accuracy of the discriminant analysis. Notably, the otolith morphology of hybrid snakeheads showed a phenotypic bias toward the paternal group. This pattern suggests a potential association with genetic background, but cannot be regarded as conclusive evidence of paternal genetic regulation. Further validation with controlled experiments is needed.
Acknowledgements
This research was supported by the National Freshwater Aquatic Germplasm Resource Center (FGRC18537)
CRediT Author Contribution
Writing – original draft: Lixia Qing (Lead). Methodology: Lixia Qing (Equal), Xian Li (Equal). Data curation: Lixia Qing (Equal), Xing Yan (Equal), Wen Dong (Equal), Li An (Equal), Xuri Cong (Equal). Resources: Xian Li (Lead). Funding acquisition: Xian Li (Lead). Conceptualization: Xian Li (Lead). Investigation: Xing Yan (Equal), Wen Dong (Equal), Li An (Equal), Xuri Cong (Equal). Validation: Li An (Lead).
Ethics Statement
Fish sampling in this study did not require institutional animal ethics approval according to local fisheries regulations. All sampling procedures were performed to minimize fish stress and pain, in accordance with the ARRIVE guidelines for animal experimentation.
Informed Consent
All authors and affiliated institutions have consented to the submission and publication of this manuscript.
Competing Interest
No competing interests were disclosed.
Data Availability Statement
The raw datasets generated and analyzed during the current study are available from the corresponding author on reasonable request.