
1. Introduction
Global aquaculture production has expanded markedly over the past two decades, playing an essential role in meeting the increasing demand for animal protein and ensuring food security.1 Among economically important species, Xenocypris davidi is a cultured freshwater fish in China.2 The peak harvesting and transport season for this species occurs in autumn and winter, when pond water temperatures are at their lowest. Because low water temperature substantially suppresses branchial ventilation, metabolic clearance, and membrane partitioning kinetics in cyprinid fishes,3,4 anesthetic induction and recovery timelines at such temperatures are expected to be prolonged relative to warmer-water conditions; the present study therefore employed a single, operationally relevant test temperature (10.0 ± 0.3 °C; Section 2.1). Routine husbandry practices—including grading, tagging, artificial breeding, health monitoring, and live transport—inevitably involve repeated handling, which induces acute physiological stress responses. These responses activate the hypothalamic-pituitary-interrenal (HPI) axis, resulting in elevated plasma cortisol, hyperglycemia, and osmoregulatory disturbances, ultimately impairing immune function, growth performance, and post-handling survival.5 Therefore, the development of safe, effective, and practically applicable anesthetic strategies remains a priority in sustainable aquaculture.
Eugenol (4-allyl-2-methoxyphenol), the principal active component of clove oil, has been widely adopted as an immersion anesthetic due to its natural origin, low residue, cost-effectiveness, and regulatory acceptance.6 Its anesthetic effect arises from multi-target central nervous system (CNS) depression, involving modulation of membrane receptors, inhibition of voltage-gated sodium channels, and regulation of GABAergic neurotransmission.7 Following immersion, eugenol is absorbed across the gill epithelium via passive diffusion and distributed to neural tissues, producing dose-dependent CNS suppression; recovery occurs through passive elimination upon transfer to clean water.8 However, the practical application of unformulated eugenol is constrained by its physicochemical limitations. Its low aqueous solubility and hydrophobicity result in heterogeneous surface film formation rather than uniform dispersion in water,6 reducing effective bioavailability at the gill interface and delaying anesthetic onset. In addition, eugenol is prone to volatilization and oxidative degradation in open aqueous systems, leading to time-dependent and unpredictable declines in efficacy.9 Although ethanol is commonly used as a co-solvent to improve solubility, it may introduce pharmacokinetic variability due to its own anesthetic effects, differential volatilization, and influence on membrane partitioning.10,11 These limitations highlight the need for formulation strategies that simultaneously enhance solubility, bioavailability, and stability.
β-Cyclodextrin (β-CD), a cyclic oligosaccharide composed of seven α-1,4-linked glucopyranose units, possesses a hydrophilic exterior and a hydrophobic internal cavity enabling effective encapsulation of hydrophobic molecules such as eugenol.12 Formation of eugenol/β-CD inclusion complexes significantly enhances aqueous solubility while protecting the encapsulated compound from volatilization and degradation.13,14 The dynamic equilibrium between bound and free eugenol generates a “depot effect,” allowing sustained release as free molecules are depleted.14,15 Notably, β-CD nanoencapsulation has been shown to reduce induction time, attenuate stress responses, and extend post-harvest shelf life in several commercially important fish species.16 Molecular-level studies further confirm the structural stability of the inclusion complex under physiologically relevant conditions.13 Collectively, these findings support β-CD encapsulation as a promising delivery strategy for improving eugenol-based anesthesia in aquaculture.
Despite these advances, the novelty of the present work lies in the behavioral and operational comparison rather than in the inclusion chemistry itself: the formation and structural characterization of eugenol/β-cyclodextrin inclusion complexes are already well documented.13,14,17–19 What has not previously been established is how such preparations perform in live fish relative to the conventional formulation alternatives. First, the comparative pharmacodynamic characteristics of a β-CD/eugenol co-ground preparation, ethanol-solubilized eugenol, and raw eugenol have not been evaluated within a unified operational framework. Second, the temporal stability of anesthetic efficacy, especially over practical operational timeframes (e.g., 24 h post-preparation), remains poorly characterized across different formulations. Therefore, this study used juvenile X. davidi as a model to (1) characterize the concentration-response profile of the β-CD/eugenol co-ground preparation, (2) compare induction and recovery times among the β-CD co-ground preparation, ethanol solution, and raw dispersion at 20 mg L-1, and (3) evaluate temporal stability at 3 h, 12 h, and 24 h post-preparation. These findings provide practical guidance for optimizing eugenol-based anesthetic formulations.
2. Materials and Methods
2.1. Experimental Animals
Juveniles of Xenocypris davidi were obtained from a certified commercial aquaculture farm in Liuyang, Hunan Province, China. Only individuals that were visually free of external injuries, exhibited uniform body size, and showed active feeding behavior were selected for experiments. Fish were transported to the aquaculture greenhouse facility at the Fisheries College, Xinyang Agriculture and Forestry University, and transferred into aerated 200-L polyethylene holding tanks. Prior to experiments, fish were acclimated for 14 days under the following conditions: water temperature 10.0 ± 0.3 °C, dissolved oxygen ≥ 7.5 mg L-1, pH 7.2 ± 0.2, total ammonia nitrogen < 0.1 mg L-1, and a 12 h light:12 h dark photoperiod. A water temperature of 10.0 ± 0.3 °C was selected to reflect the typical autumn/winter conditions in central China (Xinyang region, Henan Province), which coincides with the peak commercial harvesting and transport season for X. davidi, when anesthesia is most commonly employed. Fish were fed a commercial pelleted diet twice daily (09:00 and 16:00) at 2% body weight per day. Water was renewed at a rate of approximately 50% weekly. Body length were measured before the experiment. Fish used in anesthesia trials had a mean body length of 9.32 ± 0.18 cm (mean ± SD, n = 30). All fish were fasted for 7 days prior to the start of experiments, as the metabolic rate is substantially reduced at this temperature. At 10.0 ± 0.3 °C, complete gut clearance in cyprinid fishes has been reported to require up to 5–7 days,20,21 and preliminary observations confirmed that X. davidi juveniles held at 10.0 ± 0.3 °C retained visible gut contents at 48–72 h post-feeding, supporting the need for this extended fasting period to ensure complete gut clearance before anesthesia trials. Fish were not fed during experimental procedures to prevent regurgitation and reduce accumulation of nitrogenous waste in the anesthetic solution.
2.2. Complex Preparation
Eugenol (4-allyl-2-methoxyphenol; CAS no. 97-53-0; purity ≥ 99%) and β-cyclodextrin (β-CD; CAS no. 7585-39-9; purity ≥ 97%) were both purchased from Aladdin Biochemical Technology Co., Ltd. (Shanghai, China). Absolute ethanol (analytical grade, purity ≥ 99.7%) was obtained from Sinopharm Chemical Reagent Co., Ltd. (Shanghai, China). All aqueous solutions were prepared with ultrapure water produced by a Milli-Q system (Merck, Germany).
2.3. Preparation of Anesthetic Formulations
2.3.1. β-Cyclodextrin/Eugenol Co-Ground Preparation (β-CD Group)
The β-CD/eugenol co-ground preparation was prepared by the co-grinding (solid-state mechanochemical) method.16 Briefly, eugenol and β-CD were weighed at a mass ratio of 1:6.9 (eugenol:β-CD, w/w), corresponding to approximately 1:1 molar ratio (molecular weight of eugenol: 164.20 g mol-1; β-CD: 1134.98 g mol-1). The two components were combined in a porcelain mortar and ground manually with a pestle for 40 min at ambient temperature, yielding a homogeneous, slightly oily paste. The paste was transferred into a sealed low-density polyethylene bag and stored at 4 °C in the dark until use. The resulting material is hereafter referred to as the β-CD/eugenol co-ground preparation (β-CD-CP). For preparation of working anesthetic solutions, an appropriate mass of β-CD-CP was weighed and dispersed in 100 mL of pre-warmed ultrapure water in a 250 mL beaker with continuous magnetic stirring (300 rpm) for 3 min, then diluted with experimental water (10.0 ± 0.3 °C) to achieve the desired nominal eugenol concentration in a final volume of 2 L. Solutions were prepared fresh within 30 min before each experimental session.
2.3.2. Ethanol-Solubilized Eugenol (Ethanol Group)
A eugenol stock solution was prepared by dissolving pure eugenol in absolute ethanol at a volume ratio of 1:9 (eugenol:ethanol, v/v) to yield a 100 mg mL-1 stock. The stock solution was vortex-mixed for 30 s and immediately used to prepare working solutions by dilution in experimental water to the desired eugenol concentration, yielding a final volume of 2 L. The final ethanol concentration in the anesthetic bath did not exceed 0.09% (v/v) at the highest eugenol concentration tested. To ensure the validity of each trial, the working solution was prepared immediately before use (within 5 min). This formulation is hereafter referred to as the Ethanol group.8
2.3.3. Raw Eugenol Group
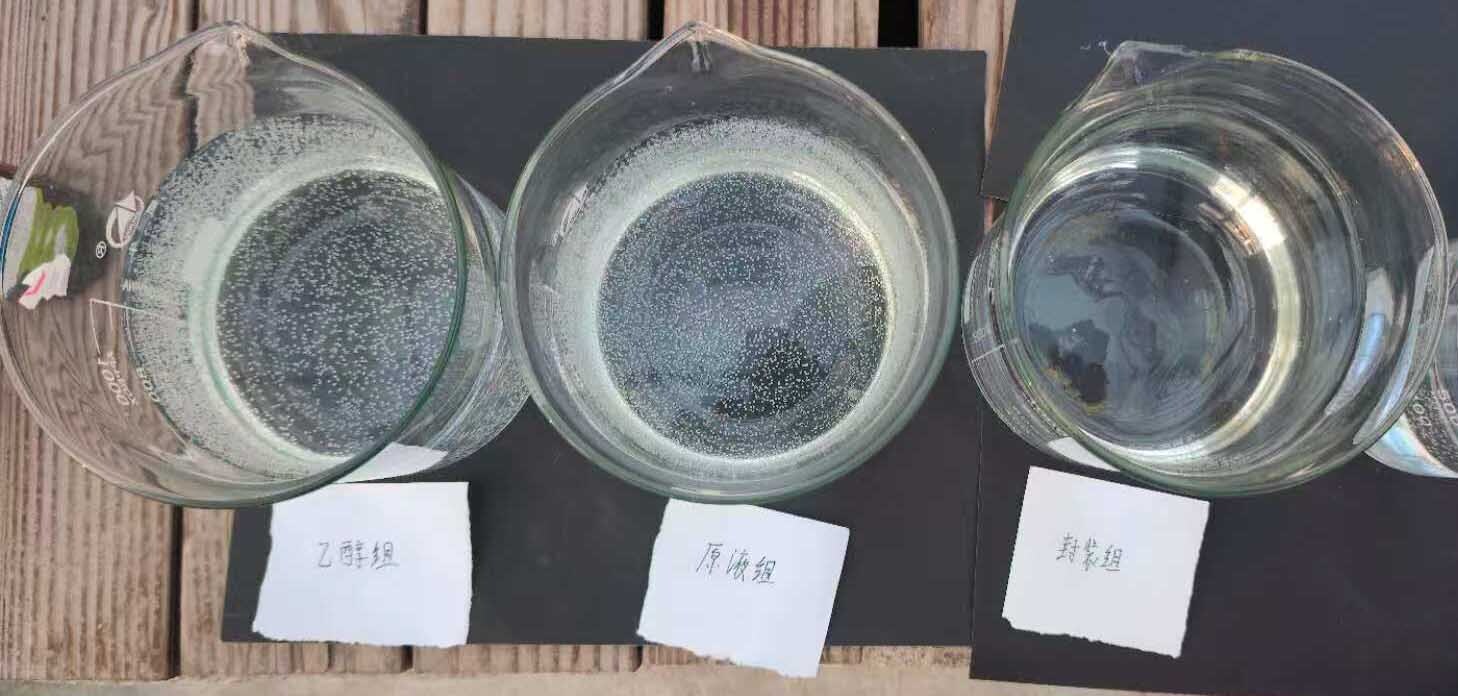
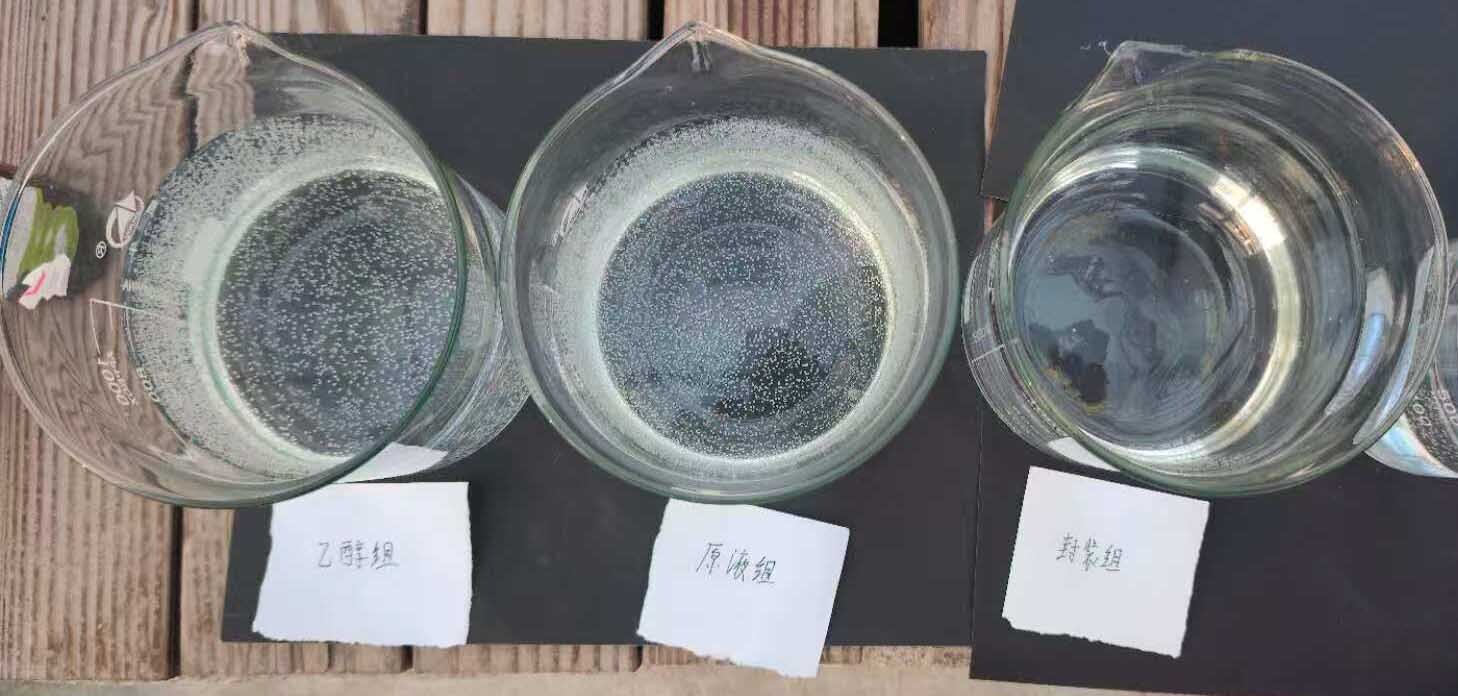
Working anesthetic solutions of unformulated eugenol were prepared by directly pipetting the appropriate volume of neat eugenol (≥99%) into 2 L of experimental water using a calibrated micropipette. The solution was briefly stirred with a glass rod for 10 s; no additional emulsifying agents or solvents were employed. This formulation is hereafter referred to as the Raw group. For the separate qualitative visual comparison shown in Figure 1, the three formulations were prepared at a nominal eugenol concentration of 20 mg L-1 in a glass greenhouse. The photographs were taken on a sunny summer day, when sunlight raised the temperature inside the greenhouse to 20 °C; this was an incidental condition, rather than a preset experimental temperature. The fish anesthesia and 24-h temporal-stability experiments were conducted at 10.0 ± 0.3 °C.
2.4. Fourier-Transform Infrared (FTIR) Characterization
FTIR spectra were acquired in attenuated total reflectance mode using an ATR-FTIR spectrometer (Nicolet Summit X, Thermo Scientific, Waltham, MA, USA) equipped with an Everest ATR accessory, a DTGS KBr detector, and a KBr beam splitter. Spectra were collected over 4000–400 cm-1 at a resolution of 4 cm-1 using 32 scans for both background and sample measurements.
Four samples were analyzed: neat β-cyclodextrin (β-CD; host reference), neat eugenol (guest reference), an unground physical mixture of eugenol and β-CD prepared at the same 1:6.9 mass ratio as the formulation (physical-mixing control), and the β-CD/eugenol product obtained after 40 min of co-grinding (target sample). The physical mixture provided the critical control to distinguish co-grinding-associated spectral changes from the simple superposition of the two component spectra.
Raw spectra were exported as percent transmittance and converted to absorbance according to A = −log10(T/100). For graphical full-spectrum comparison, spectra were normalized and vertically offset only to facilitate comparison of spectral profiles; absolute absorbance intensity was not interpreted as eugenol content because it may be affected by ATR contact and sample loading. The primary structural comparison focused on the fingerprint region. Relative intensities of eugenol marker bands were normalized to the β-CD skeletal band near 1020 cm-1 to correct global spectral-intensity scaling. This normalization was used only for within-spectrum comparison and was not used to calculate encapsulation efficiency.
2.5. Behavioral Assessment and Staging Criteria for Anesthesia and Recovery
Anesthesia depth and recovery were assessed by continuous direct observation of behavioral responses according to a staging system adapted from previously published criteria22,23 and defined as described below.
The following endpoints were recorded for each fish: (1) time to reach Stage A3 (loss of equilibrium; herein “induction time”), defined as the elapsed time (s) from fish introduction to the anesthetic bath until the fish was unable to maintain an upright posture and failed to respond to a gentle dorsal tactile stimulus; and (2) recovery time, defined as the elapsed time (s) from transfer to clean water until the fish had regained full equilibrium and exhibited normal, coordinated swimming behavior (Stage R4).
2.6. Preliminary Trial and Determination of Effective Anesthetic Concentration Range
To identify an appropriate concentration range for the main experiments, a series of preliminary dose-finding trials was first conducted using each of the three formulations. Eugenol concentrations of 20, 24, 30, 38, 48, and 60 mg L-1 were evaluated, with three fish per concentration group. Fish were individually transferred from the holding tank to a covered, aerated, transparent polypropylene chamber measuring 20 × 10 × 15 cm, containing 2 L of the test solution pre-equilibrated to the experimental temperature (10.0 ± 0.3 °C). Based on the preliminary results and endpoint observations, β-CD/eugenol co-ground preparation concentrations ranging from 8 to 100 mg L-1 were selected for the formal dose-response experiment. Five individual fish were tested at each concentration (n = 5 per concentration). The time to reach Stage A3 (induction time) and the recovery time were recorded for each individual.
2.7. Comparative Anesthetic Efficacy of Three Eugenol Formulations at 20 mg L-1
The effective anesthetic concentration of 20 mg L-1 eugenol (identified in the preliminary trial as within the effective range for X. davidi at 10.0 ± 0.3 °C) was used to compare the anesthetic performance of the three formulations. Three treatment groups were established: β-CD group (β-CD-CP dissolved in water), Ethanol group (ethanol-solubilized eugenol), and Raw group (neat eugenol directly added to water), all targeting a nominal eugenol concentration of 20 mg L-1.
Thirty individual fish were used per group (n = 30). Fish were individually introduced to the anesthetic bath. Induction time (time to A3) and recovery time (time to R4) were recorded by the same two observers for all trials to ensure consistency. Because the three formulations differed visibly in appearance in the exposure bath (Figure 1), the observers could not be masked to treatment allocation; all staging decisions were nevertheless made against the predefined criteria given in Table 1, and the same two observers scored all trials. A mobile-phone stopwatch accurate to 0.1 s was used. Any fish that did not reach Stage A3 within 10 min was removed from the anesthetic bath, recorded as “no effect”, and excluded from statistical analysis. Any fish that failed to reach Stage R4 within 15 min was considered to have an adverse outcome and was immediately transferred to an intensively aerated recovery tank under veterinary supervision.
2.8. Temporal Stability of Anesthetic Efficacy Over a 24-h Period
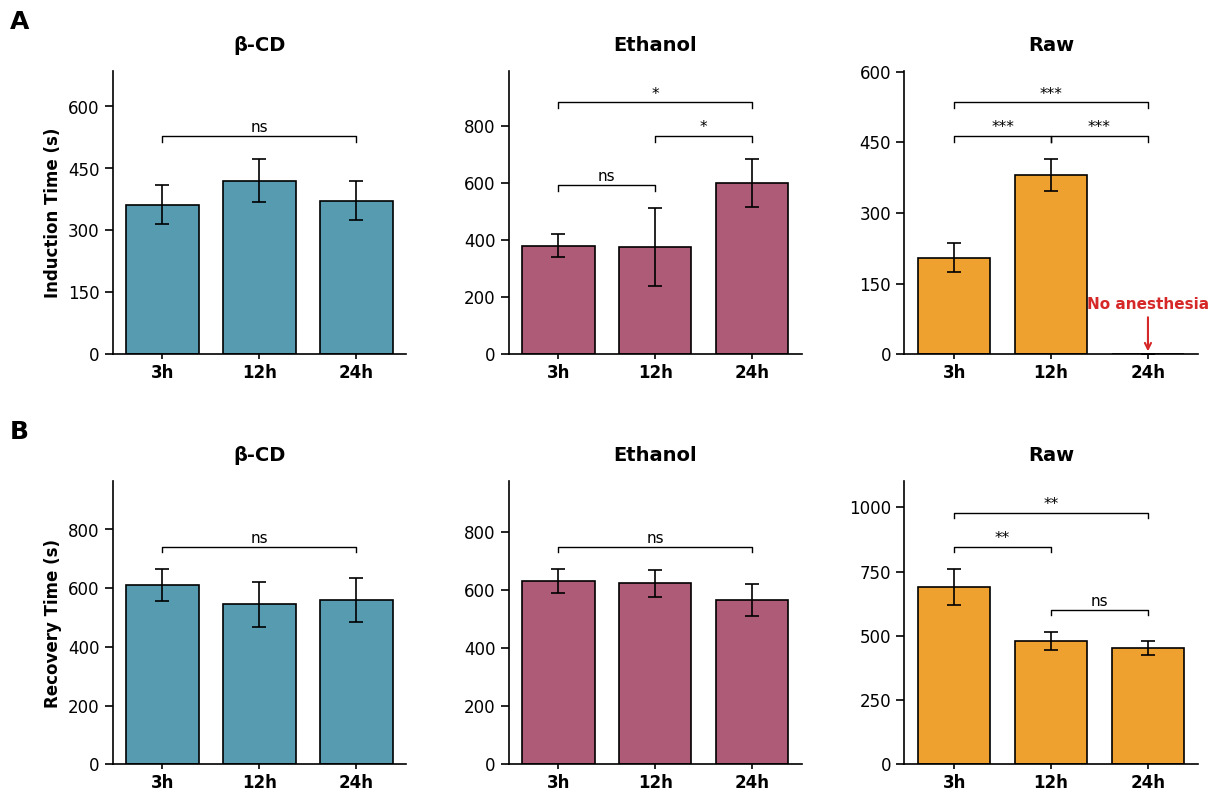
To evaluate the effect of storage time on the anesthetic efficacy of the three formulations, the temporal stability of each solution was assessed at three time points post-preparation: 3, 12, and 24 h. At each time point, a separate group of five fish (n = 5 per group per time point) was exposed to the corresponding solution (20 mg L-1 nominal eugenol), and induction time (to A3) and recovery time (to R4) were recorded as described above. Between time points, anesthetic solutions were maintained in sealed 2-L amber glass containers at the experimental temperature (10.0 ± 0.3 °C) in the dark, with gentle continuous aeration via an air stone to mimic practical aquaculture conditions.
2.9. Statistical Analysis
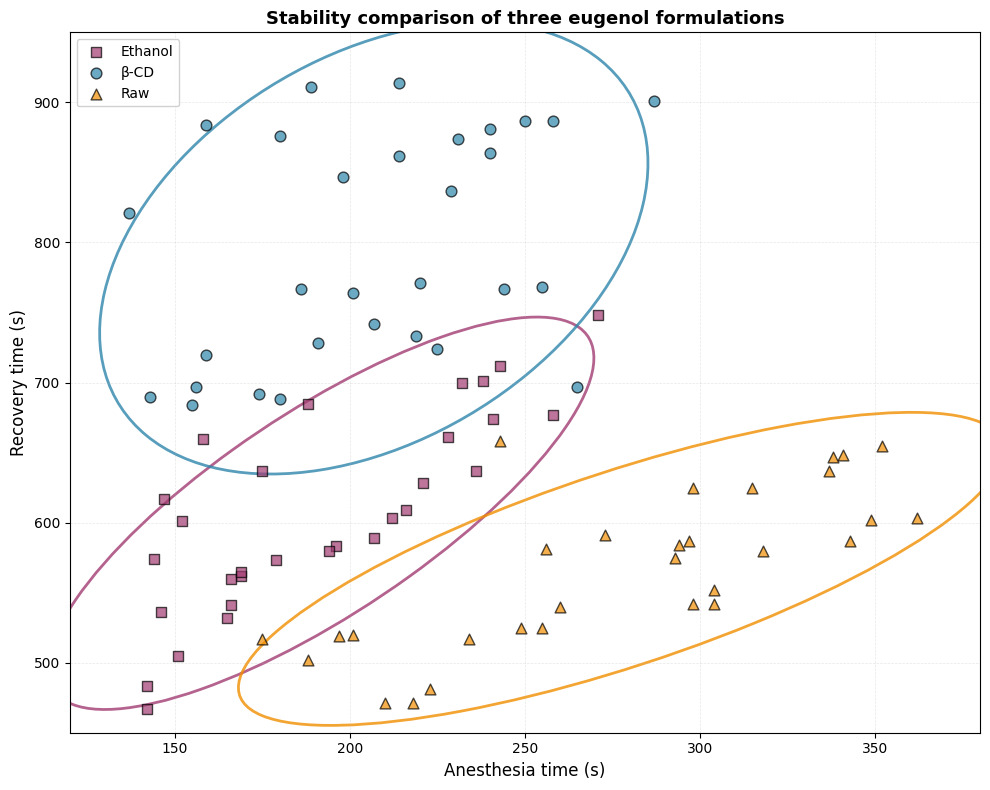
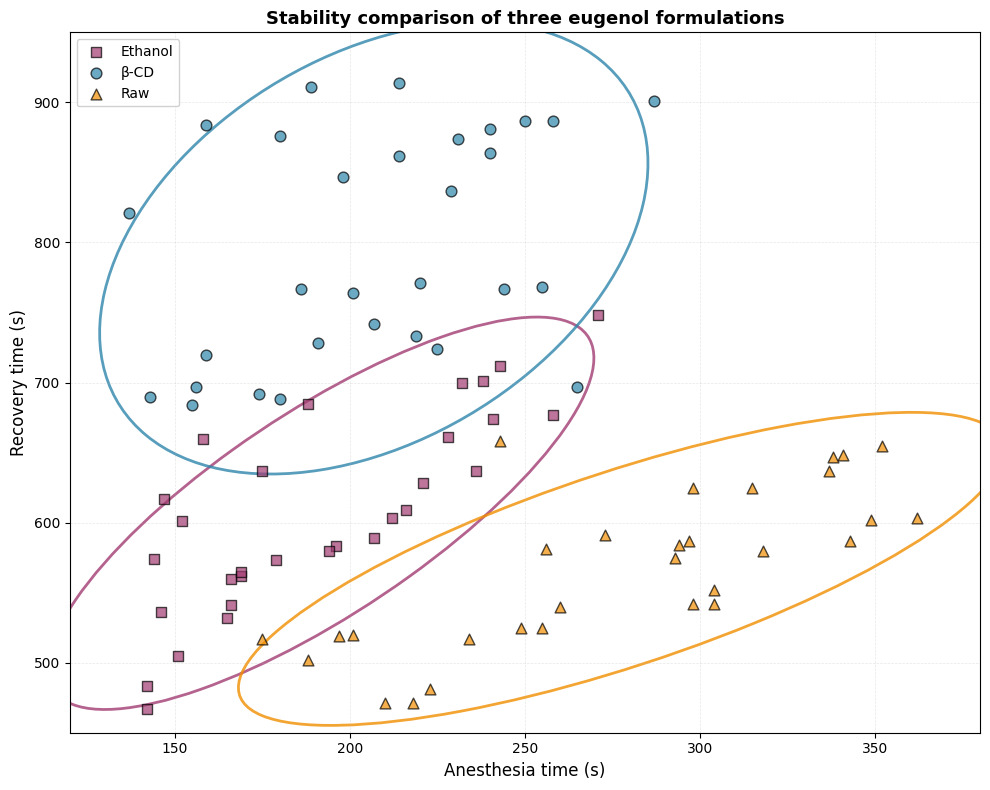
All data are expressed as mean ± standard deviation (SD). Data normality was assessed using the Shapiro–Wilk test and homogeneity of variance using Levene’s test (median-centered), applied separately to each endpoint before analysis. The decision rule applied was as follows: where both assumptions were met, one-way analysis of variance (ANOVA) followed by Tukey’s Honestly Significant Difference (HSD) post-hoc test was used; where either assumption was violated, the Kruskal–Wallis test followed by Dunn’s post-hoc test with Benjamini–Hochberg adjustment for multiple comparisons was used as the primary analysis, with the corresponding parametric result reported alongside for comparison. For the three-formulation comparison, induction time met the assumptions of normality and homogeneity of variance except in the Ethanol group (Shapiro–Wilk: Ethanol p = 0.040, β-CD p = 0.808, Raw p = 0.186; Levene p = 0.087), whereas recovery time violated normality in the β-CD group and homogeneity of variance overall (Shapiro–Wilk: β-CD p = 0.005, Ethanol p = 0.956, Raw p = 0.226; Levene p = 0.047). Recovery time was therefore analyzed by Kruskal–Wallis with Dunn’s post-hoc test, and both the parametric and the non-parametric outcomes are reported for induction time. Statistical significance was set at p < 0.05 throughout. All analyses were conducted in GraphPad Prism 9.5 (GraphPad Software, Boston, MA, USA) and R version 4.3.2. Bivariate ellipse plots (95% confidence ellipses) were constructed using the ggplot2 and ggforce packages in R to visualize the joint distribution of induction and recovery times across treatment groups.
3. Results
3.1. Dose-Response of β-CD Encapsulated Eugenol
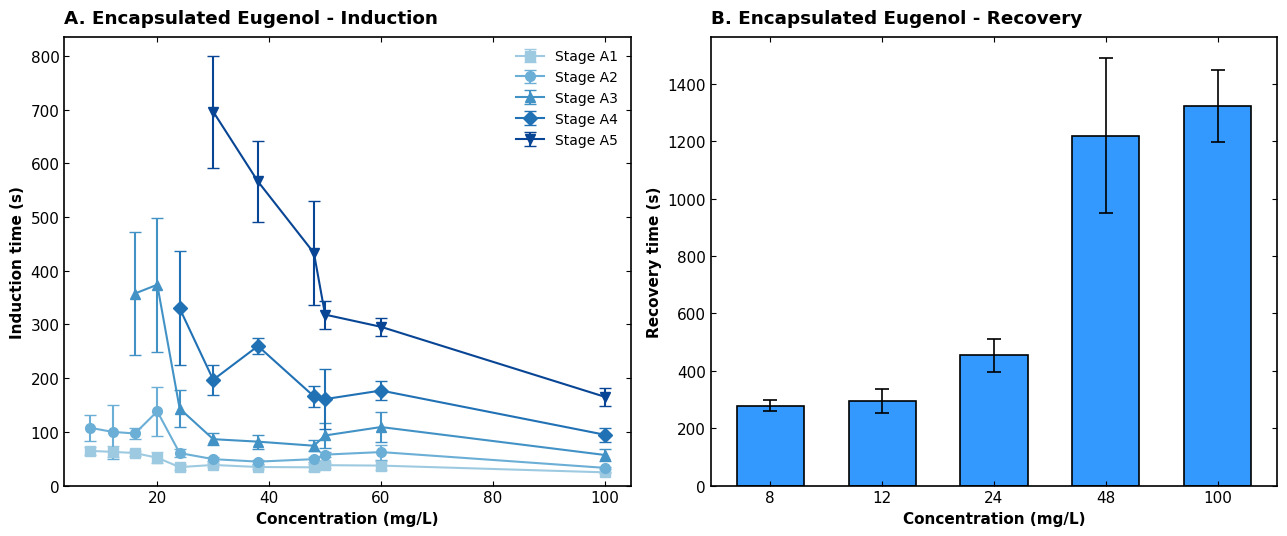
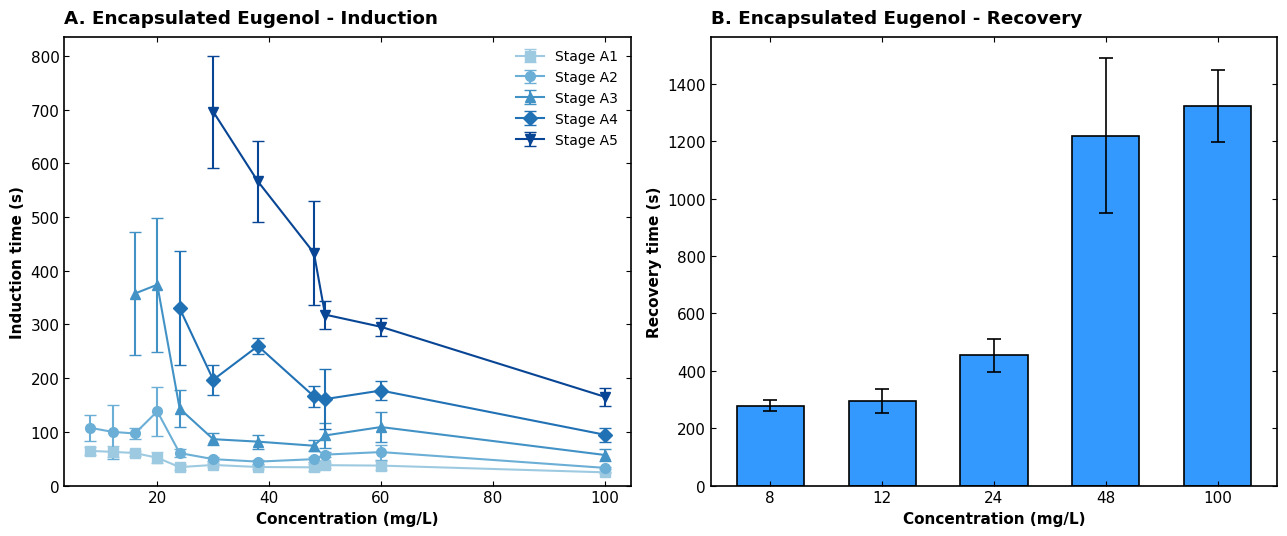
The dose-dependent efficacy of the β-CD/eugenol co-ground preparation (8–100 mg L-1) revealed an inverse relationship between concentration and induction time, alongside a proportional increase in recovery duration (Figure 2). Concentrations ≤16 mg L-1 were suboptimal, characterized by either failure to induce Stage A3 or by highly variable, prolonged induction (>350 s). Optimal anesthesia was achieved within a 20–30 mg L-1 window, balancing rapid induction (e.g., 143.4 ± 34.1 s at 24 mg L-1) with operationally acceptable recovery (453.8 ± 56.8 s). Concentrations ≥38 mg L-1 forced rapid progression to deep anesthesia (Stage A5) with unacceptably prolonged recovery (>1200 s at ≥48 mg L-1).
3.2. Comparison of Anesthesia Induction and Recovery Time
To visualize the overall temporal dynamics of the three eugenol formulations, a bivariate analysis of anesthesia induction versus recovery time was conducted (Figure 3). The scatter plot, accompanied by 95% confidence ellipses, reveals distinct clustering patterns for each treatment. The clear spatial separation among the groups—particularly the unique isolation of the β-CD group—indicates that the β-CD co-ground preparation altered the balance between induction and recovery kinetics.
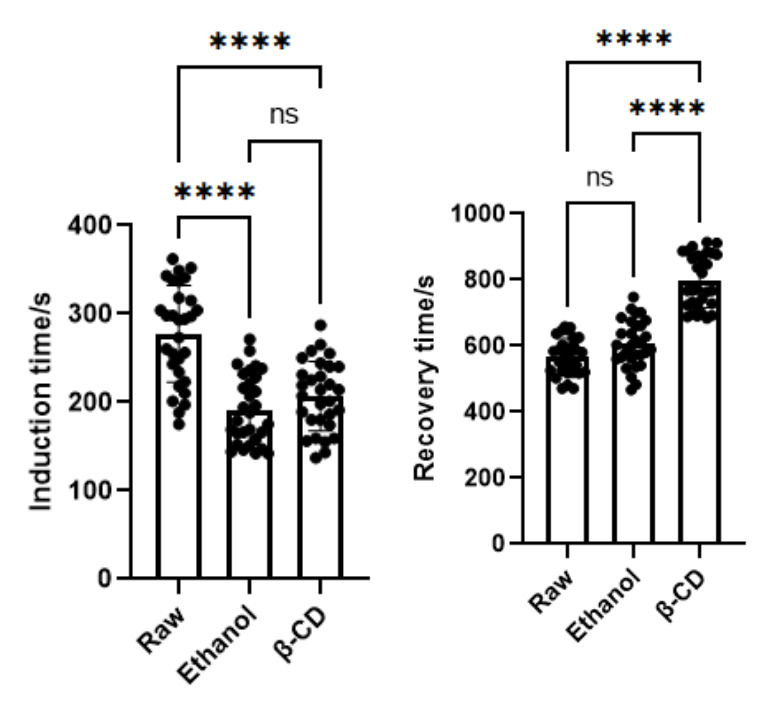
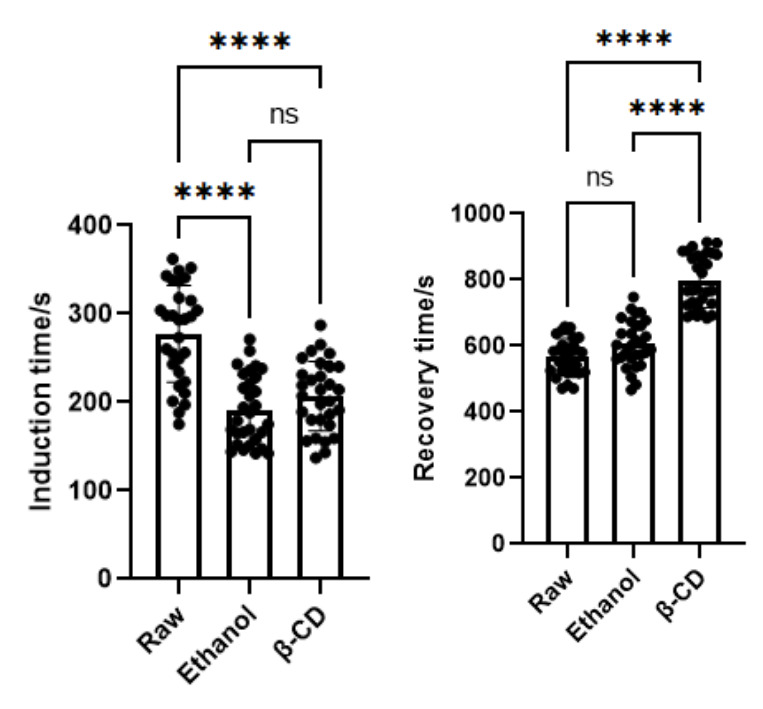
The efficiency of anesthesia induction was quantitatively compared across the three groups (n = 30 per group). The Raw group exhibited the longest induction time (277.5 ± 54.7 s; p < 0.0001, Figure 4 left). Both the Ethanol and β-CD formulations significantly accelerated induction compared with the Raw group (Ethanol: 191.7 ± 39.0 s; β-CD: 206.9 ± 39.2 s; both p < 0.0001). There was no statistically significant difference in induction time between the Ethanol group and the β-CD group (Tukey HSD p = 0.396; Dunn–Benjamini–Hochberg p = 0.223). Conversely, the analysis of recovery time revealed a different trend among treatments (Figure 4 right). The β-CD co-ground group showed significantly prolonged recovery (795.9 ± 80.6 s) compared with both the Ethanol (606.7 ± 70.0 s) and Raw (567.0 ± 55.9 s) groups (p < 0.0001 for both comparisons), whereas the Ethanol and Raw groups did not differ significantly from each other (p > 0.05).
3.3. Temporal Stability of Anesthetic Efficacy Over 24 h
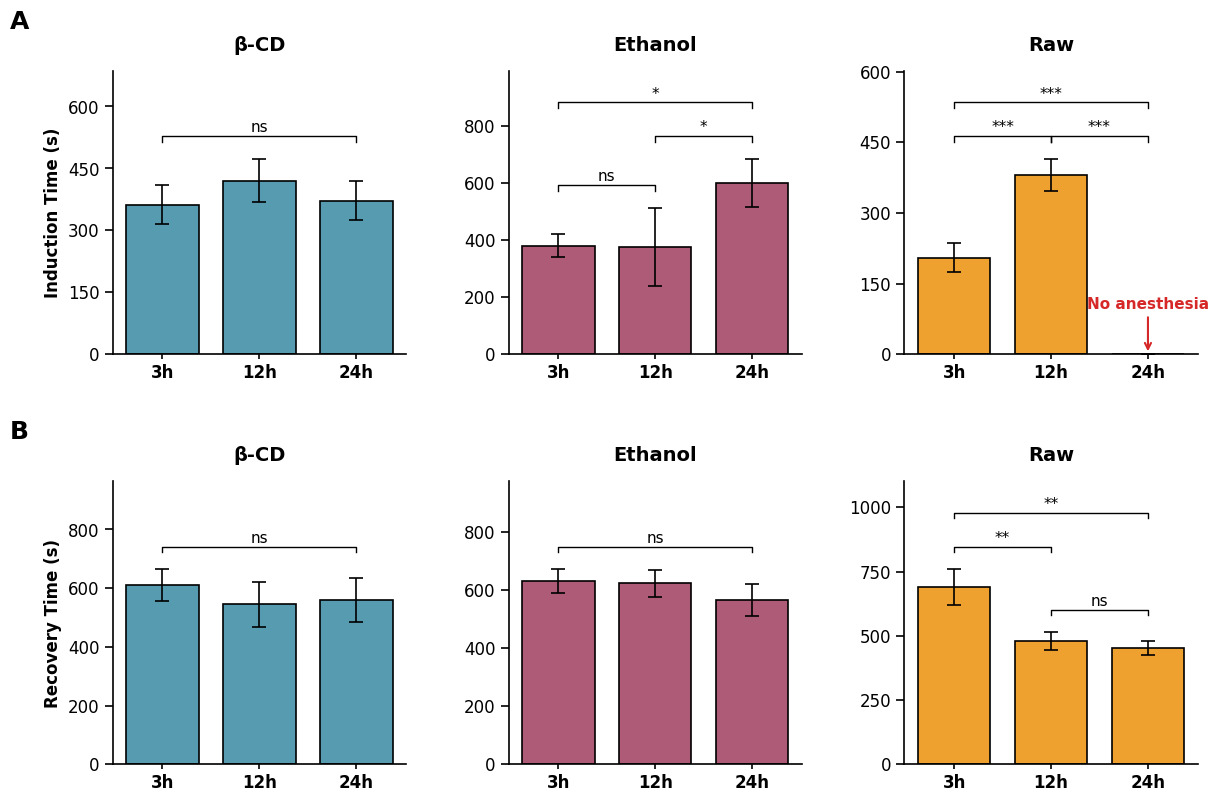
To assess the temporal stability of the formulations, anesthesia and recovery times were evaluated at 3 h, 12 h, and 24 h post-preparation (Figure 5). The β-CD group demonstrated remarkable stability throughout the 24 h observation period. Both induction time and recovery time remained highly consistent across all time points (induction time: 362 ± 47 s at 3 h, 420 ± 52 s at 12 h, and 372 ± 48 s at 24 h; recovery time: 611 ± 54 s at 3 h, 545 ± 77 s at 12 h, and 559 ± 74 s at 24 h), showing no statistically significant differences (all p > 0.05). In contrast, the Raw group exhibited a marked time-dependent decline in induction efficacy. While effective at 3 h and 12 h (anesthesia: 205 ± 31 s at 3 h and 380 ± 34 s at 12 h), its recovery time decreased significantly after the initial 3 h (recovery: 690 ± 69 s at 3 h vs. 479 ± 34 s at 12 h; p < 0.01), and the formulation produced no induction by 24 h (no fish reached Stage A3 within 10 min). The Ethanol group maintained stable recovery times (630 ± 42 s at 3 h, 623 ± 47 s at 12 h, and 566 ± 54 s at 24 h; all p > 0.05) but showed noticeable fluctuations in anesthetic induction, with a significant prolongation in induction time at 24 h (601 ± 84 s) compared to earlier intervals (380 ± 41 s at 3 h and 376 ± 137 s at 12 h; p < 0.05).
Under the 20 °C conditions used for the qualitative visual comparison, the β-CD group appeared clear and homogeneous, with few visible bubbles (Figure 1, right). The Ethanol and Raw groups showed visible bubbles and surface aggregates (Figure 1, left and middle). These observations describe appearance at the time of imaging and do not establish the same dispersion at 10.0 ± 0.3 °C or long-term physical stability.
3.4. FTIR Characterization of the β-CD/Eugenol Co-Ground Preparation
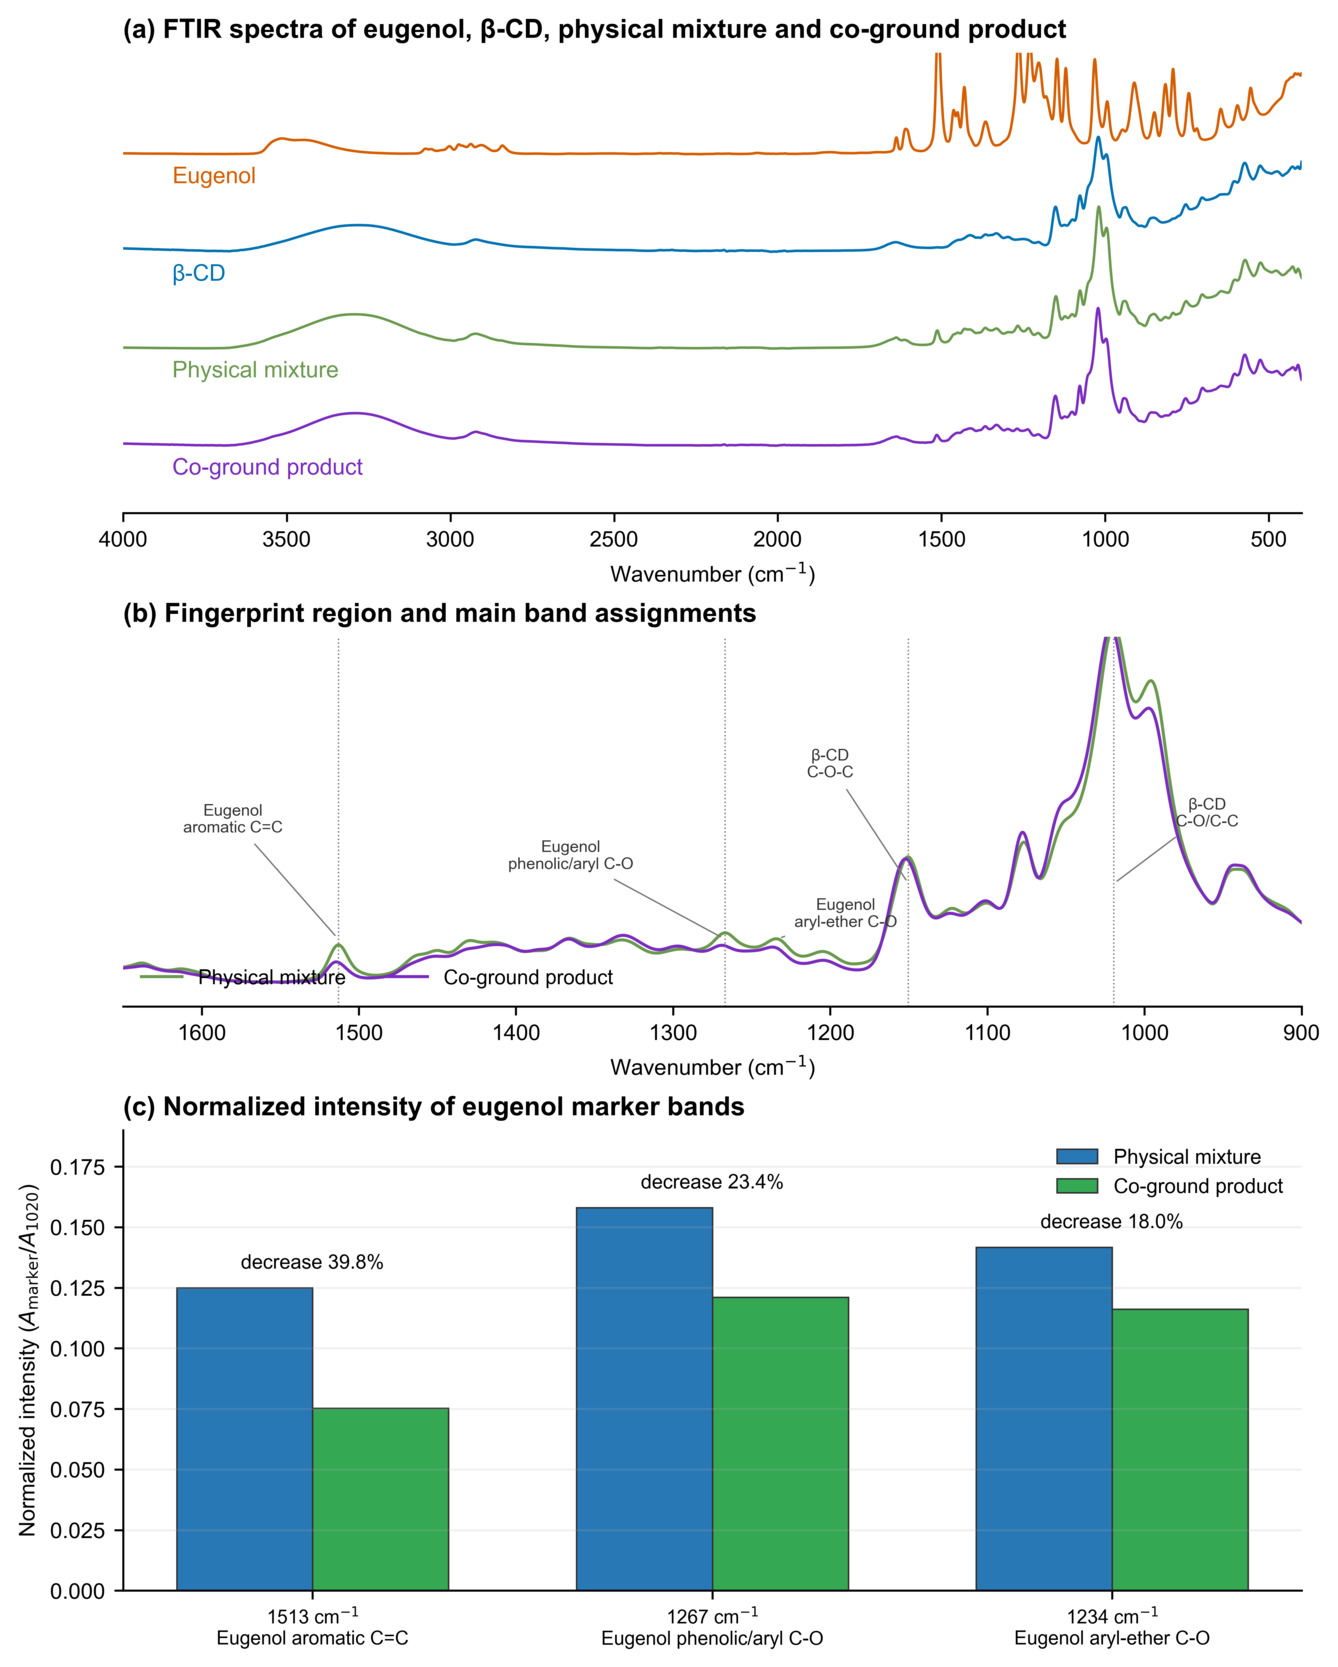
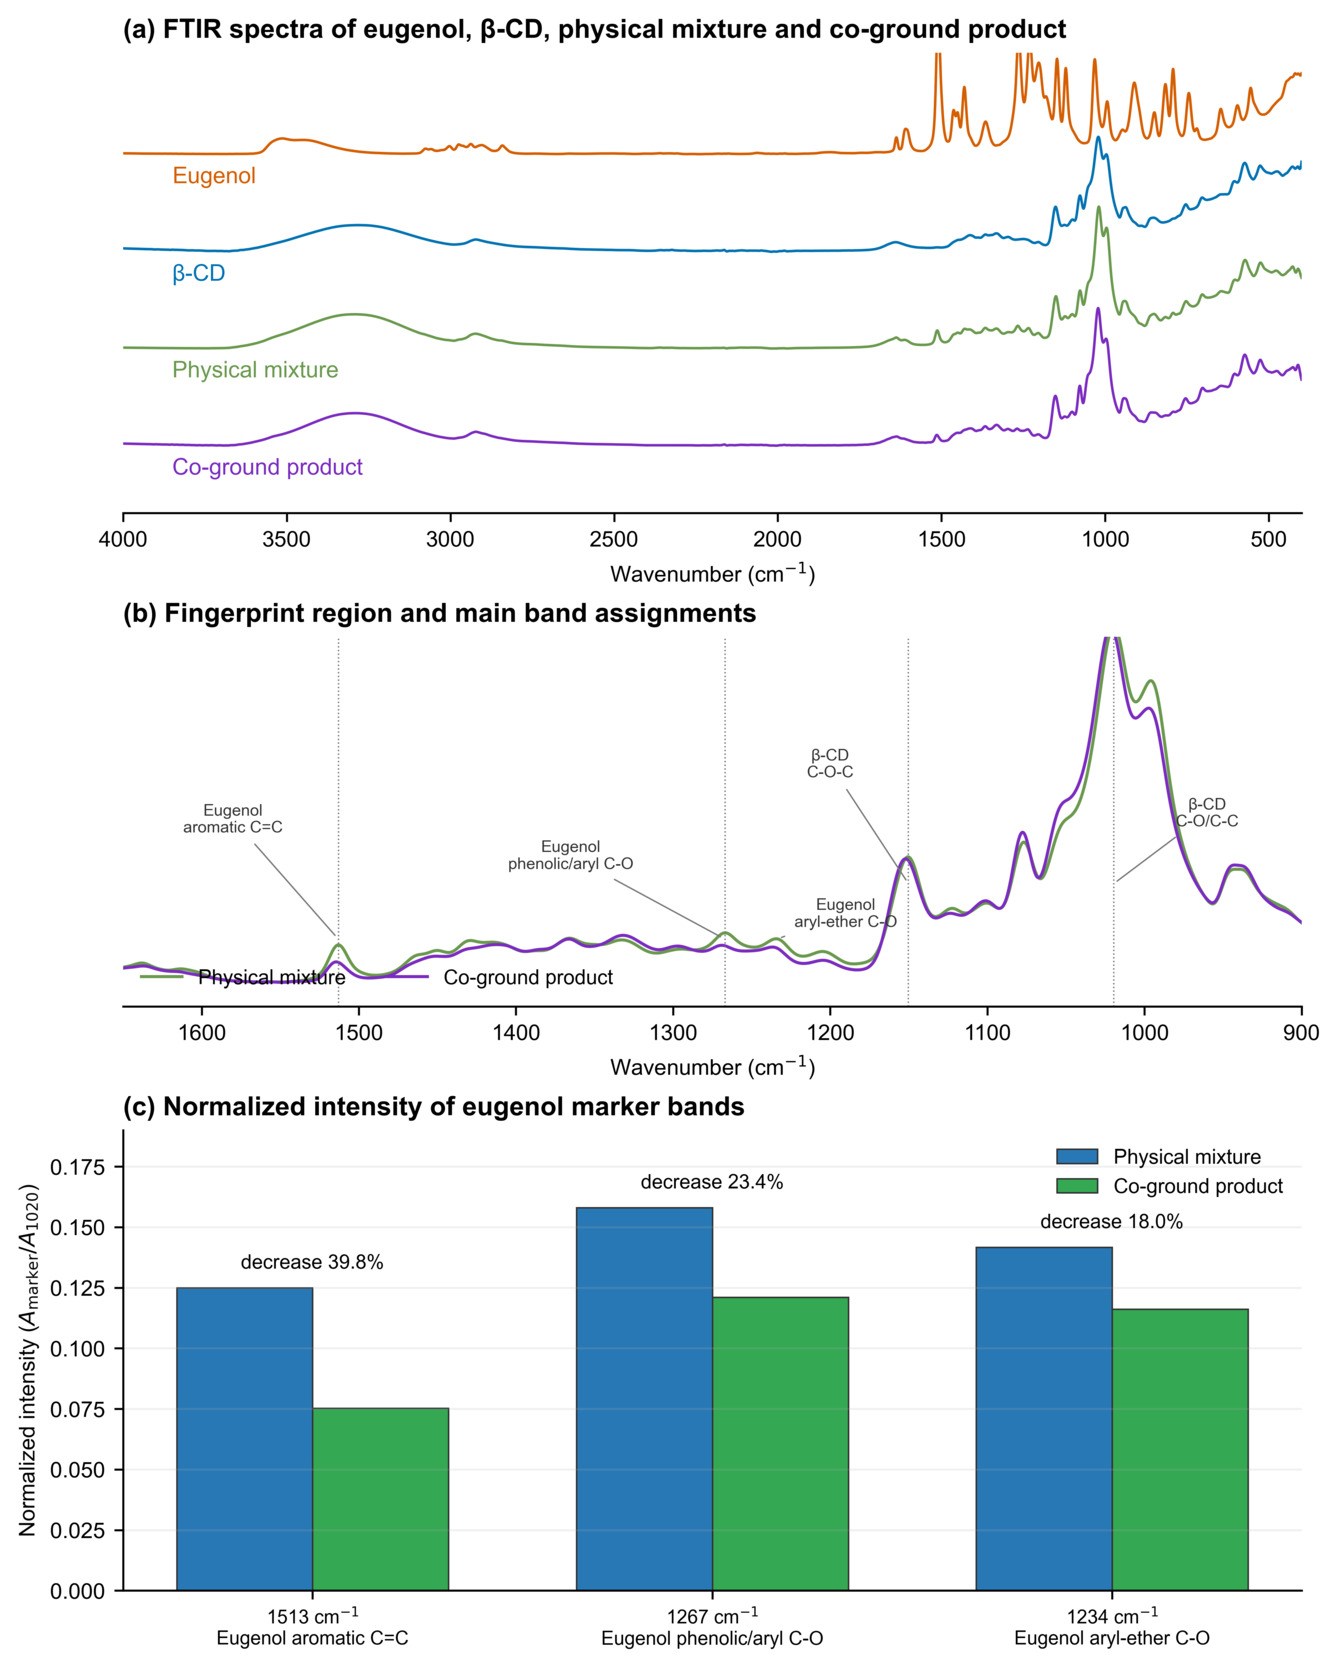
The FTIR comparison is presented in Figure 6a–c. In the full-spectrum comparison (Figure 6a), the unground physical mixture retained spectral contributions from both eugenol and β-CD, whereas the co-ground product showed a modified profile that was dominated by the β-CD matrix. Because the absolute absorbance scale can be affected by sample loading and ATR contact, this full-spectrum comparison was used to identify co-grinding-associated spectral differences rather than to quantify eugenol content. In the fingerprint region (Figure 6b), relative to the physical mixture, the co-ground product showed shifts in the eugenol aromatic C=C band (1512.9 to 1514.3 cm-1), the phenolic/aryl C–O band (1267.0 to 1268.9 cm-1), and the aryl-ether C–O band (1234.2 to 1236.6 cm-1), together with changes in β-CD-associated bands (1150.3 to 1152.3 cm-1 and 1019.7 to 1021.6 cm-1).
The marker-band comparison (Figure 6c) provided a loading-corrected, within-spectrum assessment: after normalization to the β-CD band near 1020 cm-1, the relative intensities of the eugenol bands near 1513, 1267, and 1234 cm-1 were 0.125, 0.158, and 0.142 in the physical mixture, compared with 0.075, 0.121, and 0.116 in the co-ground product, corresponding to decreases of 39.8%, 23.4%, and 18.0%, respectively. Taken together, the independent fingerprint-region changes in Figure 6b,c support altered local environments of eugenol and β-CD after co-grinding and are consistent with partial inclusion of eugenol within the β-CD matrix. FTIR alone does not quantify inclusion efficiency or exclude all contributions from non-inclusion interactions.
4. Discussion
The markedly prolonged induction time in the Raw group reflects the well-documented physicochemical barrier imposed by hydrophobicity on gill uptake.6,9 Unformulated eugenol, with a logP of approximately 2.27 and aqueous solubility of only ~2.4 g L-1 at 25 °C,6 forms a heterogeneous surface film rather than a homogeneous aqueous dispersion. This film configuration restricts the effective concentration gradient across the gill epithelium, limiting passive diffusion—the primary absorption route for immersion anesthetics.4 The complete loss of efficacy by 24 h in the Raw group is consistent with the volatilization half-life reported for neat eugenol in open aqueous systems9 and underscores a practical constraint: raw eugenol cannot be prepared in advance for batch operations, which limits its utility in high-throughput aquaculture settings where dozens or hundreds of fish must be processed sequentially.
Both the Ethanol and β-CD formulations circumvented this solubility barrier, achieving statistically equivalent induction times at 20 mg L-1. The mechanisms, however, differ. Ethanol acts as a hydrotropic co-solvent, disrupting hydrophobic eugenol clusters and forcing molecular dispersion into the aqueous phase.13 β-Cyclodextrin, by contrast, accommodates the aromatic eugenol molecule within its truncated-cone hydrophobic cavity (diameter ≈ 6.0–6.5 Å), forming a water-soluble host–guest inclusion complex with a reported binding constant in the range of 200–600 M-1.10,12 Despite these mechanistic differences, the two formulations may deliver comparable bioavailable eugenol concentrations at the gill interface during the initial exposure period, yielding indistinguishable induction kinetics. This convergence is noteworthy because it suggests that, for the specific endpoint of rapid onset, either formulation is pharmaceutically adequate—the choice between them should therefore be guided by downstream considerations such as recovery duration and formulation stability.
The FTIR results provide physicochemical support for co-grinding-induced interactions between eugenol and β-CD. Compared with the physical mixture, the co-ground preparation showed shifts in the eugenol aromatic C=C, phenolic/aryl C–O, and aryl-ether C–O bands from 1512.9, 1267.0, and 1234.2 cm-1 to 1514.3, 1268.9, and 1236.6 cm-1, respectively. After normalization to the β-CD band near 1020 cm-1, the relative intensities of these marker bands decreased by 39.8%, 23.4%, and 18.0%. These coordinated changes indicate that co-grinding altered the local environments of both eugenol and β-CD and are consistent with host–guest interactions and partial cavity inclusion. This interpretation agrees with previous studies showing that the aromatic ring of eugenol can enter the hydrophobic β-CD cavity, whereas its oxygen-containing groups remain near the cavity rims.13,17,18 Nevertheless, FTIR alone cannot quantify the included fraction or fully distinguish cavity inclusion from adsorption, hydrogen bonding, or other solid-state associations. Accordingly, the material is conservatively described as a β-CD/eugenol co-ground preparation, and the observed spectral changes are not considered direct evidence of sustained release or altered pharmacokinetics.
The significantly prolonged recovery observed in the β-CD group was a consistent behavioral finding under the tested conditions. Although we did not directly measure eugenol concentrations in water or fish tissues, based on our behavioral observations, we hypothesize that, during exposure, the dynamic equilibrium between free and β-CD-associated eugenol may replenish free eugenol as it is absorbed across the gill epithelium, thereby maintaining the diffusion gradient at the gill-water interface for longer than formulations without this buffering capacity.14,15,24 This may increase the total absorbed eugenol burden, thereby extending the time required for clearance and behavioral recovery. We do not assume sustained uptake after transfer to clean water, where the bulk concentration gradient should favor eugenol efflux from tissues into the surrounding water. A minor contribution from transient mucus-associated retention cannot be excluded, but this remains hypothetical. Direct pharmacokinetic measurements of eugenol in water, plasma, and gill tissue during induction and recovery are needed to confirm the mechanism underlying the prolonged recovery.
The temporal stability experiment revealed a practical difference in behavioral anesthetic performance between formulations. Over the 24 h observation period, the β-CD co-ground preparation maintained consistent induction and recovery performance, referred to here as “functional stability,” in contrast to the decline observed in the other two formulations. The FTIR data support co-grinding-associated interactions between eugenol and β-CD, which may contribute to the observed performance. However, direct physicochemical stability parameters (e.g., particle size, turbidity, dissolved eugenol concentration) were not measured, and “functional stability” refers exclusively to the consistency of anesthetic performance over time.
The intermediate stability profile of the Ethanol formulation merits mechanistic discussion. Without analytical quantification of dissolved components over time, we speculate that the significant prolongation of induction at 24 h, despite stable recovery times, may reflect differential volatilization kinetics between ethanol (boiling point 78.4 °C)25 and eugenol (boiling point 254 °C).26 If ethanol evaporated more rapidly during storage, the residual ethanol concentration might decrease, progressively reducing its hydrotropic solubilizing capacity and causing eugenol to re-partition into surface films or colloidal aggregates.27 Under this hypothesis, this shift could reduce the bioavailable fraction available for gill uptake, thereby delaying induction. The relative stability of recovery times, meanwhile, may reflect a floor effect: once fish reach Stage A3, the absolute amount of eugenol absorbed—rather than its bath concentration—is the primary determinant of recovery duration, and sufficient eugenol absorption had occurred even at 24 h. Previous work reported that ethanol co-solvent systems can introduce pharmacokinetic variability attributable to differential partitioning behavior over time.11 However, because neither ethanol nor dissolved eugenol was quantified, this interpretation remains speculative.
While the present study, supported by structural FTIR evidence, clearly demonstrates the functional stability of the β-CD/eugenol co-ground preparation, the specific operational boundaries of this experimental model should be defined. First, to accurately simulate the autumn/winter transport season for X. davidi, the fish anesthesia and temporal-stability experiments were deliberately conducted at 10.0 ± 0.3 °C. Because water temperature fundamentally influences branchial ventilation and membrane partitioning kinetics,3,4 the relative magnitude of the observed depot effect must be validated at higher temperatures (e.g., 20–28 °C) prior to broader commercial extrapolation. Second, our assessment relied strictly on behavioral endpoints to preserve the viability of the small juveniles; incorporating physiological stress profiling (e.g., plasma cortisol and glucose) in future studies will be necessary to fully map the welfare implications of prolonged recovery. Third, because the three formulations differed visibly in appearance in the exposure bath (Figure 1), treatment allocation could not be masked from the observers, and a contribution of observer expectation to the judgment-based staging cannot be formally excluded; independent, blinded scoring should be incorporated in future trials. Fourth, the numerical discrepancy in initial induction times between the comparative and temporal stability trials may partly reflect the smaller per-time-point sample size (n = 5 vs. n = 30) in the latter trial, highlighting the need for larger-scale validations to mitigate batch-to-batch variability. Finally, while the FTIR analysis provides essential physicochemical confirmation of host–guest interactions between eugenol and β-CD, quantitative analytical chemistry remains a crucial next step. Future investigations should employ HPLC or GC to monitor the precise bioavailable dissolved eugenol concentrations over time, alongside complementary structural techniques (e.g., DSC, NMR, or phase-solubility analysis) to definitively determine encapsulation efficiency and stoichiometry. By defining these boundaries, the current findings establish a robust behavioral and physicochemical foundation for optimizing β-CD-based fish anesthetics.
5. Conclusions
This study shows that formulation strategy influences the behavioral anesthetic performance of eugenol under the tested conditions. Unformulated raw eugenol showed reduced induction efficiency and lost functional activity during storage. While both ethanol and the β-CD/eugenol co-ground preparation enabled rapid induction, they produced distinct recovery profiles. The β-CD co-ground preparation maintained more consistent behavioral anesthetic performance over 24 h and showed FTIR changes consistent with eugenol–β-CD interactions; however, its actual dissolved eugenol concentration, encapsulation efficiency, and physicochemical stability were not determined. The prolonged recovery associated with the β-CD co-ground preparation should be interpreted as context-dependent rather than an unequivocal advantage. Careful post-anesthesia monitoring and validation at higher production temperatures are required before broader application.
Acknowledgments
This research was funded by the Natural Science Foundation of Henan (252300420726), Henan Province Science and Technology Tackling Projects (252102110075, 252102321036), the Doctoral Research Start-up Fund of Xinyang Agriculture and Forestry University (203129), the 2025 Henan Province “Science and Technology Vice President” Program, and the 2027 Henan Provincial Higher Education Key Research Project (Youth Program, Grant No. 27BQ240001). During the preparation of this manuscript, the authors used generative artificial intelligence tools solely for English-language polishing and grammar correction. The authors reviewed and edited the output and take full responsibility for the publication’s content.
Author Contributions – CRediT
Conceptualization: Gaoyou Yao (Equal), Haijun Tian (Equal), Junru Wang (Equal). Methodology: Gaoyou Yao (Lead). Investigation: Gaoyou Yao (Equal), Yuyuan Wu (Equal), Mengfan Ren (Equal), Tao Li (Equal), Xingxing Ding (Equal), Yuanbo Wang (Equal), Yang Lu (Equal), Xiaoying Su (Equal), Xusheng Guo (Equal). Data curation: Gaoyou Yao (Equal), Yuyuan Wu (Equal), Yuanbo Wang (Equal). Writing – original draft: Gaoyou Yao (Lead). Validation: Mengfan Ren (Equal), Xusheng Guo (Equal). Resources: Hefan Zhang (Equal), Hua Zhang (Equal). Supervision: Hefan Zhang (Equal), Hua Zhang (Equal), Haijun Tian (Equal), Junru Wang (Equal). Software: Shijie Yang (Lead). Formal Analysis: Shijie Yang (Lead). Visualization: Yang Lu (Lead). Funding acquisition: Haijun Tian (Equal), Junru Wang (Equal). Project administration: Junru Wang (Lead).
Conflicts of Interest
The authors declare that there are no relevant financial or non-financial competing interests to report.
Ethical Conduct Approval – IACUC
The animal study protocol was approved by the Animal Ethics Committee of Xinyang Agriculture and Forestry University (Approval No. XYNL-2026-0035).
Informed Consent Statement
All authors have read and agreed to the published version of the manuscript and agree to be accountable for all aspects of the work.
Data Availability Statement
Data supporting the reported results are included within the article. Additional raw data are available from the corresponding author upon reasonable request.