
1. Introduction
Nutrients provide the material foundation for the survival of aquatic species. Their distribution patterns and concentration gradients directly impact important ecological parameters, including primary productivity, phytoplankton community structure, biomass dynamics, and biodiversity patterns.1,2 In the upper ocean, macronutrients such as dissolved reactive phosphate, inorganic nitrogen, and silicate, along with solar energy, serve as the foundation of the food chain. Phytoplankton directly utilize these nutrients through photosynthetic mechanisms, whereas zooplankton indirectly ingest them into organic matter and pass them along the food chain. During the transport of nutrients down the food chain via biological pumps, some organic matter is degraded by bacteria and converted into inorganic nutrient salts.3–5 The sunlit surface layer is the most important region for primary production in the ocean, and the abundance of nutrients here (mainly nitrate) determines the fertility of the surface ocean. After the utilization and regeneration of nutrients mentioned above, oceanic surface water is generally nutrient-depleted and experiences a slight increase in nutrients as you move downward through the photic zone. Biological remineralization within the thermocline elevates nutrient concentrations sharply beneath the euphotic layer.5,6
The Redfield ratio of nitrogen to phosphorus in seawater is a key indicator of potential marine fertility and environmental carrying capacity,7,8 and its numerical deviation can directly reflect the type of nutrient limitation in the sea area. Systematic research on nutrient distribution patterns and cycling mechanisms is an important basis for analyzing marine primary production processes, conducting fishery resource assessment, and formulating marine ecological protection plans.9,10 Marine nutrient distribution is jointly regulated by particle deposition, vertical mixing of water, and the generation and decomposition of organic matter. In middle- and low-latitude sea areas, nitrate and phosphate availability often limits primary productivity, and upwelling of nutrient-rich deep water is an important pathway for nutrient supplementation. In areas with significant water stratification, surface nutrients are largely consumed by phytoplankton and cannot be replenished in time by upwelling, leading to oligotrophic conditions (Qu, 2025). Under these circumstances, nutrient regeneration becomes key to maintaining primary productivity, leading to significant regional heterogeneity in nutrient distribution laws and dominant controlling mechanisms.11
The northwest Arabian Sea is one of the most fertile basins in the world’s oceans, and the Indian Ocean, the third-largest ocean, has distinctive biogeochemical features.12 The tropical Indian Ocean is a prominent monsoon zone worldwide due to the notable land-sea thermal differential created by the Indian Ocean’s northern limit, which ends near 24°N.13 The cold, dry wind across the eastern continent caused strong convective mixing, thereby increasing the density of surface water and accelerating evaporation.14 The deeper mixed layer -125 m,15 often deeper than the seasonal nitracline, leads to entrainment of nutrients into the homogeneous upper layer.16 Meanwhile, the annual wind-direction reversal of the Asian monsoon system results in distinctive seasonal thermohaline variations in the equatorial Indian Ocean (10°S-10°N). The combined effects of the equatorial countercurrent, the North Equatorial Current and the North Indian Ocean circulation further promote the migration and redistribution of nutrients in the water body. As an important area for global thermohaline circulation and the biogeochemical cycle of carbon and inorganic nutrients, the distribution of nutrients in the northwest Indian Ocean is not only regulated by physical processes driven by monsoons, but also closely coupled with biological processes such as biological metabolism and microbial transformation, and its complex nutrient cycle characteristics have become a research hotspot in marine biogeochemistry (Schott & Jr. McCreary, 2001).
Although the ecological and oceanographic significance of the northwest Indian Ocean has been widely recognized, and existing studies have confirmed the important role of monsoons in water movement and nutrient supplementation in this sea area, most of the current research focuses on the overall nutrient characteristics during the monsoon period, and systematic investigations on nitrogen and phosphorus nutrients in the upper waters during the dry season (the peak period of the northeast monsoon) are still relatively scarce. At the same time, most existing studies focus on the distribution description of a single nutrient index, and in-depth analysis has not been carried out on the coupled horizontal and vertical distribution characteristics of various forms of nitrogen and phosphorus nutrients, as well as the joint regulatory mechanism of multiple factors such as thermohaline stratification, biological absorption and microbial transformation on nutrient distribution, nor have the regional characteristics of the nutrient structure in this sea area been clarified. In addition, there is a lack of basic data on nitrogen and phosphorus nutrients based on large-scale and multi-station systematic investigations for the key sea area of 0.5°N-18°N and 59.5°E-67.5°E in the northwest Indian Ocean, which makes it difficult to support the scientific decision-making of fishery resource development and marine ecological protection in this sea area.
Based on this, this study takes the upper waters of the northwest Indian Ocean in the dry season as the research object. Through large-scale, comprehensive environmental surveys, it systematically analyzes the compositional characteristics of different forms of nitrogen and phosphorus nutrients in this sea area, clarifies their horizontal and vertical spatial distribution patterns, and explores the regional characteristics of nutrient structure and the dominant factors influencing them. It is expected to fill the gap in the research on the distribution of nitrogen and phosphorus nutrients in the dry season of this sea area, deepen the understanding of the marine nutrient biogeochemical processes in the monsoon region of the northern Indian Ocean, and provide basic data and scientific basis for the fishery resource assessment and marine ecological protection in this sea area.
2. Materials and Methods
2.1. Survey time and stations
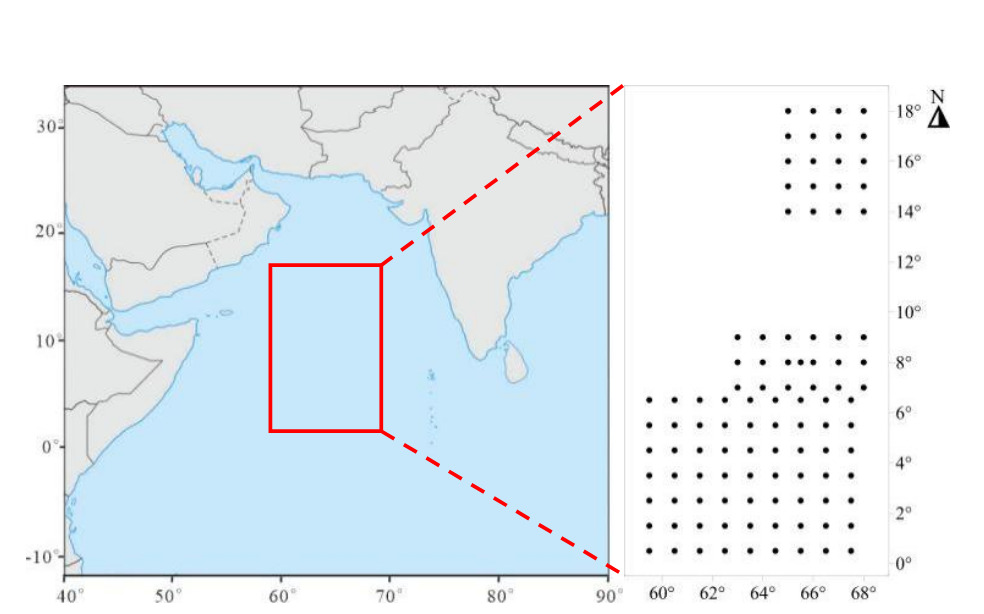
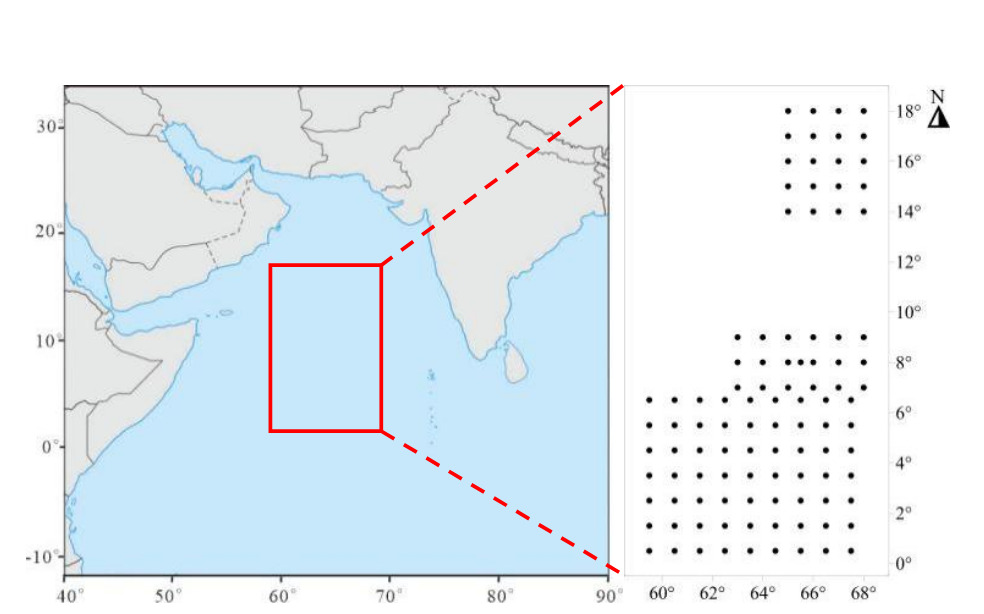
The East China Sea Fisheries Research Institute of the Chinese Academy of Fishery Sciences’ Lanhai 201 scientific research ship carried out a thorough environmental survey in the waters north of the equator of the northwest Indian Ocean (southern Arabian Sea) between late December 2023 and mid-February 2024 (latitude 0.5°N-18°N, longitude 59.5°E-67.5°E). There were 102 survey stations in all (Fig. 1).
2.2. Sampling and method
Seawater temperature (T) and salinity (S) data at each station were measured directly with the SBE 911plus CTD, and water samples were collected using a Niskin water sampler mounted on the CTD. Sampling levels were 5 m, 25 m, 50 m, 75 m, 100 m, 150 m, 200 m, and 300 m, for a total of 8 levels, used to analyze nitrogen and phosphorus nutrients and chlorophyll a concentration in the water column. For nutrient analysis, water samples were immediately filtered through 0.45 μm cellulose acetate membranes (Whatman, UK) and stored at −10°C to −20°C until analysis. Concentrations of NH₄⁺-N, NO₃⁻-N, NO₂⁻-N, and PO₄³⁻-P were determined using a DR3900 spectrophotometer (HACH, USA) following the GB/T 12763.4-2007 Specifications for Marine Survey. Chlorophyll a (Chla) was extracted with 90% acetone for 24 h in the dark at 4°C and measured fluorometrically (Turner Designs, USA). All analyses were performed in triplicate, with a coefficient of variation < 5%.17
Quality assurance and quality control (QA/QC)
Detection limits (3× standard deviation of blank): NO₃⁻-N 0.03 μmol/L, NO₂⁻-N 0.02 μmol/L, NH₄⁺-N 0.05 μmol/L, PO₄³⁻-P 0.02 μmol/L, Chla 0.01 μg/L.
Analytical precision (relative standard deviation, RSD) for replicate measurements (n=6) of a mid-range standard: <5% for all nutrients and <8% for Chla.
Parallel samples (duplicate collections from the same depth at 10% of stations): coefficient of variation (CV) ranged from 3% to 9% for nutrients and 6% to 12% for Chla.
Sample preservation: filtered samples were stored in dark polyethylene bottles and frozen immediately; analysis was completed within 1 month.
Contamination control: all glassware and filtration equipment were acid-washed (10% HCl) and rinsed with Milli-Q water; field blanks were run daily to correct for possible contamination.
2.3. Data analysis
SPSS 25.0 (SPSS Inc., USA) was used to conduct the correlation analysis between environmental factors and nitrogen and phosphorus nutrients. Data normality and homogeneity of variance were verified using Shapiro-Wilk and Levene’s tests, respectively, and one-way ANOVA was used to compare the between-group differences, and Tukey’s post hoc test was performed when the differences were significant (p<0.05). Golden Software Surfer 25 (Golden Software, USA) was used to complete the sample station map and the distribution map of these nutrients. Ocean Data View 5.6.7 was used to finish the cross-sectional distribution map of the phosphorus and nitrogen nutrients (Alfred Wegener Institute, Germany). The deficiency of nitrogen or phosphorus in the ecosystem is commonly indicated by the N/P ratio, following the research methods described in the article,17 calculated as
N/P = DIN (Dissolved Inorganic Nitrogen)/DIP (Dissolved Inorganic Phosphorus).
In the formula, DIN (μmol/L) and DIP (μmol/L) denote the measured concentrations of DIN and DIP, respectively.
3. Results
3.1. Primary environmental parameters of the northwestern Indian Ocean
Table 1 displays the primary environmental characteristics of seawater in the various water layers of the Northwest Indian Ocean. The temperature variations between the various water layers are substantial. The temperature steadily drops with increasing depth. The salinity variations between the various water levels, are especially noteworthy. As depth deepens, the salinity first rises and then falls. The concentrations of NH4+-N, NO3--N, NO2--N and PO43--P varied considerably across different water layers in the study area. Specifically, the NH4±N concentration increased gradually from 5 m to 50 m, then decreased from 50 m to 100 m, and finally rose again from 100 m to 300 m. For NO3--N, its concentration remained relatively stable at depths above 50 m, and then increased steadily with increasing water depth from 50 m to 300 m. NO2--N maintained a consistently low level throughout the surveyed waters, with no obvious variation trend observed across different water layers. As for PO43--P, its average concentration exhibited significant spatial variability in the shallow water layer above 100 m, whereas no distinct changing trend was detected at depths below 100 m. The concentration of DIN showed no significant difference among different water layers in the shallow sea area above 50 m, but presented a notable increasing trend at depths below 50 m.
Chla concentrations in the Northwest Indian Ocean are typically low, at less than 0.1 mg/m3. The Chla concentrations in the 5 m and 25 m water layers do not differ significantly. However, there are notable variations in the Chla content between the 50 m, 75 m, 100 m, and 150 m water layers. The Chla concentration gradually increases with depth, starting at the surface layer. It peaks at 75-100 meters below the surface, with a maximum of 0.94 mg/m3. The Chla concentration decreases rapidly as water depth increases. The average Chla concentration has decreased to 0.04 mg/m3 in the water depth range of 150 - 200 m. With an average of just 0.03 mg/m3, the Chla concentration is much lower in the 200 - 300 m water layer.
3.2. Horizontal distribution of nutrients and environmental factors
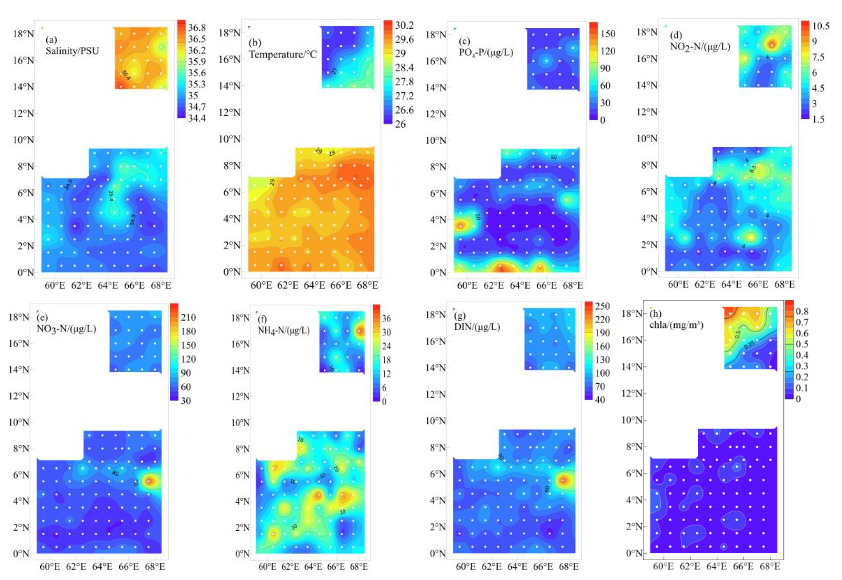
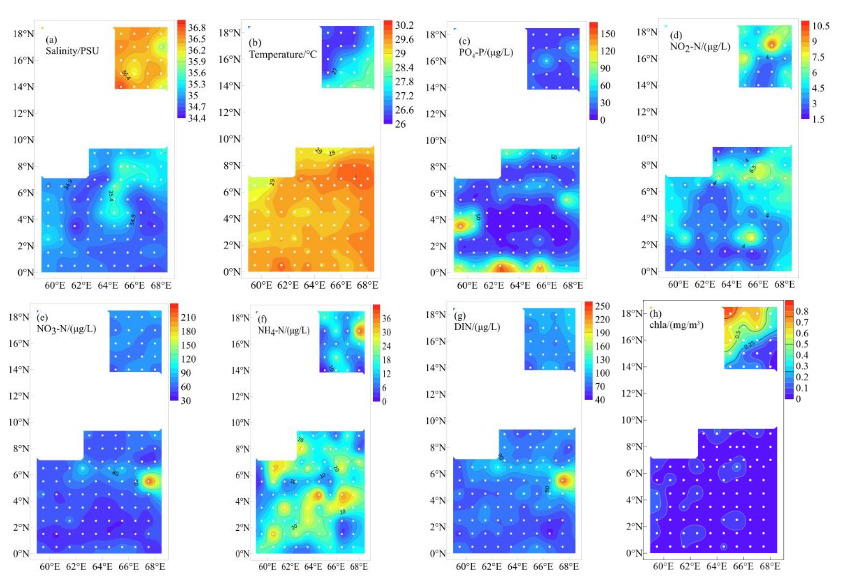
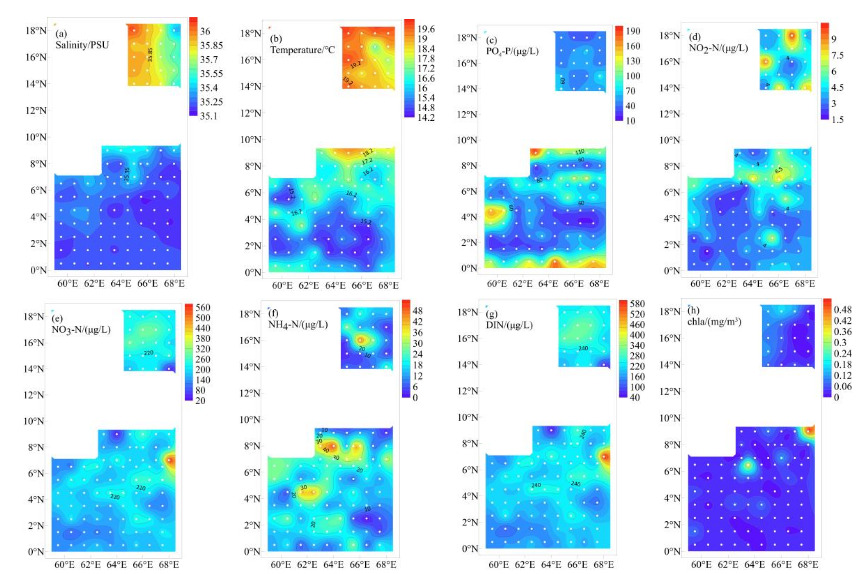
This study used three water layers (5 m ‘surface’, 50 m ‘subsurface’, and 150 m) to represent the environmental factors and nutrient properties of the upper seawater layer (Figs. 2, 3, 4). First, temperatures and surface (5 m) salinities differ between the northern and southern regions (Fig. 2). Due to water mass dynamics, the average surface salinity was 34.85±0.25, with lower values in the southern area and higher values in the northern area. The average temperature of the surface layer was 29.44±0.28℃, showing higher temperatures in the southern region and lower temperatures in the northern region, influenced by latitude. The surface layer had an average PO43--P concentration of 32.84±37.14 μg/L. The southern region near the equator exhibited a higher PO43--P level compared to the northern region, which had a lower concentration. High data variability and an uneven distribution are indicated by the phosphate content standard deviation, which is higher than the average. The sea area under study spans a wide range of latitudes from north to south. A notable disparity in phosphate content is caused by the comparatively high phosphate content in the southern portion of the examined area and the relatively low phosphate content in the northern portion. The surface layer’s NO2--N level averaged 3.75±1.23 μg/L, with the highest values found in the northern region, particularly in areas of high latitude. With an average of 58.38±26.22 μg/L of NO3--N in the surface layer, the southern area demonstrated the lowest content, while the northern region showed the highest, especially in its eastern half. The average NH4+-N content in the surface layer was 17.06±8.80 μg/L, without a clear distribution pattern. Overall, the content was generally higher in the southern region than in the northern region. The average surface DIN content was 26.40±28.22 μg/L, and its distribution characteristics aligned with those of NO3--N, showing low values in the southern region, high values in the northern region, and a peak in the eastern part of the southern region. Significant data variability and an unequal distribution are indicated by the high standard deviation of DIN content. The wide latitude range of the investigated marine region from north to south may be due to upwelling-induced local enrichment. The average surface Chla content was 0.04±0.03 mg/m3, showing lower levels in the southern region, higher Chla content in the northern high-latitude region, and lower Chla levels in the low-latitude areas.
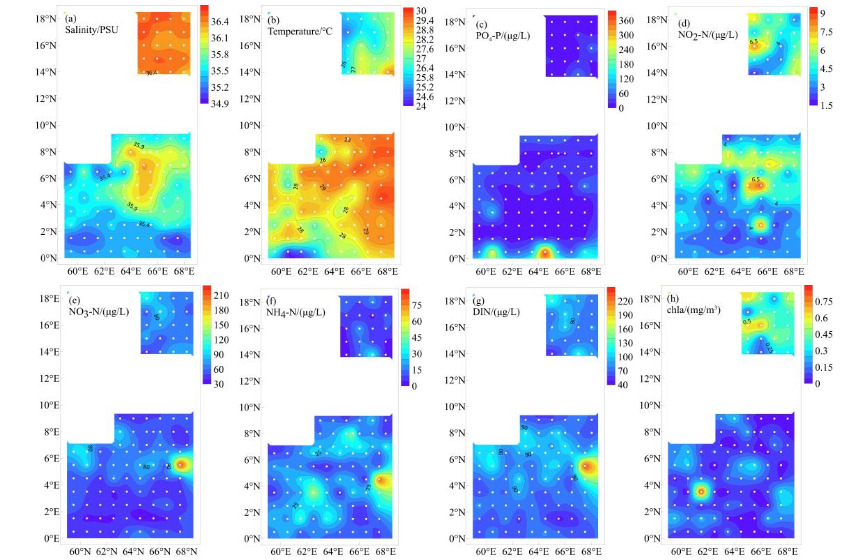
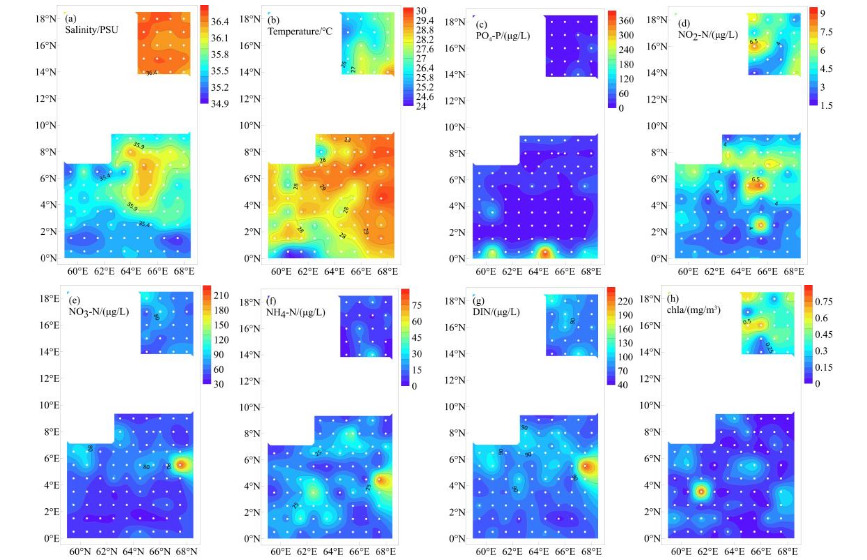
The subsurface (50 m) temperature and salinity distribution characteristics were similar to those of the surface layer (Fig. 3). The subsurface layer’s average temperature was 28.24±1.14°C, and its average salinity was 35.55±0.32. The relationship between surface salinity and temperature, and subsurface salinity and temperature, differed significantly. Although the subsurface’s average PO43--P content was higher than the surface’s (38.71±62.45 μg/L), there was no discernible difference. The parameters of the distribution aligned with those of the PO43--P content at the surface. A significant degree of data variability and an uneven distribution are indicated by the phosphate content standard deviation, which is higher than the average value. There are notable fluctuations in temperature and salinity in the 50 m water layer, which lies within a thermohaline transition zone. Here, mesoscale phenomena (such as vortices) and the water mass barrier have a significant impact, leading to a very high degree of spatial variation in the phosphate concentration. With an average level of 3.71±1.50 μg/L, the subsurface layer’s NO2--N content remained low and did not differ substantially from that in the surface layer. The distribution characteristics aligned with those of the surface NO2--N content. The NO3--N content of the surface layer and the subsurface layer did not differ significantly. The subsurface layer had an average NO3--N content of 57.13±26.72 μg/L. The distribution properties of NO3--N in the surface layer and the subsurface layer were in agreement. The amounts of NH4±N in the surface and subsurface layers did not differ significantly. The subsurface had an average NH4+-N content of 20.33±12.84 μg/L. The distribution properties of NH4+-N in the surface layer and the subsurface were in agreement. The subsurface and surface DIN contents did not differ significantly. The subsurface layer’s DIN distribution characteristics were comparable with those of the surface layer, with an average DIN content of 27.06±28.14 μg/L. The comparatively high DIN content standard deviation suggests a high degree of data variability and an unequal distribution. This could be because of the vortex’s substantial vertical and horizontal nutrient transfer at this depth, which causes a great deal of spatial heterogeneity. Compared to the surface layer, the subsurface layer’s Chla content was substantially different. The subsurface layer’s average Chla content was 0.12±0.13 mg/m3. The subsurface layer’s Chla content distribution features were high in the northern region and low in the southern region.
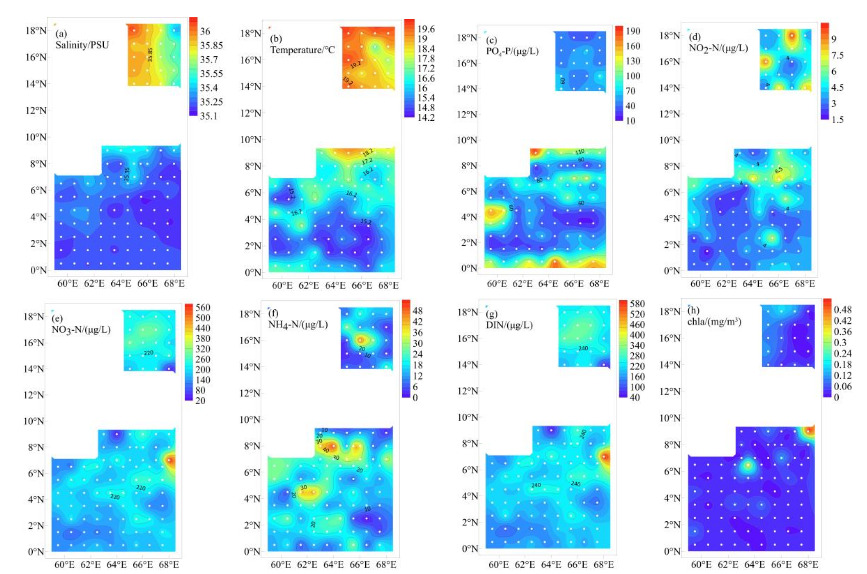
In contrast to the surface and subsurface layers, the 150 m water layer exhibited distinct salinity and temperature distributions (Fig. 4). The northern region had higher temperatures, and the southern region had lower salinity. In contrast to the surface and subsurface salinity, the average salinity of the 150 m water layer was 35.23±0.05. Furthermore, the eastern part of the northern region had a lower salinity than the western part. In contrast to the surface and subsurface temperatures, the average temperature of the 150 m water layer was 15.66±0.92 °C. As depth increased, the temperature dropped considerably. The distribution features were comparable with the distribution characteristics of PO43--P content in the surface layer, and the average content of PO43--P in the 150 m water layer was 62.99±38.90 μg/L, which was much greater than that in the surface and subsurface layers. With an average level of 3.41±1.08 μg/L, the NO2--N content in the 150 m water layer remained low and did not differ significantly from that of the surface and subsurface layers. The distribution characteristics aligned with the surface layer’s NO2--N content distribution characteristics. The 150 m water layer had a substantially different NO3--N level than the surface and subsurface layers. In the 150 m water layer, the average NO3--N content was 176.55±40.05 μg/L. In the 150 m water layer, the NO3--N distribution properties matched those in the surface and subsurface layers. The NH4+-N concentration of the 150 m water layer did not differ significantly from that of the surface and subsurface layers. The 150 m water layer had an average NH4+-N content of 17.28±8.06 μg/L. The NH4+-N distribution properties in the 150 m water layer were in agreement with those found in the subsurface and surface layers. Compared with the surface and subsurface layers, the DIN content in the 150 m water layer differed substantially. In the 150 m water layer, the average DIN content was 65.75±82.02 μg/L. In the 150 m water layer, DIN distribution characteristics matched those in the surface and subsurface layers. The comparatively high DIN content standard deviation suggests a high degree of data variability and an unequal distribution. The marine anoxic layer may affect the unusually high DIN concentration in the 150 m water layer. Strong denitrification (removing inorganic nitrogen and lowering concentration) and remineralization (producing inorganic nitrogen and raising concentration) are occurring simultaneously at this level. The overall impact of these two processes varies greatly in space and is influenced by the microbial community, organic matter flux, and local oxygen content. The 150 m water layer’s Chla concentration did not differ significantly from that of the surface and subsurface layers. The average Chla content was 0.04±0.05 mg/m3 in the 150 m water layer, and the distribution of Chla concentration showed higher values in the north and lower in the south.
The summary of horizontal distribution patterns of key nutrient environmental parameters across different water layers is presented in Table 2.
3.3. Vertical distribution of nutrients and environmental factors
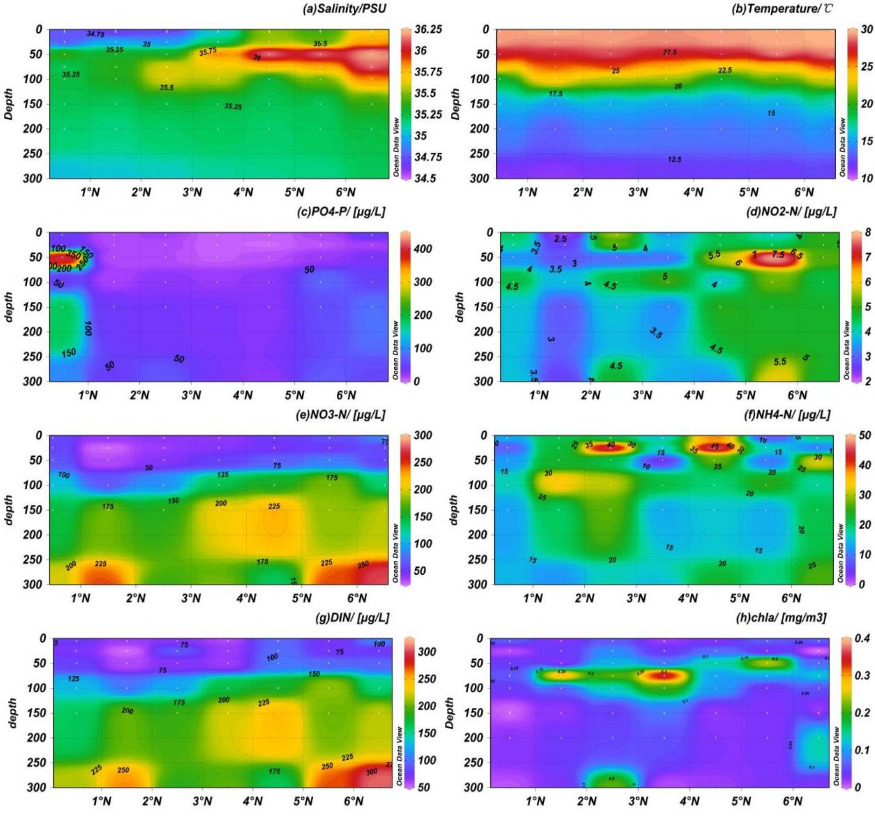
To examine the stratified distribution of environmental factors throughout the water column and the vertical fluctuation of nutrients, a longitudinal transect at 64.5°E was used (Fig. 5). The upper 0-50 m layer of the equatorial region had a relatively low salinity, whereas the salinity distribution between 50-300 m was more uniform and showed very little change. The highest salinity was recorded at 50 m in mid-latitude areas, most likely due to water mass dynamics. Temperature showed a distinctive vertical profile over the 64.5°E transect, peaking at about 28°C at the surface and gradually decreasing as depth increased, reaching about 10°C at 300m.
In the equatorial zone, the vertical distribution of PO43--P along the 64.5°E transect showed a maximum concentration at 50 m, whereas in mid-latitude regions, no discernible variations were found across depth layers. Oligotrophic conditions with relatively low PO43--P concentrations were observed throughout the northwest Indian Ocean. NO2--N content was low in equatorial waters and rose with increasing latitude. The high-value area occurred in the surface layer and at 100 m depth; around 100 m near 6°N, a noticeable peak in NO2--N was observed. Surface waters had low NO3--N concentrations, but they steadily increased with increasing depth. Although there were two distinct maxima in the surface layer and higher concentrations between 1-3°N and at depths of 0-200 m, the distribution of NH4+-N lacked a defined spatial pattern.
Because NO3--N contributed more than any other element to the DIN pool in the northwest Indian Ocean, the vertical distribution of DIN closely matched that of NO3--N. While Chla concentration was low in other areas, it was comparatively high in the 50-100 m depth range, with a noticeable peak seen at 75 m close to 3.5°N.
_salinit.png)
4. Discussion
4.1. Concentration and distribution characteristics of nutrients in the northwestern Indian Ocean and comparison with other tropical ocean regions
In this study, the average PO43--P concentration was 45.52 μg/L, with a vertical range of 1-433 μg/L. PO43--P showed a vertical distribution pattern in the upper water column that was comparable to that of NO3--N. Concentrations were quite low above 100 m, primarily due to the biological absorption of phytoplankton. A distinct vertical stratification was evident below 100 m, and concentrations increased progressively with depth, primarily due to mineralization and oxidation of organic matter.18 Furthermore, at a depth of 50 m, PO43--P concentrations were significantly greater on the western side of the transect, most likely due to equatorial currents.
In the vertical direction, the concentration ranges of NO2--N, NO3--N, NH4+-N, and DIN were 1-30 μg/L, 25-582 μg/L, 1-155 μg/L, and 38-619 μg/L, respectively. NO3--N was the predominant component of DIN, accounting for more than 60% of DIN in all strata from the surface to a depth of 300 m.
The top water column of the northwest Indian Ocean had comparatively low NO2--N concentrations, which made up a small portion of the DIN in this study. This area showed a clear subsurface nitrite maximum (SNM), with NO2–N concentrations peaking at a depth of about 70 m at 8 μg/L. The concentrations were lower in the water layer above 50 m and below 150 m. The oxidation of NH4+-N to NO2--N by ammonia-oxidizing bacteria or the buildup of nitrite as a result of phytoplankton excretion could be the cause of the SNM at 70 m deep.19,20
As an intermediate product in the mutual transformation between NO3⁻-N and NH4⁺-N, the dynamic fluctuations in NO2⁻-N concentrations can provide vital insights into marine biogeochemical processes.21 Nitrite concentrations in stratified areas of both open oceans and coastal waters typically peak near the base of the euphotic zone, while concentrations in shallower or deeper layers tend to be close to zero.22 The subsurface nitrite maximum is a phenomenon that has been thoroughly investigated.23–25 Fan26 investigated the biological processes behind the SNM in the shelf region of the East China Sea and found a substantial correlation between spring and summer phytoplankton biomass and nitrite concentrations. Nitrite concentrations were still high in the fall, most likely as a result of deep Taiwan Warm Current water upwelling along the continental slope. Liu et al.27 investigated the vertical distribution of NO₂⁻-N and its controlling factors in the Shenhu Sea area of the South China Sea, and revealed that nitrification was more intense at around 100 m depth, where NO2⁻-N was in a more stable environmental condition Furthermore, certain dissolved oxygen, pH, and temperature conditions can promote the development of nitrite maxima in subsurface layers. SNM is widely found in oceanic habitats, according to recent observational investigations.
The vertical distribution patterns of NO3⁻-N and DIN were highly similar, with both concentrations increasing progressively with water depth, consistent with the general distribution law of marine nutrients.3 At depths above 100 m, NO3--N and DIN concentrations were low due to the massive consumption by phytoplankton during growth and reproduction. At depths below 100 m, their concentrations increased gradually with water depth and exhibited obvious vertical stratification; this was because metabolic excreta and remains of dead organisms from the upper water column migrated downward, and were subsequently converted back to inorganic nitrogen and released into the water body through microbial mineralization and oxidation. The vertical distribution of NH4+-N showed no discernible trend, with concentrations mostly ranging from 1 to 50 μg/L, and only relatively low levels were observed in the surface waters of the northern study area. NO₃⁻-N is the most stable inorganic nitrogen species in seawater and the thermodynamically preferred form of combined nitrogen, which is a byproduct of the nitrification of organic nitrogen. Elevated water temperatures can further facilitate the oxidation of organic nitrogen and the subsequent oxidation of NO2⁻-N and NH4+-N.
The concentration ranges observed in this study are generally comparable to those reported for other tropical oligotrophic ocean regions. The average PO43-P concentration was 45.52 μg/L (range: 1–433 μg/L vertically), which falls within the range reported for the western tropical Pacific.18 NO₃⁻-N concentrations (25–582 μg/L) were similar to those observed in the South China Sea basin,28 while DIN concentrations (38–619 μg/L) were comparable to North Pacific values but lower than North Atlantic values. This may be related to increased phytoplankton production, water-column stratification, and reduced nutrient inputs in the northern Indian Ocean during the dry season.11
4.2. Dominant Factors Affecting Nutrient Concentration and Distribution Characteristics in the northwestern Indian Ocean
The concentration and spatial distribution of nutrients in marine ecosystems are jointly regulated by multiple processes, including atmospheric deposition, horizontal advection by ocean currents, vertical mixing of water masses, and biogeochemical cycling,28–30 southern Indian Ocean.31 This may be related to high phytoplankton production, water-column stratification, and low nutrient inputs.
Phytoplankton are predominantly distributed in the euphotic zone, where sufficient light and suitable water temperature are available, and they utilize nutrients via photosynthesis to provide energy for their growth and reproduction.6 Phytoplankton are predominantly distributed in the euphotic zone, where sufficient light and suitable water temperature are available, and they utilize nutrients through photosynthesis to provide energy for their growth and reproduction.32 In addition, the El Niño-Southern Oscillation (ENSO) regulates tropical cyclone activity in the northern Indian Ocean by influencing convective forcing, low-level cyclonic vorticity, and marine thermal potential.
Chla distribution and nutrient dynamics are drastically changed by cyclonic systems. According to satellite data from the Indian Remote Sensing Satellite-P4 (IRS-P4), the main cause of summertime increases in Chla levels is cyclonically driven upwelling.33 After a cyclone passes over open-ocean regions, upwelling facilitates the vertical advection of nutrient-rich subsurface waters to the photic zone. This process works in tandem with solar irradiation, leading to increased Chla concentration and phytoplankton biomass.34 In 2007, for instance, a tropical cyclone caused the highest bloom in the Arabian Sea, about 11 mg/m3. In addition, lower storm magnitudes help winds stay over the oceans for longer, resulting in sustained upwelling and blooms; the presence of cold eddies also contributes to phytoplankton blooms.
4.3. Nutrient limitation based on Redfield ratio
The average N/P ratio (DIN/DIP) in the surface layer was 0.80±0.45, far below the Redfield ratio of 16, indicating strong nitrogen limitation. This N-limitation became less pronounced with depth: at 150 m, the N/P ratio increased to 1.04±0.58, still below 16, suggesting that nitrogen remains the primary limiting nutrient throughout the upper 300 m. This implies that primary productivity in this region during the dry season is strongly constrained by nitrogen availability rather than phosphorus.35
Taken together with the horizontal and vertical nutrient distribution patterns analyzed above, this work yields three core innovative findings. First, we constructed a high-density nutrient dataset from 102 synchronous survey stations, which fills the gap in large-scale field observation data for the northwest Indian Ocean during the dry season. Second, we quantitatively calculated the in situ N/P ratio and systematically evaluated the nutrient-limitation status, revealing unique nutrient-structural characteristics of upper waters during the dry season. Third, we clearly identified a shallow-subsurface nitrite maximum at 70 m, which is closely coupled with the deep chlorophyll maximum and monsoon-induced water-mixing processes.
4.4. Limitations and uncertainties
This study has several limitations. First, sampling was confined to the dry season (northeast monsoon), limiting our ability to assess seasonal variability. Second, only one longitudinal transect (64.5°E) was deployed for vertical profile analysis, resulting in insufficient sectional coverage of the study domain and an inability to fully reflect its sectional characteristics. Third, only temperature, salinity and Chla were synchronously measured. Dissolved oxygen, pH and microbial community data were not synchronously measured, so the interpretation of microbial-mediated nutrient transformation mechanisms is limited.
5. Conclusion
This study systematically investigated the spatial distribution characteristics of nitrogen and phosphorus nutrients in the upper waters of the northwest Indian Ocean during the dry season, clarified their concentration ranges, horizontal and vertical distribution patterns, and analyzed the key factors regulating nutrient distribution. The results showed that in terms of horizontal distribution, PO43--P concentrations were higher in the southern waters near the equator and lower in the northern waters; NO3--N and DIN showed an opposite pattern with higher concentrations in the north and lower in the south; NO2--N content was higher in the northern high-latitude waters; and NH4+-N had no obvious spatial distribution pattern. Vertically, PO43--P, NO3--N and DIN all exhibited low concentrations above 100 m, and increased with depth with significant stratification below 100 m. A subsurface maximum of nitrite nitrogen occurred at the 70 m water layer, while NH4+-N was uniformly distributed in the upper waters. The nutrient distribution in the study area was jointly regulated by physical and biological processes: phytoplankton uptake led to nutrient depletion in the surface layer, and microbial mineralization and oxidation promoted nutrient enrichment in the middle and deep layers; monsoon-driven water mass movement, equatorial ocean currents, and upwelling induced by cyclonic disturbances dominated nutrient transport and supplementation, and water column stratification further exacerbated the vertical differentiation of nutrients. The results of this study enrich the basic data of nutrients in the northwest Indian Ocean during the dry season and provide scientific support for understanding the biogeochemical processes and fishery resource management in this sea area.
Acknowledgements
This work was supported by the Program on the Survey of Pelagic Fishery Resources sponsored by the Ministry of Agriculture and Rural Affairs (Project No.3442L2024) and the Program on the Survey, Monitoring and Assessment of Global Fishery Resources (Comprehensive scientific survey of fisheries resources at the high seas), sponsored by the Ministry of Agriculture and Rural Affairs (Project No.3330HX2023).
CRediT authorship contribution statement
Conceptualization: Lei Li. Methodology: Ziniu Li, Lei Li. Formal Analysis: Longyu Liu. Investigation: Haopeng Hu, Lingzhi Li, Chao Li, Shuai Han, Fengbiao Wang. Resources: Zhi Zhu, Yingjie Zheng, Jinmeng Bao, Mei Jiang. Writing – original draft: Yuan Wang, Haopeng Hu. Writing – review & editing: Ruohan Zhou, Ying Wang, Longyu Liu, Lei Li, Yiyun Zhang, Yanming Sui. Visualization: Yuan Wang, Haopeng Hu. Project administration: Hanfeng Zheng. Funding acquisition: Hanfeng Zheng, Lingzhi Li, Chao Li, Ziniu Li. Supervision: Ziniu Li, Lei Li.
Ethical conduct approval – IACUC
Not required for this research
Declaration of competing interest
The authors declare that they have no known competing financial interests or personal relationships that could have appeared to influence the work reported in this paper.
Data availability
Data will be made available on request.