
1. Introduction
Sarcocheilichthys sciistius (Abbott, 1901) is a small cyprinid distributed in Northern China, and its taxonomic validity and diagnostic morphology have recently been clarified.1 Because species-specific field data remain limited, practical monitoring tools are needed to support population surveys and captive-breeding management. Direct weighing of small fish in field settings is difficult because balances require calibration, fish may escape during handling, and prolonged manipulation can increase stress and post-capture mortality.2–4 Predicting body weight from linear morphometric traits, therefore, offers a low-equipment, morphometric-based alternative for field monitoring.
Grey relational analysis (GRA)5 and path analysis6 are widely used to identify morphometric predictors of body weight in aquatic species. GRA ranks trait associations without requiring strict parametric assumptions,7,8 while path analysis separates direct from indirect effects and helps reduce the interpretive bias caused by highly correlated body measurements.9,10 Together they have identified key weight predictors in several species, including silver pomfret (Pampus argenteus),11 largemouth bass (Micropterus salmoides),12 and common carp.9 Combined GRA-path analysis approaches can improve interpretability and robustness compared with single-method screening because they test both overall association strength and direct contribution to body weight,13,14 but they have rarely been applied to small non-commercial freshwater fishes that require conservation-relevant monitoring tools.
Most morphometric studies still rely on a single analytical method, which gives an incomplete picture of trait-weight relationships. Correlation analysis or GRA can rank trait associations but cannot disentangle direct from indirect effects due to multicollinearity; path analysis and regression address this limitation but still provide only a static representation when used alone.9,10 Few studies test whether these relationships shift during growth12,15 or compare alternative functional forms beyond the default linear model,16 even though the allometric basis of morphometric-weight scaling is well established.17,18 For S. sciistius and other small freshwater fishes, an integrated morphometric-weight prediction framework has not yet been developed.
The specific objectives of this study were to: (1) identify the strongest morphometric predictors of body weight through combined correlation, GRA, and path analysis for S. sciistius; and (2) test their ontogenetic stability and optimal curve-fitting forms.
2. Materials and Methods
2.1. Experimental Materials
Wild Sarcocheilichthys sciistius specimens were collected from the upper reaches of the Huaihe River main stem in Henan Province, China (33°15′-33°45′N, 113°20′-114°10′E) in May 2025. Fish were captured using gill nets with a mesh size of 1.5 cm. Following capture, the specimens were immediately transferred to aerated containers filled with river water and transported to the laboratory within two hours to minimize transport stress. A total of 104 intact individuals were subsequently selected for morphometric analysis. The sampling design was restricted to one river reach and one season; therefore, the dataset was intended for model development within the sampled population rather than for immediate extrapolation to all populations or seasons. Prior to measurement, specimens were immersed in buffered MS-222 (tricaine methanesulfonate, 60 mg/L) for approximately 2 min until loss of equilibrium and no response to gentle tactile stimulation were observed. Measurements were performed only after deep anesthesia was confirmed, in accordance with the approved animal ethics protocol.
2.2. Morphological traits measurement
Ten traits were quantified for each S. sciistius individual: total length (TL), standard length (SL), head length (HL), body depth (BD), head depth (HD), snout length (SnL), eye diameter (ED), caudal peduncle length (CPL), caudal peduncle depth (CPD), and body weight (BW). Linear measurements were conducted following standard ichthyological protocols: TL (snout tip to the posterior margin of the caudal fin), SL (snout tip to the base of the caudal fin), HL (snout tip to the posterior margin of the operculum), BD (highest dorsal point to the ventral midline), HD (highest point of the head to the ventral midline), ED (distance between the anterior and posterior margins of the eye orbit), CPL (vertical line from the posterior end of the anal fin base to the caudal fin base), and CPD (minimum vertical depth of the caudal peduncle). The nine linear morphometric traits were measured on the left side of each fish using IP54 digital vernier calipers (Syntek, China) with an accuracy of 0.01 mm. Calipers and the electronic balance were zero-calibrated before each measurement session. Each linear trait was measured twice by the same trained observer; if the two readings differed by more than 0.02 cm, a third measurement was taken and the mean of the closest two readings was used. Body weight was determined using a precision electronic balance (accuracy 0.01 g) after carefully removing excess surface moisture.
2.3. Data analysis
2.3.1. Descriptive statistics and correlation analysis
Descriptive statistics, including mean and standard deviation (SD), were computed for all morphometric traits using SPSS 20.0 (IBM Corp., Armonk, NY, USA). The coefficient of variation (CV) for each trait was calculated as CV = (SD / mean) ×100%. Pearson correlation coefficients were calculated for all pairwise combinations of the nine morphometric traits and body weight to assess the direction and strength of linear associations. The significance of each correlation coefficient was evaluated against the null hypothesis of no association using a two-tailed Student’s t-test.
2.3.2. Path analysis and multiple regression
Pearson correlation and path analyses were conducted to examine the relationships among the morphometric variables and body weight. Direct path coefficients were derived following the methodology described by Du and Chen (2010).10 Determination coefficients were computed using the following equations:
di=P2i
dij=2rijPiPj
where dᵢ represents the direct determination of the ith trait on body weight, dij denotes the correlated determination of the ith trait on body weight through the jth trait (j ≠ i), Pi and Pj are path coefficients of the ith and jth traits on body weight, respectively, and rij is the correlation coefficient between the ith and jth traits.
Multiple regression analysis was employed to identify morphological predictors of body weight, with non-significant variables systematically eliminated. Statistical significance was assessed using Student’s t-test at α = 0.05. The final multiple regression model for body weight (Y) was expressed as:
Y=a+b1X1+b2X2+b3X3+…+biXi
where Y is the dependent variable (body weight), a is the intercept, Xi represents independent morphological variables, and bᵢ denotes partial regression coefficients.
2.3.3. Grey relational analysis
Based on grey system theory (Deng, 1982),5 body weight and nine morphological traits were selected as components of a grey system. Body weight served as the reference sequence (X0), while the nine morphological traits constituted the comparison sequences (Xi, i = 1, 2, 3, …, 9).
Given the dimensional heterogeneity among morphological variables, raw data were subjected to linear normalization as a preliminary step. Data preprocessing was performed using the following standardization equation:
X′i(k)=Xi(k)−¯Xiσ
Where represents the standardized value, k denotes the sample number, is the original measurement of the ith morphological trait, is the mean value of σ is the standard deviation of and i represents the trait index (i = 1 to 9).
Subsequently, the grey relational coefficient (ξᵢₖ) was computed as:
ξi(k)=minΔi(k)+ρmaxΔi(k)Δi(k)+ρmaxΔi(k)
where quantifies the relational degree between reference and comparison sequences; is the absolute values between reference sequence and comparison sequences, and are the minimum and the maximum value of the second level respectively; ρ is the distinguishing coefficient (ρ = 0.5).
Finally, the grey relational grade ) was calculated as:
ri=1nn∑kξi(k)
where represents the comprehensive relational grade for the ith morphological trait, and n is the total number of samples.
2.3.4. Size-stratified ontogenetic analysis
To investigate whether the relationships between morphometric traits and body weight change during ontogeny, the 104 specimens were stratified by total length (TL) using a median split, dividing the sample into small (TL < 8.63 cm; BW: 0.83-8.79 g, n = 52) and large (TL ≥ 8.63 cm; BW: 3.68-25.91 g, n = 52) size classes. The median split was selected a priori because it produced two balanced groups with equal sample sizes and preserved statistical power for within-group regression. A frequency distribution-based grouping was not used because the observed TL distribution did not show a clear natural break and would have generated uneven bins with small sample sizes. Within each size group, allometric growth equations (BW = a × Xb) were fitted for each morphological trait using log-transformed ordinary least squares regression. Pearson correlation coefficients between each morphometric trait and body weight were computed and ranked within each size class to identify ontogenetic shifts in trait importance. The changes in allometric coefficients (Δb = b_large - b_small) were calculated to quantify the direction and magnitude of ontogenetic allometric shifts.
2.3.5. Allometric growth analysis
Allometric growth equations were established to quantify the scaling relationships between each morphometric trait (X) and body weight (BW) using the power function:
BW=a×Xb∗
where a is the scaling coefficient (intercept) and b is the allometric growth coefficient (slope). Both variables were logarithmically transformed (natural logarithm) to linearize the relationship:
ln(BW)=ln(a)+b×ln(X)∗
The parameters ln(a) and b were estimated using ordinary least squares (OLS) linear regression. The goodness of fit for each model was evaluated by the coefficient of determination (R²).
To assess whether the growth of each morphological trait relative to body weight followed isometric or allometric patterns, a two-tailed Student’s t-test was performed against the null hypothesis of isometry (H₀: b = 3). The test statistic was calculated as:
t=(b−3)/SE(b)
where SE(b) is the standard error of the allometric coefficient b. The 95% confidence intervals (CI) for b were computed as:
CIhh%=b±t0⋅05(2),n−2×SE(b)
For linear morphometric traits measured in centimeters versus body weight measured in grams, an isometric relationship (b = 3) indicates that the trait grows in proportion to body volume (the cube of linear dimensions), consistent with geometric similarity. Significant deviation from b = 3 indicates either positive allometry (b > 3; the trait grows at a proportionally faster rate relative to body weight increase) or negative allometry (b < 3; the trait grows at a proportionally slower rate relative to body weight increase). Statistical significance was set at α = 0.05. Additionally, the classic length–weight relationship (LWR) was specifically examined using total length (TL) as the independent variable, following the standard form BW = a × TL^b, which serves as a fundamental reference for fisheries stock assessment. All allometric analyses were conducted using Python with NumPy (version 1.26) and custom ordinary least squares regression routines.
2.3.6. Curve fitting analysis
To further elucidate the functional relationships between the key morphometric predictors, specifically total length (TL) and caudal peduncle depth (CPD), and body weight (BW), six mathematical growth models were fitted and compared:
Linear: Y = b0 + b1X
Logarithmic: Y = b0 + b1ln(X)
Quadratic: Y = b0 + b1X + b2X2
Power: Y = b0Xb1
S-curve: Y = e^(b0 + b1/X)
Exponential: Y = b0e^(b1X)
Model parameters were estimated using the ordinary least squares (OLS) method. The goodness-of-fit for each model was evaluated based on the coefficient of determination (R²), F-test statistics, and the significance of regression coefficients (p-values). The model with the highest R² and p < 0.05 was reported as the statistical best fit. When the R² difference between models was small (<0.01), biological interpretability and parsimony were also considered, particularly for power models that match the allometric equation BW = a × Xb.
3. Results
3.1. Descriptive statistics of morphometric traits and body weight
Body weight of the 104 S. sciistius specimens ranged from 0.83 to 25.91 g, with a mean of 8.17± 3.38 g (Table 1). Head length (HL) and eye diameter (ED) had the lowest coefficients of variation (CV = 17.20% and 17.50%), indicating stable cephalic morphology. Snout length (SnL) was the most variable linear trait (CV = 29.73%). Body weight showed the highest overall dispersion (CV = 41.37%).
3.2. Correlation analysis between morphological traits and body weight
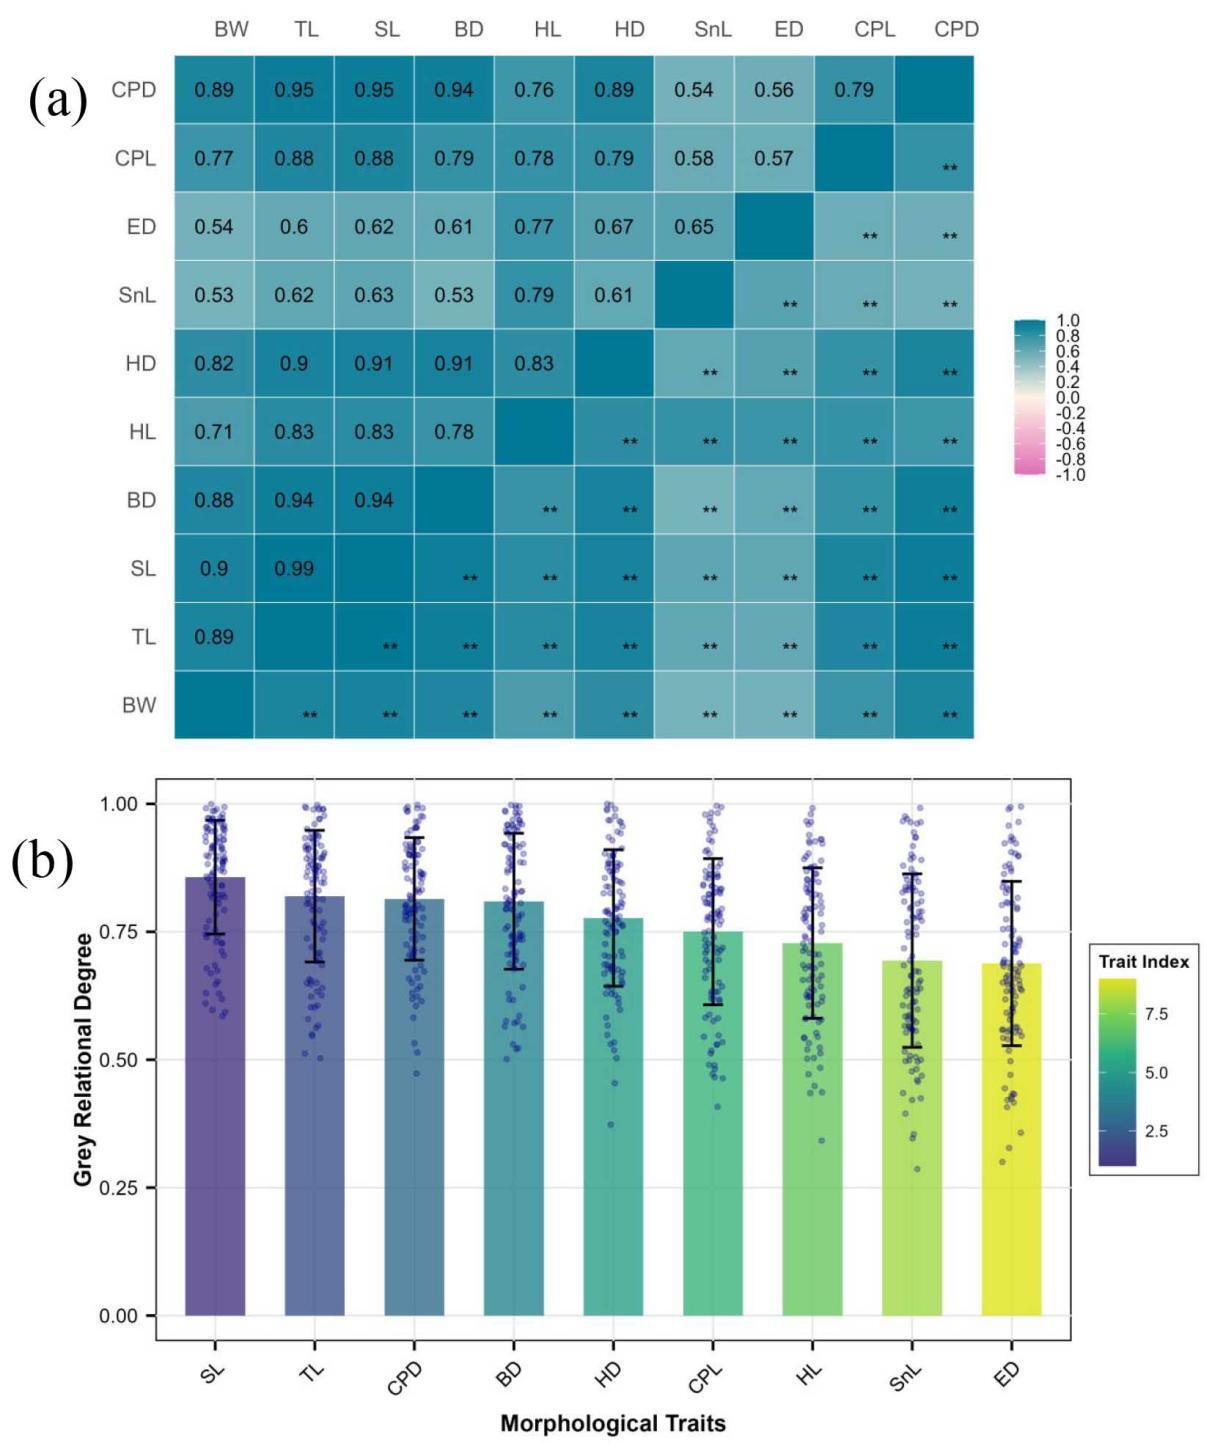
All nine morphometric traits showed positive correlations with body weight (p < 0.01), with coefficients from 0.53 to 0.90 (Figure 1a). Ranked by correlation strength: SL (0.90) > CPD (0.89) = TL (0.89) > BD (0.88) > HD (0.82) > CPL (0.77) > HL (0.71) > ED (0.54) > SnL (0.53). Standard length had the strongest linear association with body weight; snout length was the weakest.
3.3. Grey relational analysis of morphometric traits on body weight
Grey relational grades between the nine traits and body weight are shown as raincloud plots in Figure 1b. Grades ranged from 0.728 to 0.857. Consistent with the correlation results, standard length (SL) had the highest grade (0.857), followed by TL, CPD, BD, HD, HL, CPL, SnL, and ED.
3.4. Path analysis and determination coefficients of morphometric traits on body weight
Multicollinearity diagnostics showed variance inflation factors (VIF) > 10 for standard length (SL) and caudal peduncle depth (CPD), indicating severe multicollinearity. After excluding SL to stabilize the model, path analysis identified TL and CPD as the strongest predictors of body weight (Table 2). Caudal peduncle depth had the largest direct path coefficient (0.519), ahead of total length (0.396). TL had a substantial indirect effect on body weight (0.491), acting mainly through its correlation with CPD. Determination coefficient analysis (Supplementary Table S1) showed direct determination coefficients for CPD and TL of 0.269 and 0.157, respectively. The total determination coefficients were 0.659 for CPD and 0.389 for TL, indicating a greater statistical contribution of CPD within this path model. The combined determination coefficient (R²) for both traits was 0.816.
3.5. Allometric growth analysis
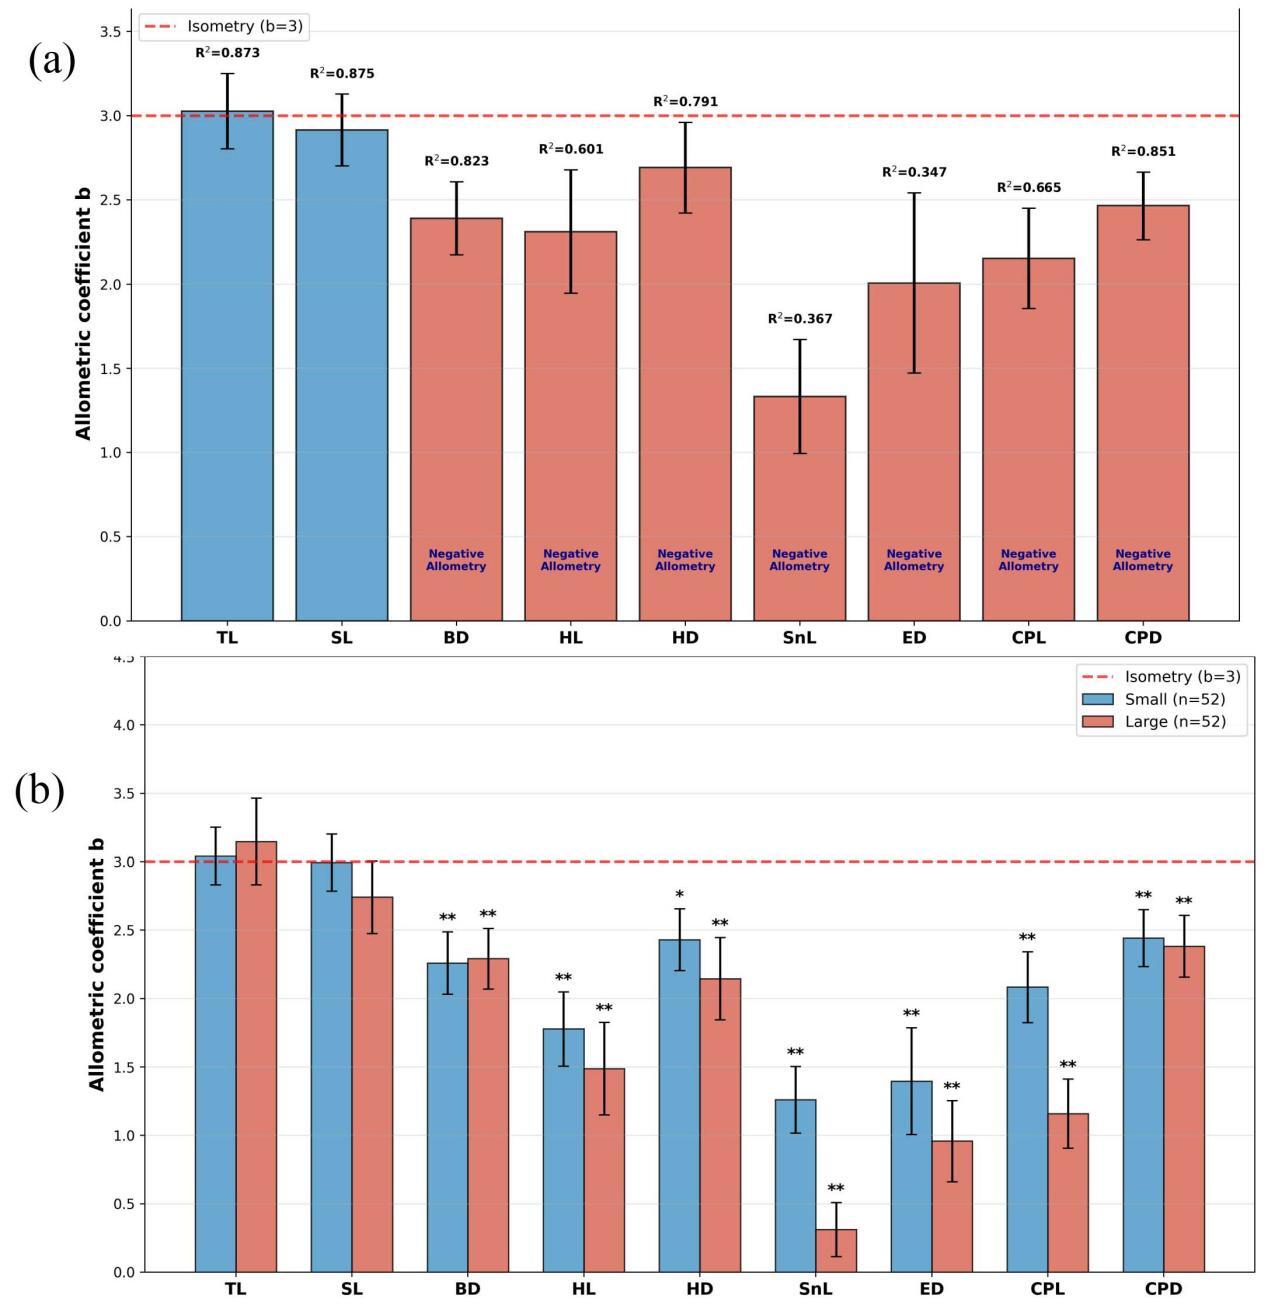
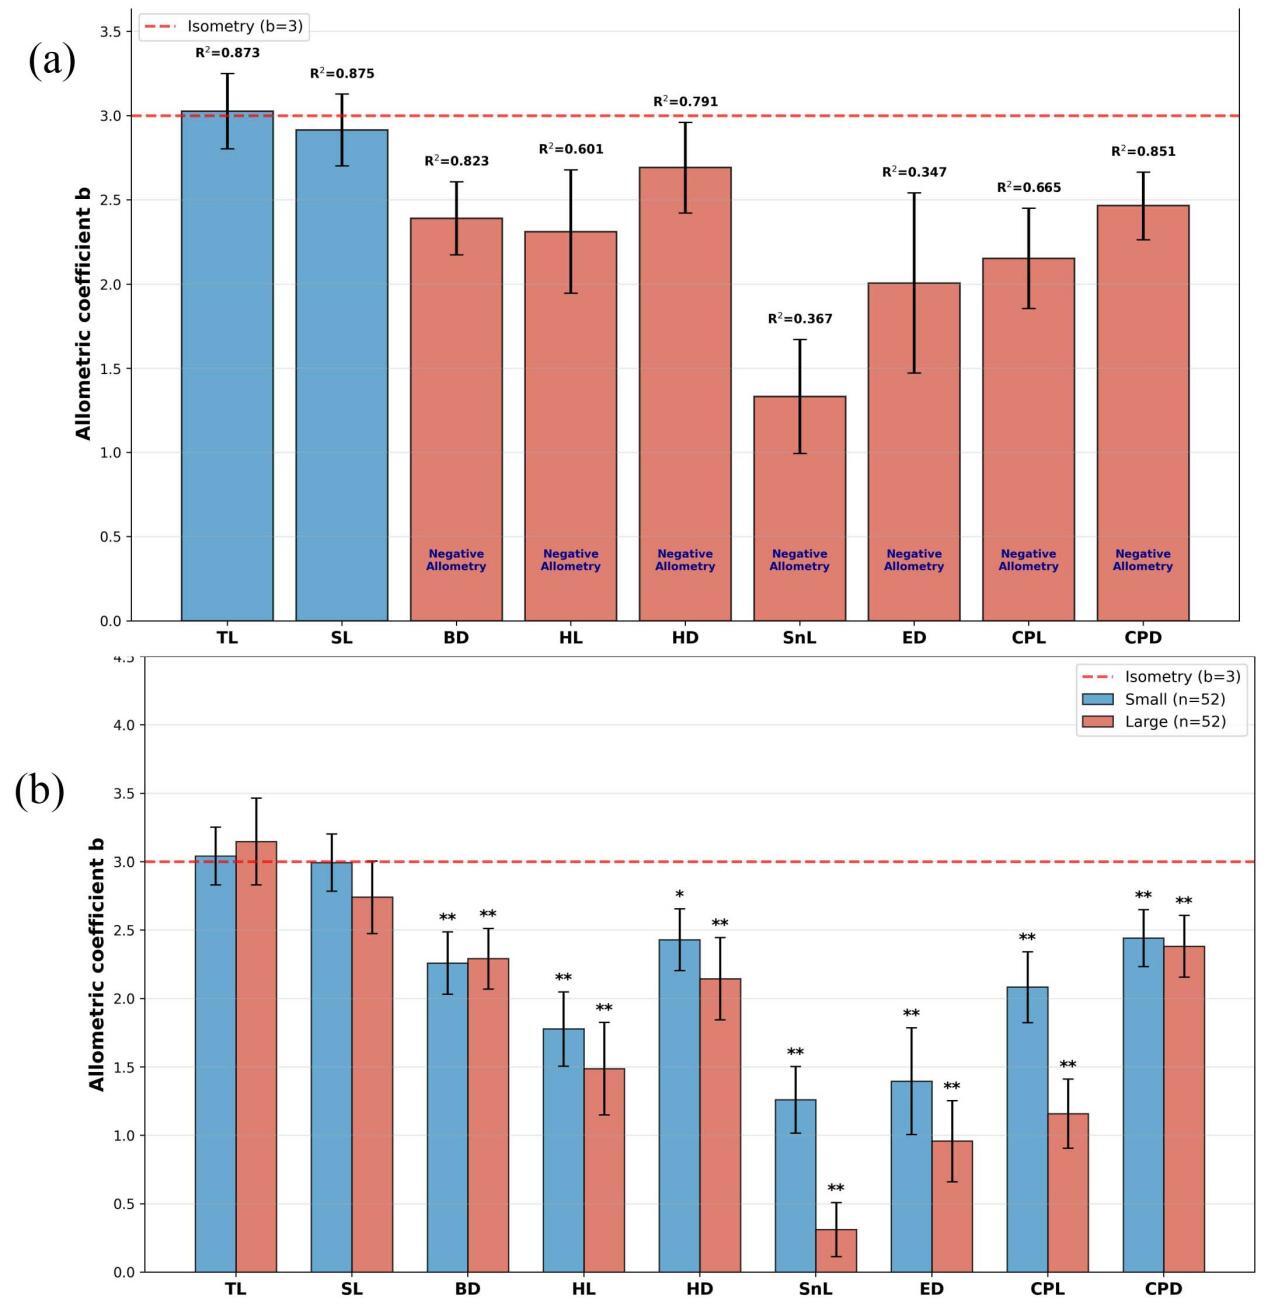
Allometric coefficients (b) for the traits relative to body weight ranged from 1.333 to 3.027 (Figure 2a). Axial traits TL (b = 3.027, p = 0.814) and SL (b = 2.915, p = 0.438) grew isometrically (b ~= 3), meaning axial scaling follows the geometric cube law. The other seven traits all showed negative allometry (b < 3, p < 0.05). Transverse dimensions such as CPD (R² = 0.851) and BD (R² = 0.823) maintained strong predictive accuracy despite negative allometric scaling. Cephalic traits SnL (b = 1.333, R² = 0.367) and ED (b = 2.007, R² = 0.347) showed the strongest negative allometry and lowest predictive reliability. These results point to a hierarchical growth strategy: axial dimensions stay isometric, transverse dimensions show stable negative allometry, and cephalic traits are highly conservative.
3.6. Size-stratified ontogenetic analysis
Size-stratified allometric analysis showed that the main predictive traits were generally stable across size classes (Figure 2b). TL and SL maintained isometric growth in both small and large individuals, while CPD remained highly stable, with only a minor change in allometric coefficient (b = 2.443 vs. 2.383; Δb = -0.059) and consistently high explanatory power in both groups (R² = 0.733 and 0.690, respectively). In contrast, cephalic traits showed clear ontogenetic weakening, especially SnL, whose allometric coefficient decreased from 1.261 to 0.312 (Δb = -0.949), with R² falling to 0.047 in large individuals. These results suggest that CPD maintained comparatively stable predictive performance across the studied size classes, whereas cephalic traits showed weaker associations with body weight as size increased.
3.7. Multiple regression analysis
Multiple regression analysis identified two morphometric traits (CPD and TL) with significant partial regression coefficients for body weight (p < 0.01; Table 3; Supplementary Table S2). The best model was: BW = -12.543 + 12.156 × CPD + 1.159 × TL (R² = 0.812, p < 0.01). The model accounted for 81.2% of the variation in body weight in this sample.
3.8. Curve fitting of key morphometric traits
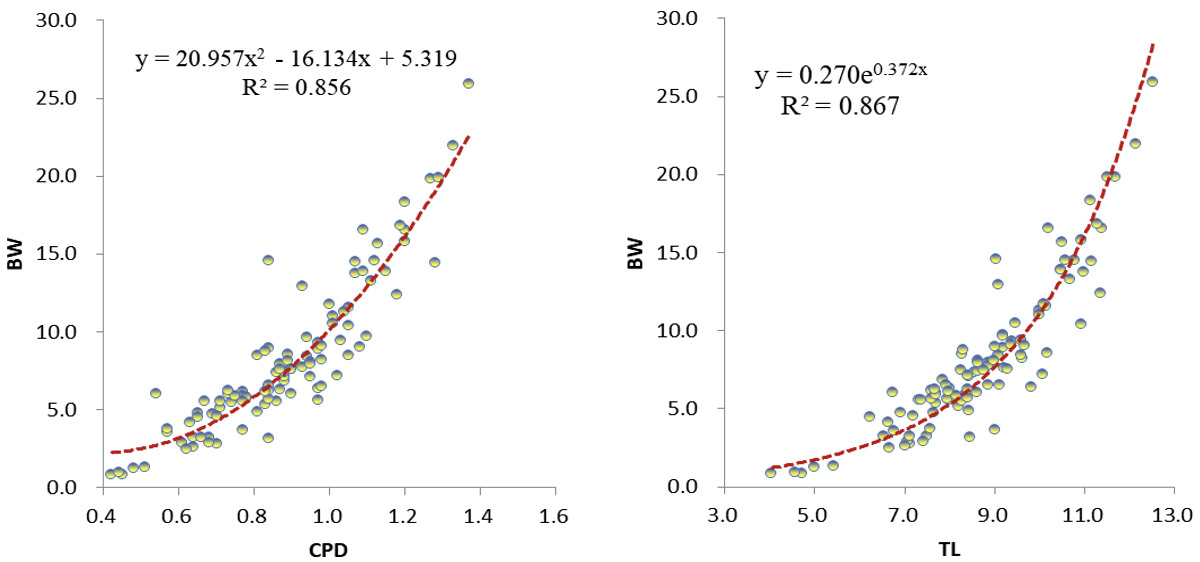
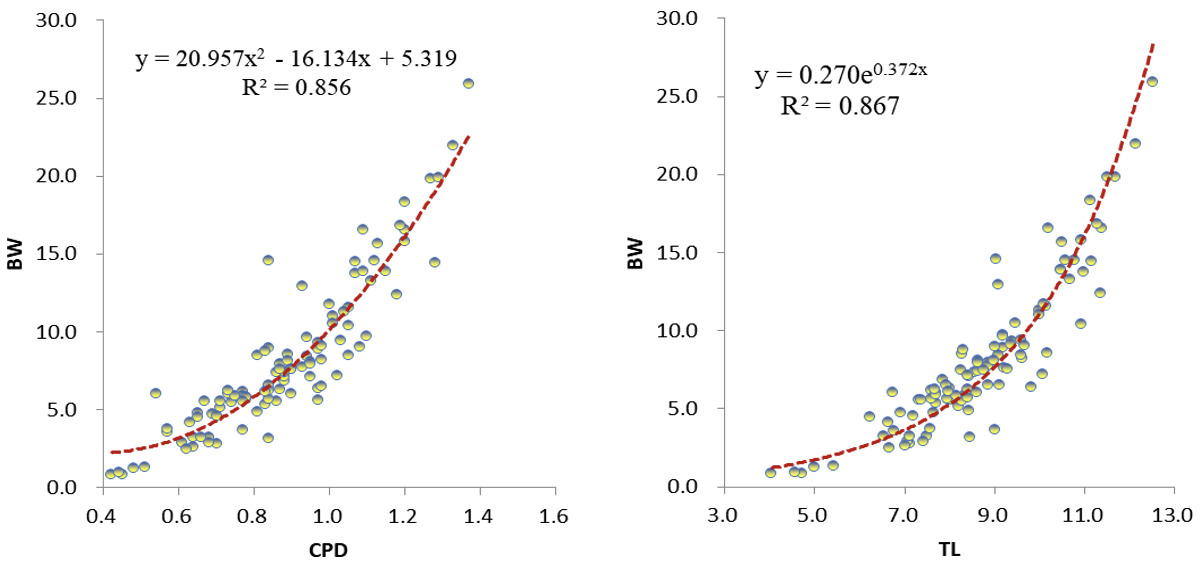
To define the functional relationship between the retained predictors (CPD, TL) and body weight, we evaluated six mathematical models (Supplementary Table S3). For CPD, the quadratic model gave the highest R² (R² = 0.856, F = 300.57, p < 0.001), closely followed by the power model (R² = 0.850, F = 583.37, p < 0.001) and the S-curve (R² = 0.846) (Figure 3). The R² advantage of the quadratic model over the power model was small (0.006), indicating that both models described the CPD-BW relationship well. For TL, the exponential model had the highest R² (R² = 0.867, F = 579.515, p < 0.001) (Figure 3), closely followed by the power model (R² = 0.865, F = 703.97, p < 0.001). Thus, the statistical best-fit models were quadratic for CPD and exponential for TL, whereas the power models were retained as biologically interpretable near-best alternatives consistent with allometric scaling.
4. Discussion
The multi-method framework, combining GRA, path analysis, allometric scaling, curve fitting, and ontogenetic stratification, identified caudal peduncle depth (CPD) and total length (TL) as the primary morphometric predictors of body weight in S. sciistius. The statistical best-fit curves were quadratic for CPD and exponential for TL, while power models produced near-equivalent fits (R² > 0.85) and retained the clearest biological interpretation under allometric theory. Size-stratified analysis suggested that transverse body dimensions remained comparatively stable predictors across the studied size classes. These results provide a candidate morphometric-based approach to weight estimation for monitoring within the sampled population.
In the path model, CPD had the largest direct path coefficient (0.519), exceeding that of TL (0.396). In contrast, GRA ranked SL and TL ahead of CPD; this difference reflects the distinct quantities summarized by the two analyses. A possible functional explanation involves fish locomotory biomechanics. Caudal-peduncle morphology is associated with force transmission to the caudal fin and may influence hydrodynamic performance.19,20 Nauen and Lauder20 showed that peduncle morphology influences vorticity control and propulsive efficiency. Flammang et al.21 confirmed, using robotic models, that peduncle stiffness and cross-sectional geometry modulate swimming performance. Fisher and Hogan22 similarly found that caudal peduncle depth was among the strongest predictors of swimming speed in coral reef fishes. Accordingly, the observed CPD association is biologically plausible, although its functional mechanism was not tested in this study.
The dominant role of CPD contrasts with findings for several economically important species, underlining the species-specific nature of morphometric–weight relationships. In silver pomfret (Pampus argenteus), Zhang et al.11 identified body depth and standard length as the primary determinants, reflecting its deep-bodied morphology. Qi et al.23 found that internal organ masses best predicted body weight in Ussuri catfish (Pseudobagrus ussuriensis), whereas Liu et al.13 reported that body length dominated weight determination in Exopalaemon modestus. These differences indicate that key weight predictors depend on body plan, locomotor strategy, and ecological niche.11,13,24,25 In S. sciistius, a deeper caudal peduncle may reflect greater lateral muscle mass and more effective force transmission to the caudal fin, supporting station-holding and burst swimming in flowing habitats.19–22 Because these functions may be associated with muscular development and foraging performance, CPD may covary more closely with body weight than cephalic traits. Its prominence therefore provides a plausible basis for prioritizing CPD in population-specific weight-prediction models, pending external validation.
Allometric growth analysis clarified the scaling relationships underlying the path-analysis results. Total length (b = 3.027, p = 0.814) and standard length (b = 2.915, p = 0.438) grew isometrically relative to body weight, consistent with axial dimensions scaling with body volume according to the cube law. The length-weight relationship BW = 0.0104 × TL^3.027 (R2 = 0.873) falls within the typical range for small cyprinids. Isometric axial scaling like this has been widely reported across teleost taxa.21,26
The other seven traits all showed negative allometry (b < 3, p < 0.05). The most extreme was snout length (b = 1.333, R2 = 0.367), followed by eye diameter (b = 2.007, R2 = 0.347). This pattern is consistent with early maturation of cephalic structures: sensory and feeding apparatuses differentiate early and then grow more slowly than the rest of the body.17,27 Zelditch and Fink27 showed that cranial shape in Pygocentrus nattereri undergoes rapid early differentiation followed by relative stasis, with head dimensions decoupling from body size. Rodríguez-Mendoza et al.28 reported similar negative allometry in bluemouth head (Helicolenus dactylopterus) length and eye diameter (b = 1.8-2.1). Among transverse traits, CPD retained strong predictive power (R2 = 0.851) despite its own negative allometry (b = 2.466, 95% CI: 2.263-2.668).
Size-stratified analysis showed different stability patterns across trait categories. Axial traits maintained isometric growth in both size classes (p > 0.05). Transverse dimensions were remarkably stable: CPD shifted only slightly (Db = -0.061), body depth barely changed (Db = +0.041), and CPD determination coefficients stayed high in both small (R2 = 0.729) and large (R2 = 0.696) groups across a weight range of 0.83-25.91 g. This pattern may be consistent with developmental integration,27 where functionally coupled traits maintain coordinated growth. Meyer26 similarly found that functionally integrated cichlid traits had more stable allometry than independent ones. Cephalic traits dropped off sharply: snout length went from b = 1.332 to b = 0.340 (Db = -0.992), with R2 falling to 0.060, meaning these traits essentially dissociated from weight in larger fish. Cephalic traits should be used with caution in predictive models, since their contribution depends on body size.28 The observed stability of transverse traits suggests that a single CPD + TL model may be useful across the sampled size range; independent validation is needed before omitting stage-specific calibration.
Curve fitting supported the allometric basis of these relationships. The power model gave near-highest R2 for both CPD (0.850) and TL (0.865) while providing the most biologically interpretable form, matching the allometric equation BW = a × Xᵇ. The quadratic model was marginally better for CPD (0.856 vs. 0.850) but at the cost of an extra parameter with little real improvement. The linear model, still the default in many morphometric studies,11,23 consistently performed worse, explaining 3.5-7.0% less variance. This illustrates why it is useful to test alternative functional forms rather than assuming linearity.16 Agreement among these complementary analyses, all applied to the same dataset, provides internal consistency but does not replace external validation.
Beyond methodology, this study may have conservation relevance for S. sciistius. For this small cyprinid, this approach may be useful for monitoring. Direct weight measurement in the field is not straightforward: balances need calibration, escape behavior reduces accuracy, and handling stress increases mortality, especially in small species with delicate scales.4 The model BW = -12.543 + 12.156 × CPD + 1.159 × TL (R2 = 0.812, p < 0.001) provides a morphometric-based alternative using two easily measured linear traits. The size-stratified results suggest that it may be applied across the sampled size range. Morphometric-based approaches are increasingly recommended for threatened fishes where handling stress must be minimized.29
Although this study provides useful morphometric predictors within the sampled material, the geographic and temporal scope is the main limitation. All specimens were collected from a single reach of the upper Huaihe River in May 2025, so the model should be regarded as a population- and season-specific baseline until it is validated across additional river sections, seasons, and age classes. Environmental conditions, local genetic structure, and seasonal feeding status may all influence morphometric-weight relationships.12,30 Furthermore, while the total sample size (N = 104) supported estimation of the main model, size-stratified subgroups (n = 52) limited the statistical power to detect subtle ontogenetic shifts. Beyond sampling constraints, the current framework did not integrate biological variables such as sex-specific differences,15,23 nor ecological factors such as temperature and food availability.16,31,32 The cumulative effect of these unassessed variables likely accounts for the unexplained weight variance (19%; 1 - R2 = 0.188). Future work should therefore test the CPD + TL model across multiple populations and seasons before broad application in regional conservation monitoring.
5. Conclusion
This study shows that a multi-method morphometric approach combining GRA, path analysis, allometric scaling, curve fitting, and ontogenetic stratification can provide reliable and biologically interpretable body weight predictions for S. sciistius. The convergence of complementary analyses supports CPD and TL as key weight predictors, and their stability across the sampled size range suggests that they may support population-specific field monitoring after appropriate validation. More broadly, this work shows that analytical tools developed for aquaculture breeding can also serve conservation-relevant research on non-commercial freshwater fishes, extending morphometric analysis beyond its traditional economic applications.
Acknowledgments
This work was supported by the Natural Science Foundation of Henan (Grant Nos. 252300420726 and 252300421681); the Henan Province Science and Technology Tackling Projects (Grant Nos.252102110075 and 252102321036); the Investigation of Aquatic Biodiversity and Environmental Conditions in Key Waters of Henan Province project; and the Doctoral Research Start-up Fund of Xinyang Agriculture and Forestry University (Grant No. 203129).
Author Contributions
Conceptualization: Gaoyou Yao (Equal), Chenxi Ju (Equal). Methodology: Gaoyou Yao (Equal), Zhiguo Hu (Equal), Chenxi Ju (Equal). Formal Analysis: Gaoyou Yao (Equal), Zhiguo Hu (Equal), Chenxi Ju (Equal). Investigation: Gaoyou Yao (Equal), Zhiguo Hu (Equal), Jiahui Liu (Equal), Yuyuan Wu (Equal), Xusheng Guo (Equal), Shijie Yang (Equal), Mengfan Meng (Equal), Yuanye Ma (Equal). Data curation: Gaoyou Yao (Equal), Zhiguo Hu (Equal), Yuyuan Wu (Equal). Writing – original draft: Gaoyou Yao (Lead). Resources: Hua Zhang (Equal), Bing Li (Equal). Supervision: Hua Zhang (Equal), Chenxi Ju (Equal). Writing – review & editing: Chenxi Ju (Lead). Funding acquisition: Chenxi Ju (Lead).
Ethical Conduct Approval – IACUC
All experimental procedures were reviewed and approved by the Animal Ethics Committee of Xinyang Agriculture and Forestry University. The study was conducted in accordance with the Guidelines for the Care and Use of Laboratory Animals of China. All efforts were made to minimize animal suffering and the number of animals used.
Informed Consent Statement
All authors have approved the final version of the manuscript for publication.
Data Availability
The raw morphometric measurements and analysis code used in this study are available from the corresponding author upon reasonable request.
Competing Interests
The authors declare no competing interests.