
_of_the_relationships_between_sh__sl__sw_and_tww_of_.tiff)
Introduction
The translocation of marine bivalve species represents a critical area of investigation in aquaculture and marine ecosystem management, particularly for economically significant species such as the Portuguese oyster Crassostrea angulata.1 Relocating or transplanting oysters serves multiple purposes, primarily to enhance their quality, safety, and market value. One common practice involves moving them from seed beds with suboptimal conditions to areas with better growth opportunities, such as higher food availability and suitable salinities.2 This shift, often from upriver to downriver regions, promotes faster growth, quicker attainment of market size, and improved meat quality.3 Furthermore, relocating them to environments that promote fattening yields plumper, more flavorful meat, thereby increasing their market value and consumer appeal.4 Beyond commercial purposes, relocation supports restoration efforts by replenishing depleted populations.5 Transferring oysters to areas where they have declined helps establish self-sustaining populations, contributing to ecosystem recovery. Relocation also addresses food safety concerns, as oysters can be transferred to cleaner waters for depuration.6–8 Overall, the practice of relocating oysters plays a vital role in aquaculture and conservation, balancing goals of productivity, health, food safety, and environmental sustainability. However, the present study focused solely on survival, growth, and nutritional composition, not on pathogen reduction. Nutritional quality directly affects consumer acceptance and market value, making it a key endpoint for evaluating aquaculture sites.
Despite the overall benefits, the geographical relocation of adult oysters also presents multifaceted challenges, including physiological adaptation, environmental stress responses, and potential metabolic recalibration in novel ecological contexts.9 Previous studies have demonstrated the complex physiological mechanisms underlying bivalve species’ responses to environmental transitions, highlighting the critical importance of understanding adaptive potential in marine organisms.10–13 Preliminary investigations suggest that oysters exhibit complex stress response mechanisms during geographical relocation, which are intricately linked to cellular defense systems deployed by warm-adapted lineages to cope with thermal and environmental variability, potentially involving changes in digestive morphology, meat content, protein expression, cellular metabolism, phenotypic plasticity, and ion regulation pathways.14–16
In this study, Sanya and Wanning were selected because they differ in water exchange, terrestrial influence, and historical phytoplankton productivity. Sanya is an open-coast site with stronger tidal flushing and higher chlorophyll-a levels, while Wanning is more sheltered with greater freshwater influence. These pre-existing differences were expected to affect oyster growth and nutritional quality, making them suitable for a comparative transplant experiment. We hypothesized that the two sites would differ in oyster performance due to their distinct environmental conditions. Based on prior knowledge of Hainan’s coastal hydrography, we expected Sanya, with its more stable and productive waters, to support better survival, faster growth, and higher nutritional quality than Wanning. Thus, the primary objectives of this research were to (1) assess survival rates and (2) characterize the biometrical and nutritional traits of adult oysters after inter-regional translocation. The transition from the coastal aquaculture zones of Guangxi to the two island ecosystems of Hainan presents a unique experimental model for understanding bivalve resilience and adaptive mechanisms.
This research contributes critical insights into marine species translocation strategies, with broad implications for aquaculture management, conservation efforts, and understanding climate-induced ecological transitions. By comprehensively documenting the physiological responses of C. angulata during inter-regional transplantation, we aim to develop more nuanced methodological approaches for studies of marine species relocation and ecosystem adaptation.
Materials and Methods
Material collection and overview of the study area
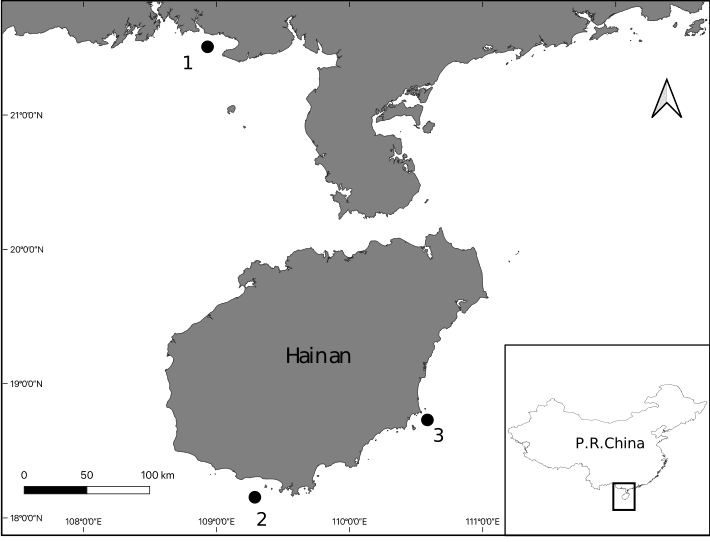
A total of 3000 one-year-old C. angulata triploid oysters were collected from Beihai culture grounds (Guangxi Province) and transferred to two aquaculture grounds, Sanya and Wanning, on Hainan Island (Figure 1). Oysters were transported and ferried overnight to Hainan inside Styrofoam cooler boxes in slightly wet conditions. On arrival, boxes were immediately placed in the boat and at the new culture grounds. Shell length (SL), shell width (SW), shell height (SH) and total wet weight (TWW) of the oyster were recorded.
_beihai__or.svg)
Due to logistical constraints (limited holding capacity at Wanning site), we deployed 1500 oysters (10.82 ± 1.12 cm, SL; 6.19 ± 0.91 cm, SW; 3.90 ± 0.56 cm, SH; and 127.04 ± 33.30 g, TWW) in Sanya, and 1000 in Wanning (10.30 ± 0.95 cm, SL; 6.20 ± 0.62 cm, SW; 4.20 ± 0.51 cm, SH; 123.53 ± 25.97 g, TWW). In the location (Figure 1), oysters were cultured hanging from a raft that is commonly used for marine fish aquaculture. Oysters were cleaned of debris and fouling and placed inside lantern nets. Environmental parameters were not recorded, and hence, site comparisons are descriptive.
Sample processing
The adult oysters were packed and transported from their place of origin in expanded polystyrene (EPS) foam boxes. Sufficient ice packs were placed inside the boxes, and the oysters were covered with seawater-soaked towels to maintain temperature and humidity during transit. All oysters were delivered to the experimental temporary holding sea area within one day, repackaged into suspension cages, and suspended at a depth of 3 meters at the designated experimental site.
The experimental period lasted 75 days. Random sampling was performed a total of 9 times on the 0, 7th, 15th, 25th, 35th, 45th, 55th, 65th, and 75th day. At each sampling day, the survival rate, main biometric traits, condition index, and basic nutritional components were measured. At each sampling time, 50 live oysters were randomly selected from the surviving population in each location. Oysters that had died were removed and counted prior to sampling, and the selection was made from the remaining live individuals to ensure that only healthy, living oysters were used for biometric and nutritional measurements. The same packing method, with ice packs and seawater-soaked towels, was used for transport to the laboratory within 1 day. Before data collection, any fouling on the oyster shells was removed, and the shell surfaces were cleaned and weighed. Sterile oyster knives were used to open the oysters, and the soft tissues were extracted and placed in centrifuge tubes. The samples were then stored in an ultra-low temperature freezer at -80°C for future use.
Survival rate
Survival rates were calculated as percentages of the initial number per site, and all statistical models included ‘location’ as a fixed factor to account for unequal group sizes. At each sampling time, the total number of experimental oysters was counted. Dead oysters were removed, and the number of deaths was recorded. The survival rate percentage was further calculated by dividing the number of oysters alive by the initial number of oysters at day 0, multiplied by 100.
SR=(No. of live oyster at the end of experimentNo. of oyster at the beginning of the experiment)×100
Biometric traits and condition index
The sampled oysters were measured for shell length (SL), shell width (SW), shell height (SH), and total wet weight (TWW). Oysters were opened afterward using an oyster knife, soft tissue and empty shells were then separated and weighed to get the wet weight of the soft tissue (STWW) and the wet weight of the empty shells (SsWW). The condition index (CI) of each sampled oyster was calculated using the equation CI = 100% × STWW / (TWW).
Nutritional components
The soft tissue of 5 oysters was placed in a petri dish and dried in a forced-air oven at 65°C for 24 hours to remove moisture. To ensure the tissue was completely dry, samples were weighed periodically until stabilization (indicating all water had been removed), and the dry weight of the soft tissue (STDW) was obtained. The moisture content (%) was calculated using the formula:
(STWW−STDW)/TWW×100%
The dried soft tissue was crushed separately into a powder using a grinder. Crude fat content was then measured using an automatic fat extraction device, following the Soxhlet extraction method as a standard procedure. Briefly, approximately 5 grams of freeze-dried, finely ground sample were accurately weighed and placed into a pre-dried, pre-weighed cellulose extraction thimble. The thimble was then inserted into the Soxhlet extractor, which was connected to a flask containing 150-200 mL of petroleum ether as the solvent. The apparatus was assembled and heated under reflux for 6 - 8 hours, allowing the solvent to continuously dissolve the sample and extract the fat. After extraction was complete, the solvent was removed by rotary evaporation, and the flask containing the extracted fat was dried in an oven at 105°C to remove any residual solvent. The flask was cooled in a desiccator and reweighed. The crude fat content (%) was calculated by dividing the mass of extracted fat by the initial sample mass and multiplying by 100.
For the crude protein content determination in oyster soft tissue, the Dumas method was employed. The 0.5-1.0 g sample of homogenized oyster soft tissue was weighed and placed into the combustion chamber of the nitrogen analyzer. The sample was combusted at 900 - 1000°C in the presence of excess oxygen. The nitrogen gas produced was then passed through a thermal conductivity detector (TCD), which measured its concentration. The protein content was calculated by multiplying the nitrogen value by a conversion factor of 6.25. The following formula was used to express the protein content as a percentage of the dry mass of the oyster sample:
(Protein content/Sample weight)×100
The crude ash content of the oyster’s soft tissue was measured using a gravimetric method. The dried samples (5 g each) were placed in a pre-weighed crucible and heated in a muffle furnace at 500-600 °C for 4-6 hours, allowing organic matter to oxidize, leaving only inorganic minerals (ash). After cooling the crucible in a desiccator to prevent moisture absorption, the crucible with ash residue was weighed. Ash content was calculated as a percentage of the original sample weight using the formula:
(Weight of ash residue/Initial sample weight)×100
Statistical analysis
The analysis was performed in triplicate for each sample to ensure accuracy and precision. Temporal trends in oyster survival, biometric traits, and soft body nutritional parameters were visualized. For each trait, mean values were plotted over time with error bars representing standard errors.
To examine the effects of culture time (in days) and location on biometric traits (e.g., SH), a linear regression model was used. The model included ‘day’ as a categorical variable with levels corresponding to the sampling days and ‘location’ as a factor with two levels (Sanya and Wanning). An interaction term between day and location was included to assess whether the effect of day on shell height differed across the two locations. The model was fit using the formula: biometric trait ~ Day * Location, where biometric trait is the response variable (e.g. SH), and day and location are fixed effects. Furthermore, pairwise comparisons of estimated marginal means (EMMs) were conducted using the emmeans package. EMMs were calculated for each day at each location, and Tukey’s test was applied to address multiple comparisons. Statistical significance was evaluated at a level of P < 0.05 and the analysis was performed using the lm function in R.17
Results
Oyster survival
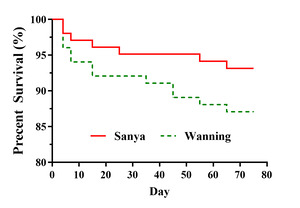
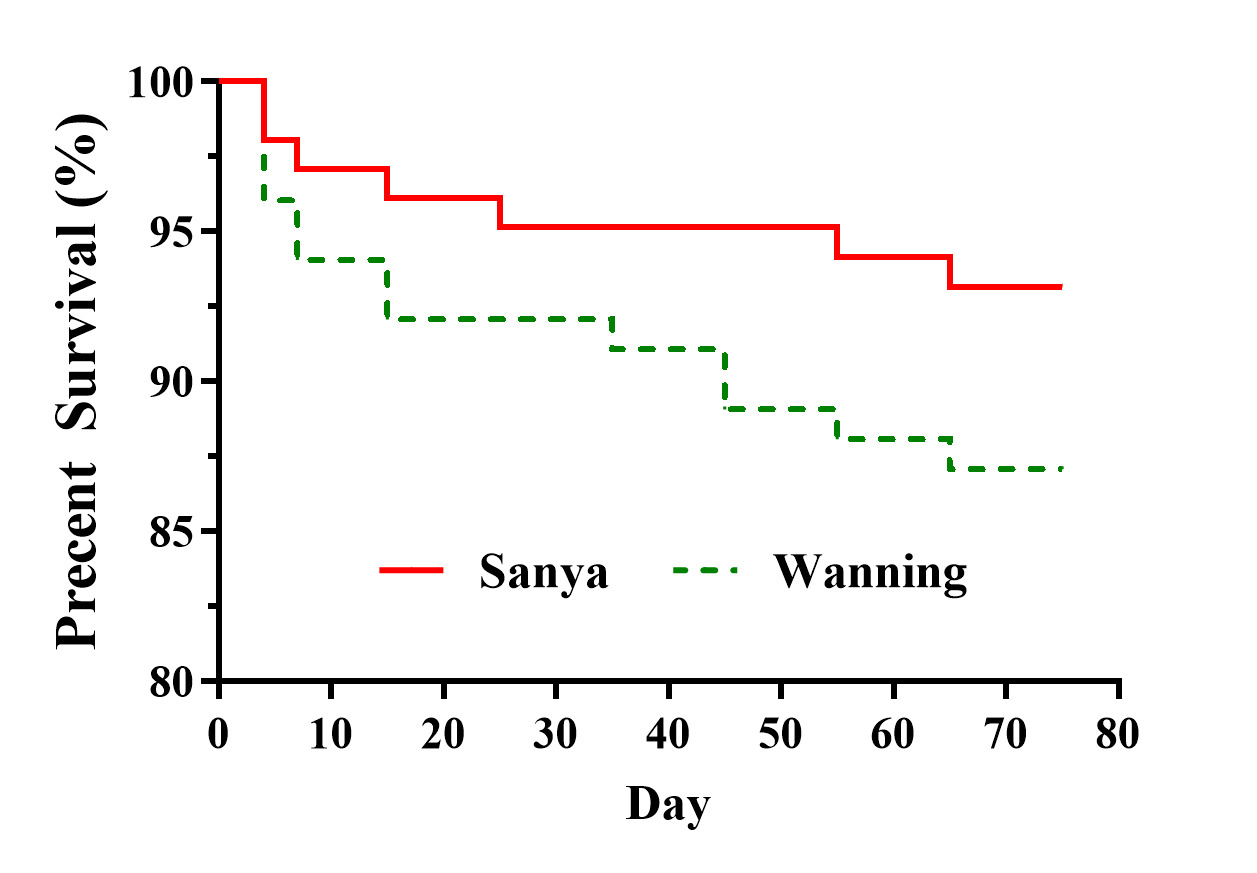
Oysters cultured in Sanya had the highest survival rate, with 93.96% remaining alive by the end of the experiment. In contrast, 86.91% of oysters in Wanning survived until the conclusion of the study (Figure 2). In both locations, oyster mortality was associated with the presence of crabs inside the nets.
Biometric traits and condition index
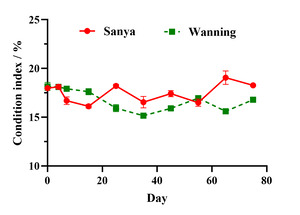
The transplantation of oysters to two different locations in Hainan Island (Sanya and Wanning) resulted in distinct growth over the 75-day period (Table 1). Most biometric traits of oysters transplanted to both locations showed no significant changes by the end of the experiment compared with the initial values (day 0). In Sanya, oysters showed a general increase in biometric traits and tissue weights by day 75, suggesting a positive growth response. Furthermore, the condition index (CI) slightly improved from 17.98% to 18.27%, further supporting better physiological condition in Sanya. In contrast, oysters transplanted to Wanning showed declines in most biometric measurements. While some wet weight measures increased, and the condition index decreased significantly from 18.15% to 16.79% (P < 0.05), indicating a decline in overall health and condition.
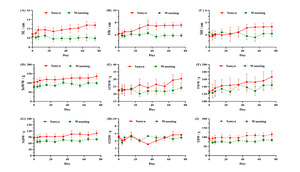
Temporal changes and location have significant impacts on oyster traits, with distinct growth and condition patterns emerging between Sanya and Wanning over time. While the other parameters were not statistically significant at the conclusion of the experiment, fluctuations were evident throughout the experimental period (Figure 3). The shoot morphological traits showed a trend of increase or stabilization in Sanya, while they remained relatively stable or slightly changed in Wanning, indicating that Sanya’s environment was more conducive to shoot growth. Regarding biomass accumulation, Sanya generally exhibited an increasing or maintained trend, whereas those were lower and showed less variation in Wanning.
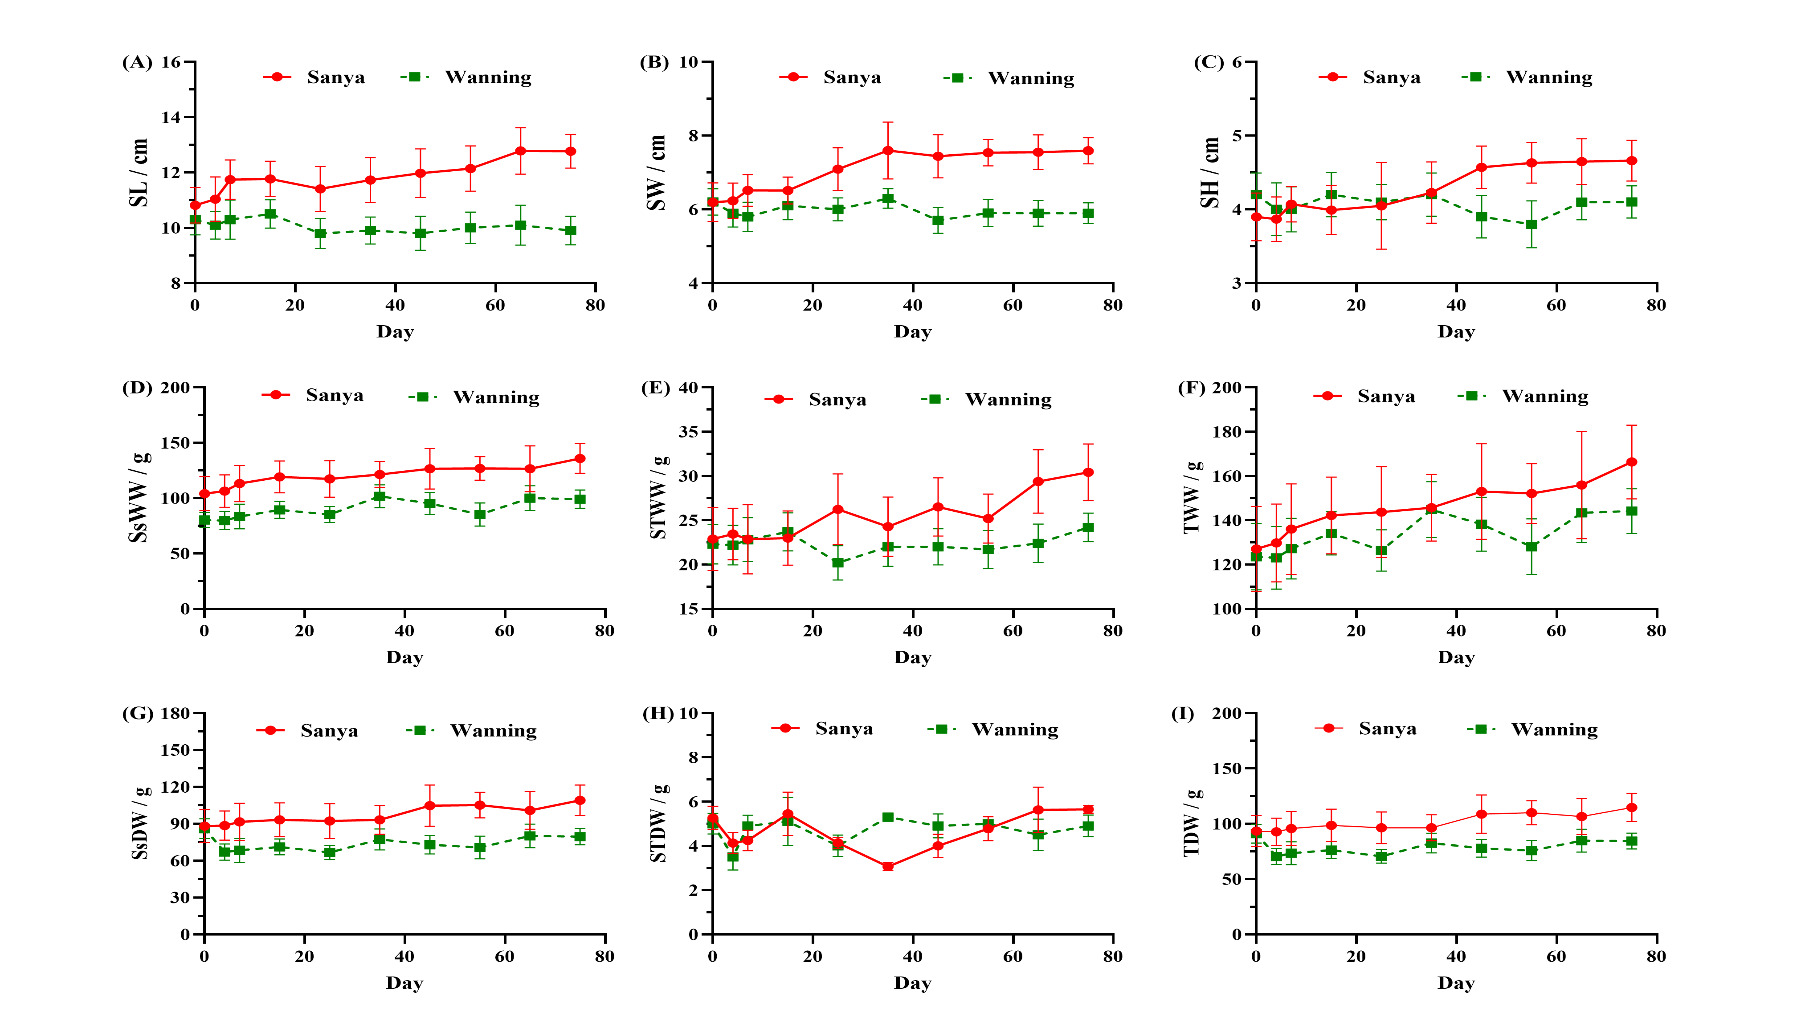
The further linear regression analyses revealed significant effects of time (day), location (Sanya and Wanning), and their interaction (day × location) on several key traits of oysters, including SL, SW, SH, SsWW, STWW, TWW, SsDW, STDW and TDW. And no significant effects were detected for STDW. For SH, the model explained 35.6% of the variance (adjusted R² = 0.327) and indicated significant increases from day 35 onwards, with growth patterns varying between locations. While Sanya oysters exhibited higher SH across days, Wanning oysters had significantly lower SH, particularly on day 75 (Estimate = -2.50, P < 0.001). Similarly, SL showed significant effects of day and day × location interactions on several days, with consistently lower SL observed in Wanning. The analysis of SW revealed significant effects of time (day), location, and their interaction. Over time, SW increased for specific days, but the interaction terms showed slower gains in Wanning compared to Sanya on these days (e.g., Day 25: -0.80 ± 0.27, P = 0.0033; Day 35: -1.00 ± 0.27, P = 0.0002). This suggests that the growth rate in Wanning was lower than that in Sanya during the study period. Overall, the results highlight location-specific differences in growth dynamics. For TWW, slower growth in Wanning was observed over time. The STWW demonstrated a clear effect of day and significant day × location interactions, with higher weights observed on days 45, 65, and 75, primarily in Sanya. While consistently lower STWW during these periods was observed in Wanning, and the model explained 42.6% of the variance. Similarly, the SsDW showed significant day × location interactions, with lower values in Wanning than in Sanya on most days. In contrast, no significant effects were found for soft tissue DW, with the model explaining only 28.9% of its variability and an insignificant overall F-statistic (P = 0.622).
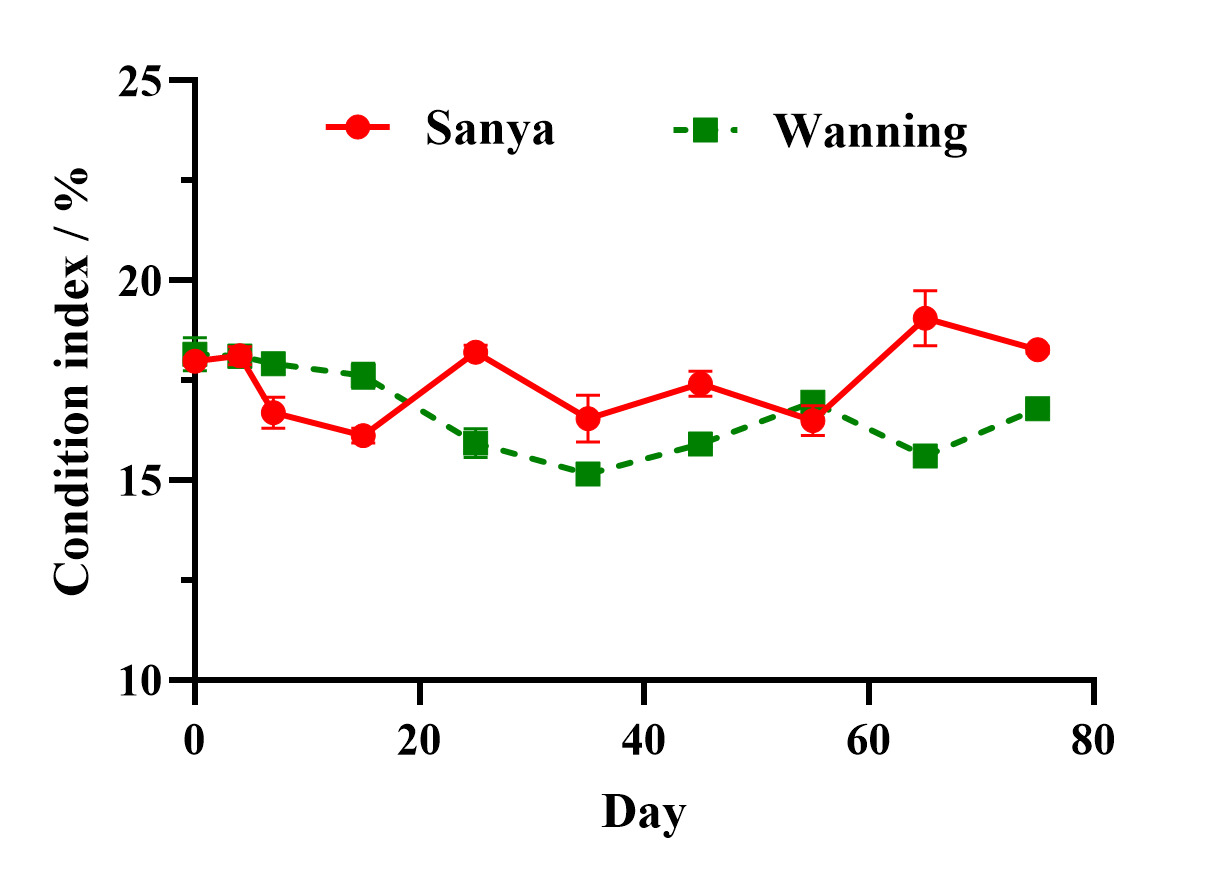
The analysis of CI revealed significant effects of time (day), location, and their interaction. The condition index in Sanya showed fluctuations, with a notable increase after day 65, reaching a relatively high level before a slight decrease. In contrast, Wanning exhibited a more stable trend with generally lower values, showing a gentle decline in the early stage, followed by a modest increase, but never surpassing the levels observed in Sanya (Figure 4). Furthermore, the analysis of CI revealed significant effects of time (day), location, and their interaction. Overall, oysters in Wanning exhibited a lower baseline CI than those in Sanya (-0.021 ± 0.005; P < 0.001). Over time in Sanya, there was a significant decline in CI on some days (e.g., day 7: -0.012 ± 0.006, p = 0.047; Day 35: -0.023 ± 0.006, P < 0.001), suggesting temporal changes in oyster condition. Conversely, positive interaction effects for Wanning on several days (e.g., day 7: +0.024 ± 0.007, P = 0.002) indicate that the decline in CI was less pronounced or reversed in Wanning than in Sanya during these periods. These findings reflect environmental or experimental conditions unique to each location, highlighting their role in shaping oyster development.
The Principal Component Analysis (PCA) was used to examine the relationships between SH, SL, SW, and TWW of oysters from Sanya and Wanning (Figure 5). The first two principal components (PC1 and PC2) explained most of the variance in the dataset, with PC1 accounting for the greatest variability along the x-axis and PC2 capturing the second-largest variance along the y-axis. The PCA plot reveals partially overlapping clusters for oysters from both locations, indicating both variation and similarities. The variable arrows form a “fan” pattern, all pointing in the opposite direction of PC2, suggesting that the variables are primarily associated with PC1. Specifically, SW is most perpendicular to PC1, contributing significantly to the variability along PC1. While SL points in a slightly more horizontal direction, contributing to PC1 to a lesser extent than SW. SH points upward, indicating it is more closely related to PC2 and has minimal influence on PC1. TWW, pointing horizontally, shows a moderate contribution to PC1 and a weaker association with PC2. Overall, the PCA indicates that the dataset’s variability is driven primarily by SW and SL along PC1, with SH contributing more to PC2. The TWW is influenced by both components but aligns more with PC1, reflecting overall differences in size and weight between oysters from Sanya and Wanning.
_of_the_relationships_between_sh__sl__sw_and_tww_of_.tiff)
Oyster nutritional parameters
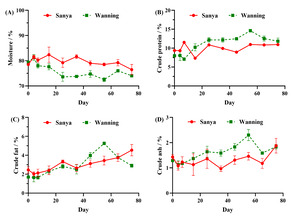
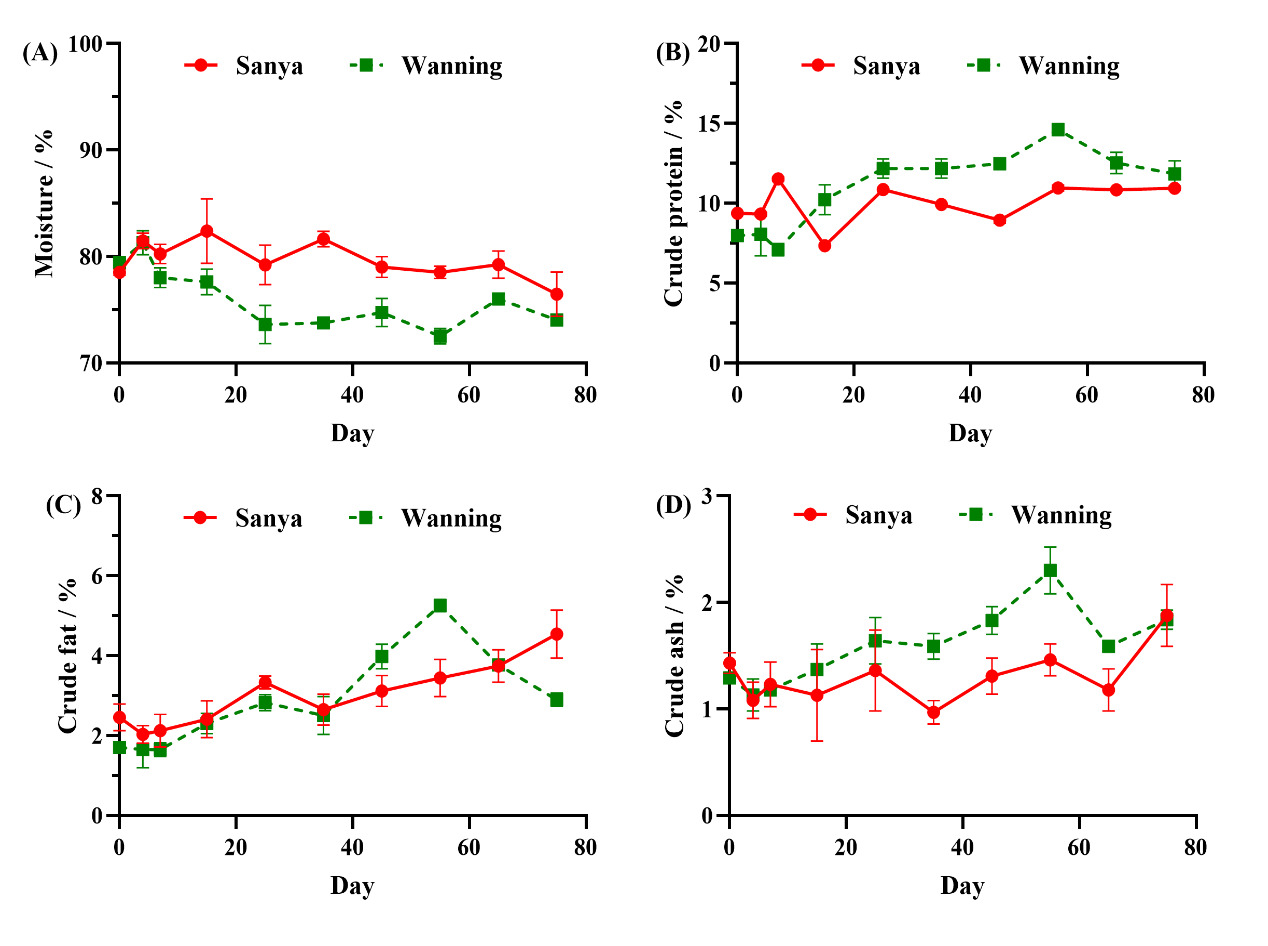
The transplantation of oysters to two different locations in Hainan Island (Sanya and Wanning) resulted in notable changes in nutritional composition over the 75-day period (Table 2). In oysters cultured in Sanya, although moisture content decreased from 78.03% to 72.85% and crude ash content increased from 1.43% to 1.88%, these changes were not statistically significant (P > 0.05). However, both crude protein (from 9.38% to 10.94%) and crude fat contents (from 2.46% to 4.54%) increased significantly (P < 0.05). Otherwise, all nutritional parameters in Wanning showed significant changes after 75 days (P < 0.05). Moisture decreased from 79.43% to 74.05%, while protein, fat, and ash content increased markedly. These findings indicate transplantation led to significant improvements in protein and fat content in both locations, with Wanning showing more consistent and statistically significant changes across all parameters.
A more in-depth analysis using the linear model to assess the effects of cultivation time (day), location, and their interaction on oyster moisture content (%) explained a significant portion of the variability (R² = 0.42, F (17, 36) = 3.26, P = 0.0014) along the different sampling days. Although location alone was not significant (P = 0.83), interaction effects on days 35 (P = 0.01) and 55 (P = 0.0485) highlighted differences in moisture content between Wanning and Sanya at these time points (Figure 6). The post hoc Tukey comparisons revealed minimal, non-significant changes in moisture content on day 0 and day 75 in either location, indicating relatively stable moisture levels over time (Table 2, Figure 6A). In contrast, crude protein content (%) showed significant temporal, locational, and interaction effects (Figure 6B). The model explained 87% of the variance (R² = 0.81). Crude protein content in Sanya increased on days 7, 25, 55, 65, and 75 compared to day 0. In Wanning, protein content increased progressively from day 15, with significant reductions by day 65 (P < 0.05). Crude fat content also varied significantly over time, with the model explaining 76% of the variability (R² = 0.65, Table 2, Figure 6C). In Sanya, fat content increased steadily, peaking at 4.54% above baseline by day 75 (P < 0.05). Wanning oysters showed a more complex pattern: fat content tended to increase, peaking on day 55, then dropped significantly on day 75 (P < 0.05). These findings suggest that fat deposition dynamics differed between the two locations, with a delayed accumulation in Wanning. Ash content analysis indicated significant temporal and locational interactions (R² = 0.4874). Sanya oysters showed a decrease in ash content by day 35 (P = 0.01), followed by an increase by day 75 (P = 0.03). In Wanning, ash content increased on day 55 (P = 0.02), with trends approaching significance at other time points. However, no significant differences in ash content were found between day 0 and day 75 in either location (P > 0.05, Table 2), suggesting overall stability in ash content despite temporal fluctuations along the experimental time (Figure 6D). Overall, temporal changes in moisture, protein, fat, and ash content were observed, and these patterns varied across locations, with Sanya oysters showing more consistent trends and Wanning oysters showing more pronounced fluctuations.
Discussion
Oyster survival
In this study, survival rates differed between the two sites, with Sanya showing a higher rate than Wanning. The primary cause of mortality at both locations is crab predation within the culture nets, underscoring the critical role of predator management in oyster aquaculture. Sanya’s higher survival rate suggests more favorable environmental conditions or better protection from predation, which aligns with the species’ strong general combining ability for survival and stability in high-temperature subtropical mariculture systems. In contrast, Wanning’s lower survival emphasizes the need for improved management, such as frequent net inspections, predator barriers, or targeted crab mitigation strategies.
Predation is a significant factor influencing oyster survival. The presence of predators such as crabs and oyster drills can reduce oyster populations. But the feeding rate of predators has minimal impact on the success of transplanting adult and near-adult oysters, as predation predominantly targets smaller size classes.2 Moreover, salinity changes can stress oysters. Previous studies have shown that salinity shifts greater than 20% can reduce oyster survival,18 and this may partly explain the lower survival observed in Wanning, although we did not directly measure salinity at our sites. Acclimation to new environments is also crucial for oyster survival. Oysters need time to adjust after transplantation; a minimum of 7 days is recommended for successful relay. This acclimation period allows oysters to stabilize after being transferred to a new environment.3 Oyster transplantation is a complex process with interconnected factors affecting survival. Carefully considering the timing of transplantation, salinity changes, and the presence of predators and diseases is critical for successful oyster relay and restoration efforts.
Biometric traits and condition indexes
Most biometric traits of C. angulata showed no significant changes by the end of the experiment, but site-specific differences emerged in certain traits. Oysters in Wanning exhibited significant changes only in the condition index. Although other traits did not show endpoint significance, fluctuations throughout the experimental period were evident, with time and location playing key roles in driving these patterns. Linear regression analysis revealed significant effects of time, location, and their interaction on SH, SL, SW, TWW, SsWW, SsDW and STWW and CI, but not on STDW. Principal Component Analysis (PCA) highlighted the dominant role of SW and SL in driving variability across locations, with SH and TWW contributing to finer-scale differences.
The observed site-specific differences in growth and condition likely reflect the influence of local environmental factors, including water quality, food availability, and hydrodynamic conditions. In Sanya, significant increases in TWW, SsWW and STWW suggest favorable conditions for biomass accumulation, potentially driven by higher food availability or better water quality. Conversely, the limited growth observed in Wanning, particularly for CI, may indicate environmental constraints such as suboptimal water flow or nutrient levels. These findings align with previous research highlighting the role of site-specific factors in shaping oyster growth and physiological performance. The abundance and quality of food sources at a particular site directly impact oyster growth and energy reserves. For example, oysters finished in a lagoon environment exhibit higher lipid content due to the better trophic conditions and greater availability of feed compared to those finished in a sea environment.19 The abundance of phytoplankton, a primary food source for oysters, is influenced by factors like nutrient levels, water temperature, and salinity, all of which vary across locations.14 Oysters in areas with higher phytoplankton concentrations tend to have faster growth rates and accumulate greater energy reserves.19 Salinity is also a crucial factor affecting oyster physiology. Oysters are osmoconformers, meaning their internal salinity fluctuates with the surrounding water salinity. Exposure to salinity levels outside their tolerance range can induce stress and impact various physiological processes, including growth, reproduction, and immune function.20–22 For instance, oysters transplanted to areas with lower salinity levels exhibit higher lysosomal destabilization and digestive tubule atrophy, indicators of physiological stress.16 The depth at which oysters are grown can also influence their physiology. Oysters cultured at greater depths tend to have slower growth rates, potentially due to factors like lower food availability and reduced light penetration.14 Additionally, water currents and wave action, which vary with depth, can influence food supply and oxygen availability.7
The decline in CI over time in Wanning raises concerns about potential stressors, such as resource competition or environmental changes, that may affect long-term growth and reproduction. However, the resilience observed in Sanya, where CI increased over time despite lower initial values, underlines the adaptability of C. angulata to varying environmental conditions. These patterns highlight the importance of accounting for temporal dynamics when evaluating aquaculture site suitability, particularly how whole-weight and survival phenotypes fluctuate across successive grow-out stages.23 Furthermore, the significant interaction effects for traits such as SH, SW, and TWW emphasize the complex interplay between time and location. While oysters in Wanning started with a similar baseline SL and SW, their slower growth rates compared to Sanya suggest possible trade-offs between initial size advantages and subsequent resource allocation. These findings reinforce the idea that growth trajectories are not solely dependent on initial conditions but are dynamically influenced by local factors over time. The PCA results further elucidate the relationships between biometric traits across locations, revealing both overlapping and distinct growth patterns. The dominant contributions of SW and SL to overall variability underscore the importance of shell morphology in assessing site-specific performance, echoing genetic parameter estimates, in which shell growth dimensions are key determinants of phenotypic variance.24 While the relatively independent influence of SH on PC2 suggests its potential sensitivity to different environmental drivers. These findings have practical implications for aquaculture management, particularly in site selection and husbandry strategies. Sanya appears to support faster biomass accumulation and greater resilience in CI, making it a promising site for market-sized oysters.
Nutritional parameters
The comparison of nutritional parameters between oysters cultivated in Sanya and Wanning revealed notable differences in the dynamics of fat and protein content over time, indicating strong environmental modulation of proximate biochemical profiles, as observed in congeneric oyster lines.25 This again highlights the significant impact of location-specific environmental factors on oyster metabolism. While moisture content exhibited stability across both sites, with no significant differences between day 0 and day 75. This consistency suggests that oysters maintained hydration levels, a critical aspect of physiological homeostasis, regardless of environmental variability. However, significant interaction effects on days 35 and 55 indicate that localized environmental conditions, such as salinity or a probable temperature fluctuation, could transiently influence moisture retention. Ash content showed similar stability from the start to the end of the experiment, indicating no substantial changes over the study period. Nonetheless, localized temporal fluctuations, including a decrease in Sanya on day 35 and an increase in Wanning on day 55, could reflect varying environmental pressures that influence mineral availability. These results imply that while external conditions may induce short-term changes, oysters are generally capable of maintaining consistent hydration under the aquaculture settings.
Protein content demonstrated contrasting trends between Sanya and Wanning, reflecting differential responses to environmental conditions. In Sanya, protein levels remained stable throughout the experimental period, suggesting that oysters there experienced favorable, consistent conditions that supported balanced growth and metabolism. The stability in protein content aligns with the observed steadiness in other traits, such as moisture and ash content, reinforcing the notion that Sanya provided a relatively stable environment conducive to physiological equilibrium. In Wanning, protein content increased significantly from day 15 onward, likely indicating an adaptive response to early environmental conditions that may have stimulated protein synthesis, such as increased food availability or favorable water parameters. However, the subsequent decline in protein content by day 65 suggests a shift in metabolic priorities, possibly triggered by stress or resource limitations. This dynamic pattern highlights the potential impact of environmental variability in Wanning, which may have caused oysters to redirect energy from protein synthesis to other physiological processes, such as maintenance or reproduction. These site-specific differences underscore the sensitivity of protein metabolism to external factors and its role as a key indicator of oyster health and growth potential. Furthermore, fat content exhibited significant temporal and locational variation, with oysters in Sanya showing a steady, significant increase over time. This pattern suggests that environmental conditions in Sanya, such as food abundance and stable temperatures, favored lipid accumulation, allowing oysters to store energy efficiently. Lipid storage is often associated with favorable metabolic conditions, and the consistent increase in Sanya suggests minimal environmental stress and optimal energy balance. The marked increase in crude fat in Sanya oysters (from 2.46% to 4.54%) exceeds the typical fat content of many wild oysters and may enhance flavor and mouthfeel, key attributes for raw consumption. However, we did not measure lipid oxidation or omega-3/omega-6 ratios, which are also critical for nutritional quality. Future studies should include fatty acid profiling to fully evaluate health benefits. In contrast, oysters in Wanning exhibited a more complex pattern of lipid dynamics. Fat content increased initially, peaking at day 55, but declined significantly by day 75 to levels similar to the baseline. This variability may reflect a less stable environment in Wanning, where fluctuations in food availability or other stressors could have influenced energy storage and mobilization. The delayed accumulation and subsequent decline suggest that oysters in Wanning were subject to changing conditions that required reallocation of energy resources, potentially to cope with environmental challenges or to support reproduction. It has been documented that oysters from different sites and collection periods exhibit similar total lipid content, which is unexpected given the seasonal and spatial variability of environmental conditions at collection sites.14 This consistency suggests that oysters across locations may utilize glycogen, their primary glucose storage form, for energy in a comparable manner and/or may not rely heavily on their fat reserves.26,27
The observed differences in the dynamics of protein and fat content between Sanya and Wanning highlight the influence of location-specific environmental factors on oyster physiology. In Sanya, the consistent increase in fat content and stable protein levels suggest a favorable, predictable environment that supports efficient energy storage and balanced metabolic activity. Such conditions are ideal for aquaculture systems aimed at producing oysters with high nutritional quality. In Wanning, the dynamic patterns of protein and fat content reflect a more variable environment, where oysters had to adapt to fluctuating conditions. These fluctuations may have necessitated metabolic trade-offs, such as reallocating energy from growth to maintenance or stress responses, ultimately affecting the oysters’ nutritional composition. There is evidence that oysters undergo changes in fatness and protein content when transferred between different environments. Relaying oysters (replanting them on the bed from which they were harvested) before fall fattening begins can reduce their fatness. Oysters transferred from a down-river (fatter) to up-river (leaner) beds before fall fattening ended up even thinner than the native up-river oysters by the end of the season.4 Transferring up-river oysters to down-river beds lead to a significant improvement in their condition, often making them fatter than the native down-river oysters. However, transferring down-river oysters back to up-river beds results in poorer fattening compared to the native up-river stock. In another experiment, sea-finished oysters had higher moisture, crude protein, and ash content compared to lagoon-finished oysters.19 This suggests that oysters adapt to their specific environments, affecting their response to relocation.
Although we did not measure environmental parameters at the site, we consulted publicly available satellite data for the experimental period. These data indicated that Sanya had slightly higher average sea surface temperature (28.5 °C vs. 27.8 °C) and chlorophyll-a concentration (1.2 vs. 0.9 mg/m³) than Wanning. These differences may partially explain the better growth and nutritional outcomes in Sanya, though we acknowledge that causal attribution requires direct measurement in future studies.
Conclusion
These findings have important implications for aquaculture site selection and management. The stable conditions in Sanya appear to promote consistent growth and nutrient storage, making it a more suitable location for cultivating oysters with desirable nutritional profiles. In contrast, the more variable conditions in Wanning highlight the need for careful monitoring and management to mitigate environmental stressors that could impact oyster quality. Strategies such as selective harvesting during peak nutritional periods could help optimize production in less stable environments, such as Wanning. Further research is needed to identify the specific environmental drivers of these locational differences, such as Chlorophyll-a concentrations, temperature fluctuations, and hydrodynamic regimes. Understanding how these factors interact to influence oyster metabolism will provide critical insights for improving aquaculture practices. Additionally, exploring the genetic basis for the observed metabolic responses could inform selective breeding programs aimed at developing oysters better suited to variable environments.
Acknowledgments
This work was supported by the Key Research and Development Project of Hainan Province (ZDYF2024XDNY166), the Project of Sanya Yazhou Bay Science and Technology City (Grant NO. sckj-jyrc-2024-50), the fund of Key Laboratory of Efficient Utilization and Processing of Marine Fishery Resources of Hainan Province (KLEU-2024-1), the earmarked fund for CARS (CARS-49), Hainan Provincial Natural Science Foundation of China (325RC655), Science and Technology Development Foundation of South China Sea Bureau-Ministry of Natural Resources (240101), and Secondary Sub-projects of Scientific Research and Technology Demonstration Category in the National Modern Agricultural Industrial Park, Wanning City, Hainan Province.
Authors’ Contribution
Data curation: Chao Yuan (Equal), Mingyue Dong (Equal). Formal Analysis: Chao Yuan (Equal), Mingyue Dong (Equal), Zi Wang (Equal), Hebert E. Vasquez (Equal). Investigation: Chao Yuan (Equal), Mingyue Dong (Equal), Zi Wang (Equal), Meng Zhang (Equal). Methodology: Chao Yuan (Equal), Mingyue Dong (Equal), Zhifeng Gu (Equal). Validation: Chao Yuan (Equal), Mingyue Dong (Equal). Visualization: Chao Yuan (Equal), Mingyue Dong (Equal), Zi Wang (Equal), Hebert E. Vasquez (Equal), Xing Zheng (Equal). Writing – original draft: Chao Yuan (Lead). Software: Hebert E. Vasquez (Equal), Zhifeng Gu (Equal). Writing – review & editing: Hebert E. Vasquez (Equal), Xing Zheng (Equal), Ge Xu (Equal), Zhiwei Che (Equal). Conceptualization: Xing Zheng (Equal), Ge Xu (Equal), Zhiwei Che (Equal). Funding acquisition: Xing Zheng (Equal), Ge Xu (Equal), Zhiwei Che (Equal). Project administration: Xing Zheng (Equal), Ge Xu (Equal), Zhiwei Che (Equal). Resources: Xing Zheng (Equal), Ge Xu (Equal), Zhiwei Che (Equal). Supervision: Xing Zheng (Lead).
Competing of Interest – COPE
No competing interests were disclosed.
Ethical Conduct Approval – IACUC
The animal experiment was approved by the Animal Ethics Committee of the Hainan University.
Informed Consent Statement
All authors and institutions have confirmed this manuscript for publication.
Data Availability Statement
All are available upon reasonable request.