
1. Introduction
Amid multiple challenges, including global climate change, resource overexploitation, and trade fluctuations, enhancing the resilience of economic systems has become an important issue for sustainable development. Fisheries provide food and livelihood security for billions of people, and their robustness, adaptability, and capacity for transformation profoundly affect food security and ecological balance. As the world’s largest fishery producer, China has long faced pressures from resources, the environment, and the market,1 and its resilience-building is not only relevant to national development but also provides a reference for the sustainable governance of global fisheries.
The resilience theory has evolved from engineering resilience to ecological resilience to evolutionary resilience. Engineering resilience emphasizes the capacity of a system to return to its original equilibrium state after being disturbed; ecological resilience focuses on the capacity of a system to absorb disturbances without altering its basic functional structure; evolutionary resilience further posits that a system should not only possess the capacities for resistance and recovery, but also the adaptive capacities for reorganization, renewal, and transformation, in order to cope with uncertain environments.2–5 This paper adopts the theoretical stance of evolutionary resilience and defines FER as the comprehensive attribute of a regional fishery economic system to maintain system stability, effectively respond to crises, and achieve sustainable development through the coordinated operation of three core capacities—risk resistance, adaptive adjustment, and innovative transformation—when facing internal and external shocks such as resource depletion, market fluctuations, and climate change. From the perspective of evolutionary resilience, resilience across regions is not an isolated attribute; rather, it forms spatial associations through factor flows, technological diffusion, and policy coordination, with regions influencing and shaping each other. Therefore, introducing social network analysis to examine the spatial association structure and its dynamic evolution of FER at the inter-provincial level is a natural extension of evolutionary resilience theory in the spatial dimension.
Fishery resilience research has gradually exhibited multi-scale characteristics, with the micro-level focusing on the livelihood resilience of fishing households,6 and the macro-level mostly measuring coastal or marine fishery resilience through comprehensive evaluation systems and analyzing its spatiotemporal differentiation.7–13 In terms of methodological advances, tools such as social network analysis and QAP regression have been applied to fields including ecological resilience, agricultural resilience, marine resilience, and tourism resilience,14–19 initially achieving a methodological shift from attribute analysis to relational analysis and from static snapshots to dynamic evolution. However, the systematic application of the above methods in FER research remains rare, not merely a matter of domain transplantation but rather determined by the unique characteristics of the fishery system. First, the rigid constraints of resource dependence. The absolute dependence of fishery production on natural aquatic conditions creates non-negligible resource-sharing and competition relationships among provinces, and the mandatory nature of this spatial interaction is far higher than in agriculture or manufacturing. Second, the temporal sensitivity of product attributes. The high perishability of aquatic products makes their circulation network highly dependent on cold-chain logistics and market accessibility, giving the flow of resilience factors across regions a distinct rhythm and direction from those in other industries. Third, the spatial spillover of risk transmission. Fishery disasters exhibit strong spatial diffusion characteristics, and resource depletion or environmental degradation in one region often affects adjacent or even trans-regional fishing grounds through ecological connectivity—this “spatially mandatory association” implies that the spatial analysis of fishery resilience must be conducted within a network framework.
At the level of driving factors, the formation of spatial association networks is driven by multiple factors, including geographical distance, economic development level, industrial structure, technological innovation, policy regulation, and infrastructure.20–24 In fishery-related studies, some scholars have examined the effects of aquaculture structure, technology, and economic level on the network of fishery carbon emission efficiency,25 and have identified the economic development level, industrial structure, and scientific and technological input as key drivers of the marine economic resilience network.26 However, most of these studies still employ traditional econometric models based on attribute data, failing to fully account for the characteristics of relational data structures, and lacking exploration of the dynamic effects of driving factors’ influence over time. Specifically, the following question remains unanswered: Is there an identifiable spatial association network among provincial FERs? How does the structure of this network evolve over different periods? Does the intensity of driving factors’ effects undergo phased changes over time?
In summary, existing studies have three core limitations that progress. First, at the analytical perspective level, most studies focus on measuring resilience levels and spatiotemporal differentiation, without treating provincial resilience as an interconnected network system. Second, at the analytical depth level, most studies provide structural snapshots at specific time points, failing to track the coordinated evolution of network structure, node status, and block functions. Third, at the analytical method level, most studies employ attribute data regression, which cannot effectively handle the characteristics of relational data structures, and also pay insufficient attention to the temporal changes in the influence of driving factors. To address these issues, this study, from the perspective of evolutionary resilience, achieves breakthroughs at three levels: shifting from attribute analysis to network association, employing social network analysis to parse overall structure, node status, and block differentiation; shifting from static snapshots to dynamic evolution, analyzing the temporal evolution of network structure and individual indicators from 2013 to 2023; shifting from traditional econometrics to relational data modeling, employing QAP regression to test driving factors and examine their dynamic changes, in order to reveal the formation and evolution mechanisms of China’s FER spatial network.
2. Research Methods
2.1. Entropy Weight-TOPSIS Method
The entropy weight method objectively determines weights based on the degree of variation among indicators, effectively avoiding subjective bias; the TOPSIS method ranks the evaluation objects according to their closeness to the ideal solution.27,28 The combination of the two can not only rely on the entropy weight method to determine the objective weights of indicators but also perform relative ranking among provinces using TOPSIS. For specific steps, refer to Ji et al.29
2.2. Modified Gravity Model and FER Spatial Correlation Matrix
Drawing on relevant studies,30–37 a modified gravity model is constructed to measure the inter-provincial spatial correlation strength of FER, thereby forming the FER spatial correlation matrix. The model is as follows (Equation 1):
Qij=NQPiNQPi+NQPj×NQPi×NQPjD2ij(gi-gj)2
In the formula: Qij represents the spatial correlation strength of FER between provinces i and j; NQPi, NQPj, gi, and gj are the FER and per capita fishery GDP of the two provinces, respectively; is the square of the geographical distance between the capital cities of the two provinces. Based on this model, the gravitational values between provinces are calculated, and the average gravitational value per row is computed. Each province’s gravitational value is compared with its corresponding average; if greater than the average, it is recorded as 1; otherwise, it is recorded as 0.
The introduction of the per capita fishery GDP difference term in this paper is not intended to measure regional development disparities per se, but rather to capture the potential linkage dynamics generated by economic gradients across regions. In the process of fishery economic development, regions at different development levels may exhibit technology diffusion, industrial collaboration, and resource complementarity relationships, and economic gradients can facilitate cross-regional factor mobility. Therefore, the squared per-capita difference in fishery GDP is used to characterize the effects of economic gradients across regions. Moreover, the per capita fishery GDP differences among the provinces covered in the sample are pronounced, and the economic disparity term (gi−gj)2 is significantly greater than zero in all empirical analyses, so the model denominator does not carry the risk of approaching zero or being undefined. In the model, the geographical distance term primarily reflects the spatial barrier effect, while the economic disparity term reflects the potential linkage dynamics across regions; together, they jointly influence the intensity of inter-provincial FER associations from the two dimensions of spatial constraints and economic linkages, and there is no issue of the economic disparity term substituting for the distance term.
2.3. Analytical Methods for Spatial Correlation Network Structure
This paper systematically analyzes the structural characteristics of the FER network from three dimensions: the overall network, individual networks, and the spatial block model. The overall network utilizes indicators such as network correlation degree, number of network relations, network density, network hierarchy, and network efficiency to comprehensively measure the network’s accessibility, connectivity, and stability.29 Individual networks employ centrality indicators like in-degree centrality, in-closeness centrality, and betweenness centrality to depict the influence and locational advantages of each province within the network. The spatial block model divides the network into several internally closely connected blocks to identify functional differentiation among different blocks and the interactive relationships of spillover and benefit.38,39
2.4. QAP Regression Analysis Method
Network data belong to relational matrices, where variables are prone to multicollinearity. QAP regression does not require data to meet the assumptions of independence and normal distribution and can effectively address the multicollinearity issues in such relational data.40 Therefore, this paper adopts the QAP regression model to examine the driving factors of the spatial network of FER. The specific variables are described as follows:
1) Difference in Fiscal Support for Agriculture (Gov-Sup): The basic indicator is characterized by per capita fiscal expenditure on agriculture. Differences in government support levels may affect the coordination and allocation of anti-risk resources between regions, thereby regulating the strength of resilience spatial correlations. 2) Difference in Geographical Distance (Distance): The basic indicator is represented by the inter-provincial geographical distance matrix. Geographical proximity can reduce the costs of factor mobility and information transmission, serving as an important foundation for forming resilience spatial correlations. 3) Difference in Per Capita GDP (PGDP): The basic indicator is represented by regional per capita GDP. Differences in economic development levels often correspond to disparities in resource allocation and market linkage capabilities, thereby influencing inter-regional resilience synergy and network connectivity. 4) Difference in the Number of Demonstration Bases of Aquatic Technology Extension Institutions (Tech-Base): The basic indicator is represented by the number of demonstration bases in each province. Technologically advanced regions can enhance their resilience connections with other areas through knowledge spillovers and technology diffusion. 5) Difference in the Proportion of Feed and Fry Expenses in Household Expenditure (Feed-Seed): This proportion reflects the degree of regional dependence on key production inputs. Differences in input structures may drive the formation of supply chain-based regional resilience linkages.
The following regression model is established (Equation 2):
GL = f(Gov-Sup, Distance, PGDP, Tech-Base, Feed-Seed)
In the equation, GL represents the spatial correlation network matrix of FER, while the others are the difference relationship matrices of the corresponding variables.
2.5. FER Evaluation Index System
Based on the definition of FER, and closely adhering to the fundamental constraints faced by the fishery system—such as resource dependence, product perishability, and risk spillover—this paper follows the principles of scientific rigor, data availability, and representativeness. Drawing on relevant literature,41–46 a comprehensive evaluation system for FER comprising 28 specific indicators is constructed from the aforementioned three dimensions (Table 1). Among them, risk resistance capacity covers aspects such as resource support, production security, and ecological regulation. Adjustment and adaptation capacity focus on market response, industrial upgrading, and production optimization. Innovation and transformation capacity is characterized from the perspectives of technological support, technological application, and innovation conversion.
2.6. Data Sources and Description
To ensure data continuity and comparability, this study selects 27 provincial-level administrative regions in China from 2013 to 2023 as the sample (Tibet, Qinghai, Gansu, and Ningxia are excluded due to systematic missingness of key indicators). To eliminate the impact of price fluctuations, five value-based indicators, including the output value of aquatic fry and the total output value of the fishery economy, are deflated using the consumer price index of each province, with 2012 as the base period, and uniformly adjusted to constant 2012 prices. The data are sourced from the China Fishery Statistical Yearbook and the China Statistical Yearbook from 2014 to 2024. Missing values are supplemented using linear interpolation.
3. Results
3.1. Overview of FER
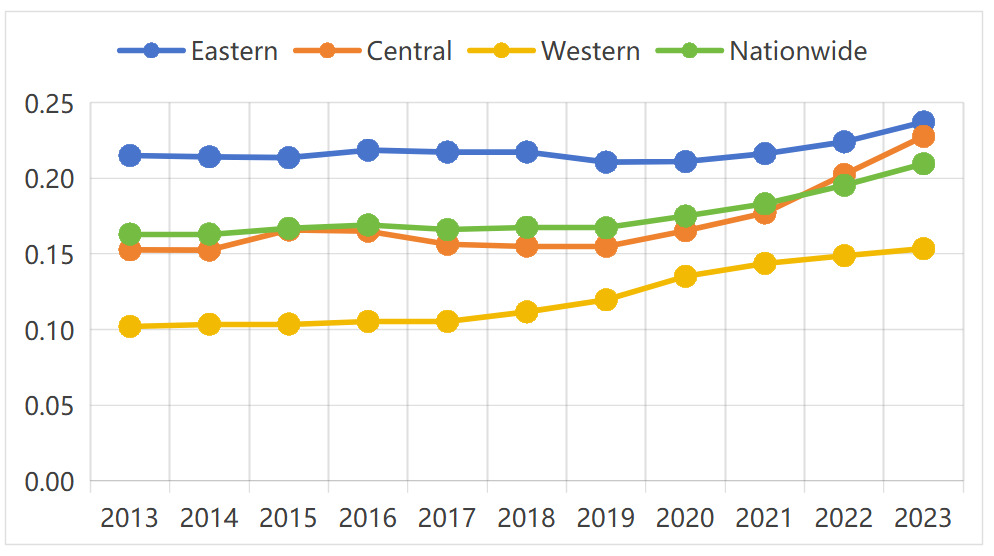
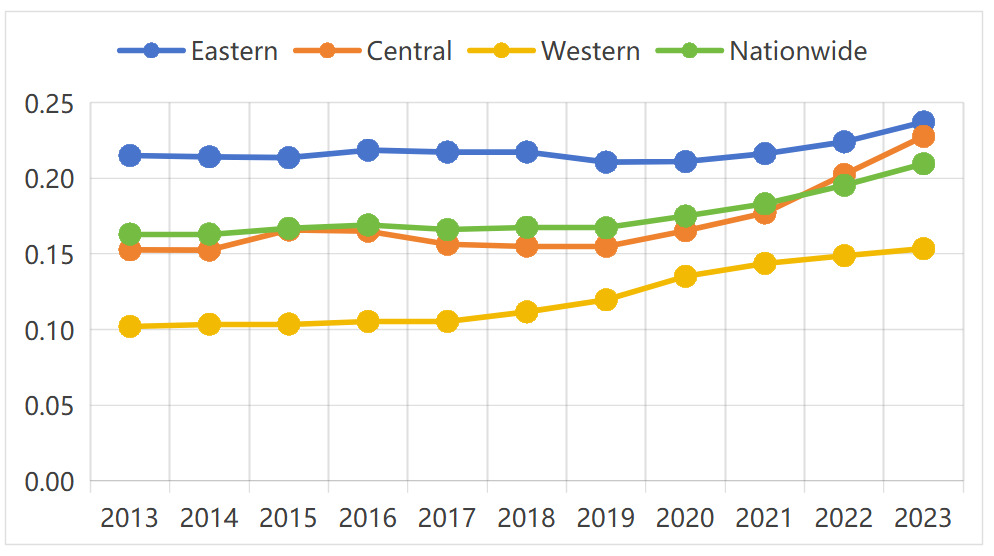
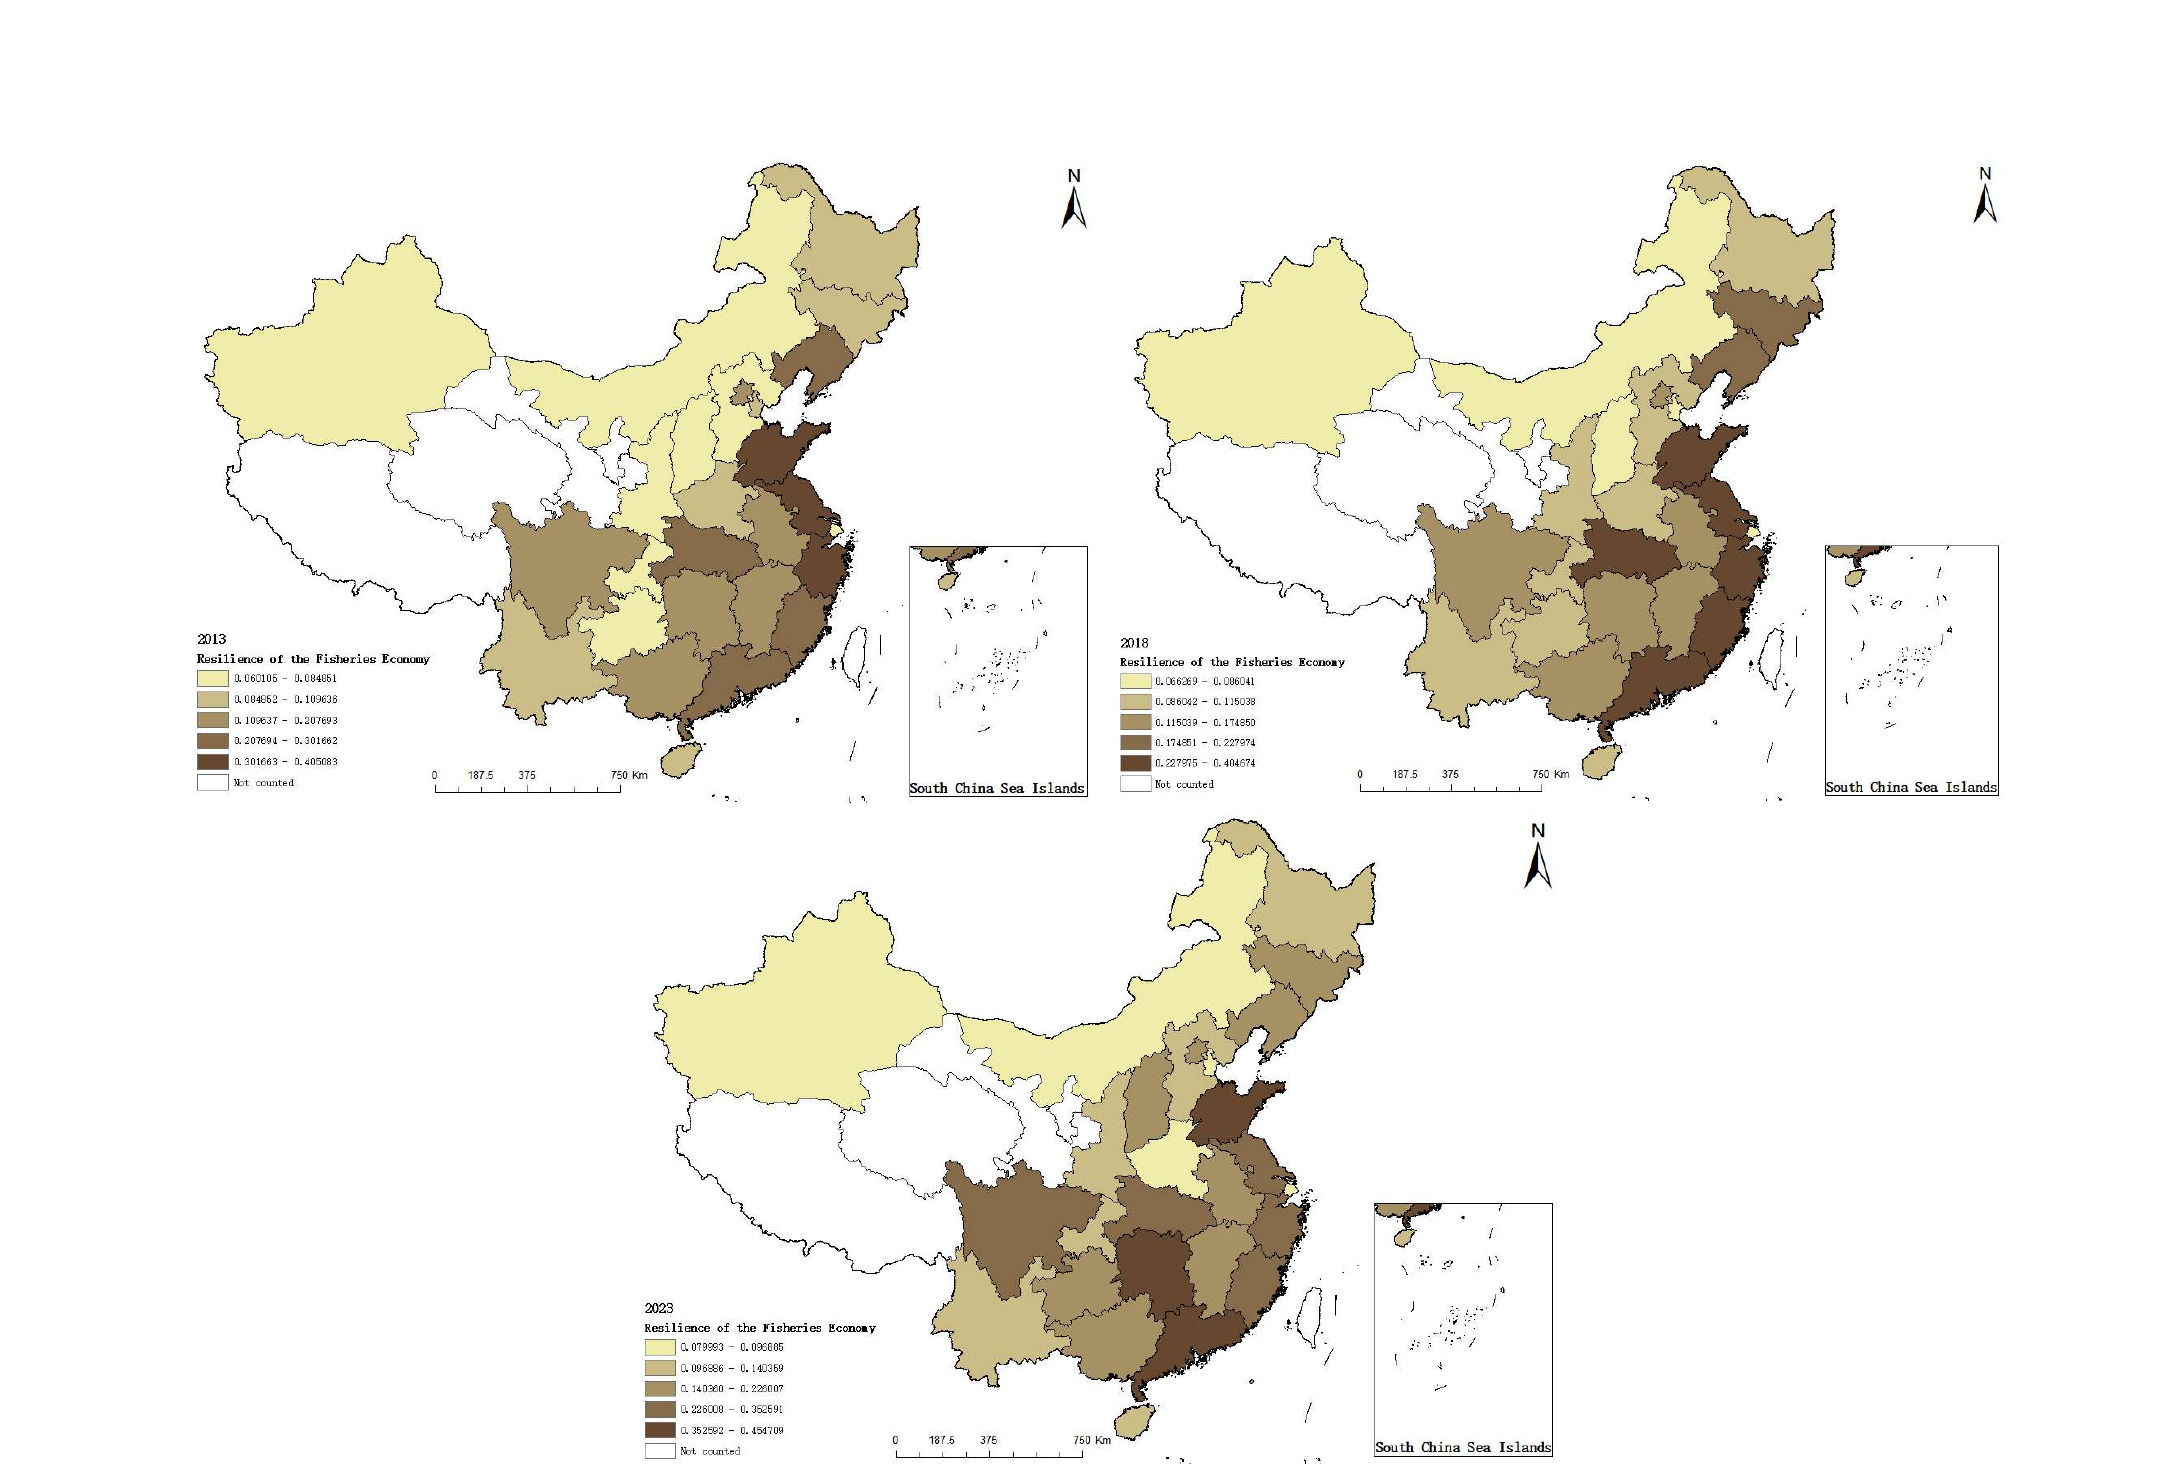
From 2013 to 2023, China’s FER exhibited a significant regional differentiation pattern of “high in the east and low in the west” (Figure 1). The mean values for the eastern, central, western, and national levels were 0.2177, 0.1704, 0.1211, and 0.1751, respectively, reflecting a clear gradient difference in resilience levels among regions. In terms of temporal evolution, the resilience of the eastern, central, and western regions all showed a continuous upward trend, with average annual growth rates of 0.99%, 4.08%, and 4.16%, respectively. Although the western region had the fastest growth rate, its resilience still lagged significantly behind that of the eastern and central regions due to its relatively weak foundation. The national FER as a whole maintained steady growth, with an average annual growth rate of approximately 2.54%. The eastern region, relying on marine resources and scientific and technological support, remained leading and stable; the central region steadily improved through freshwater resources and policy support; and the western region demonstrated strong potential for late development.
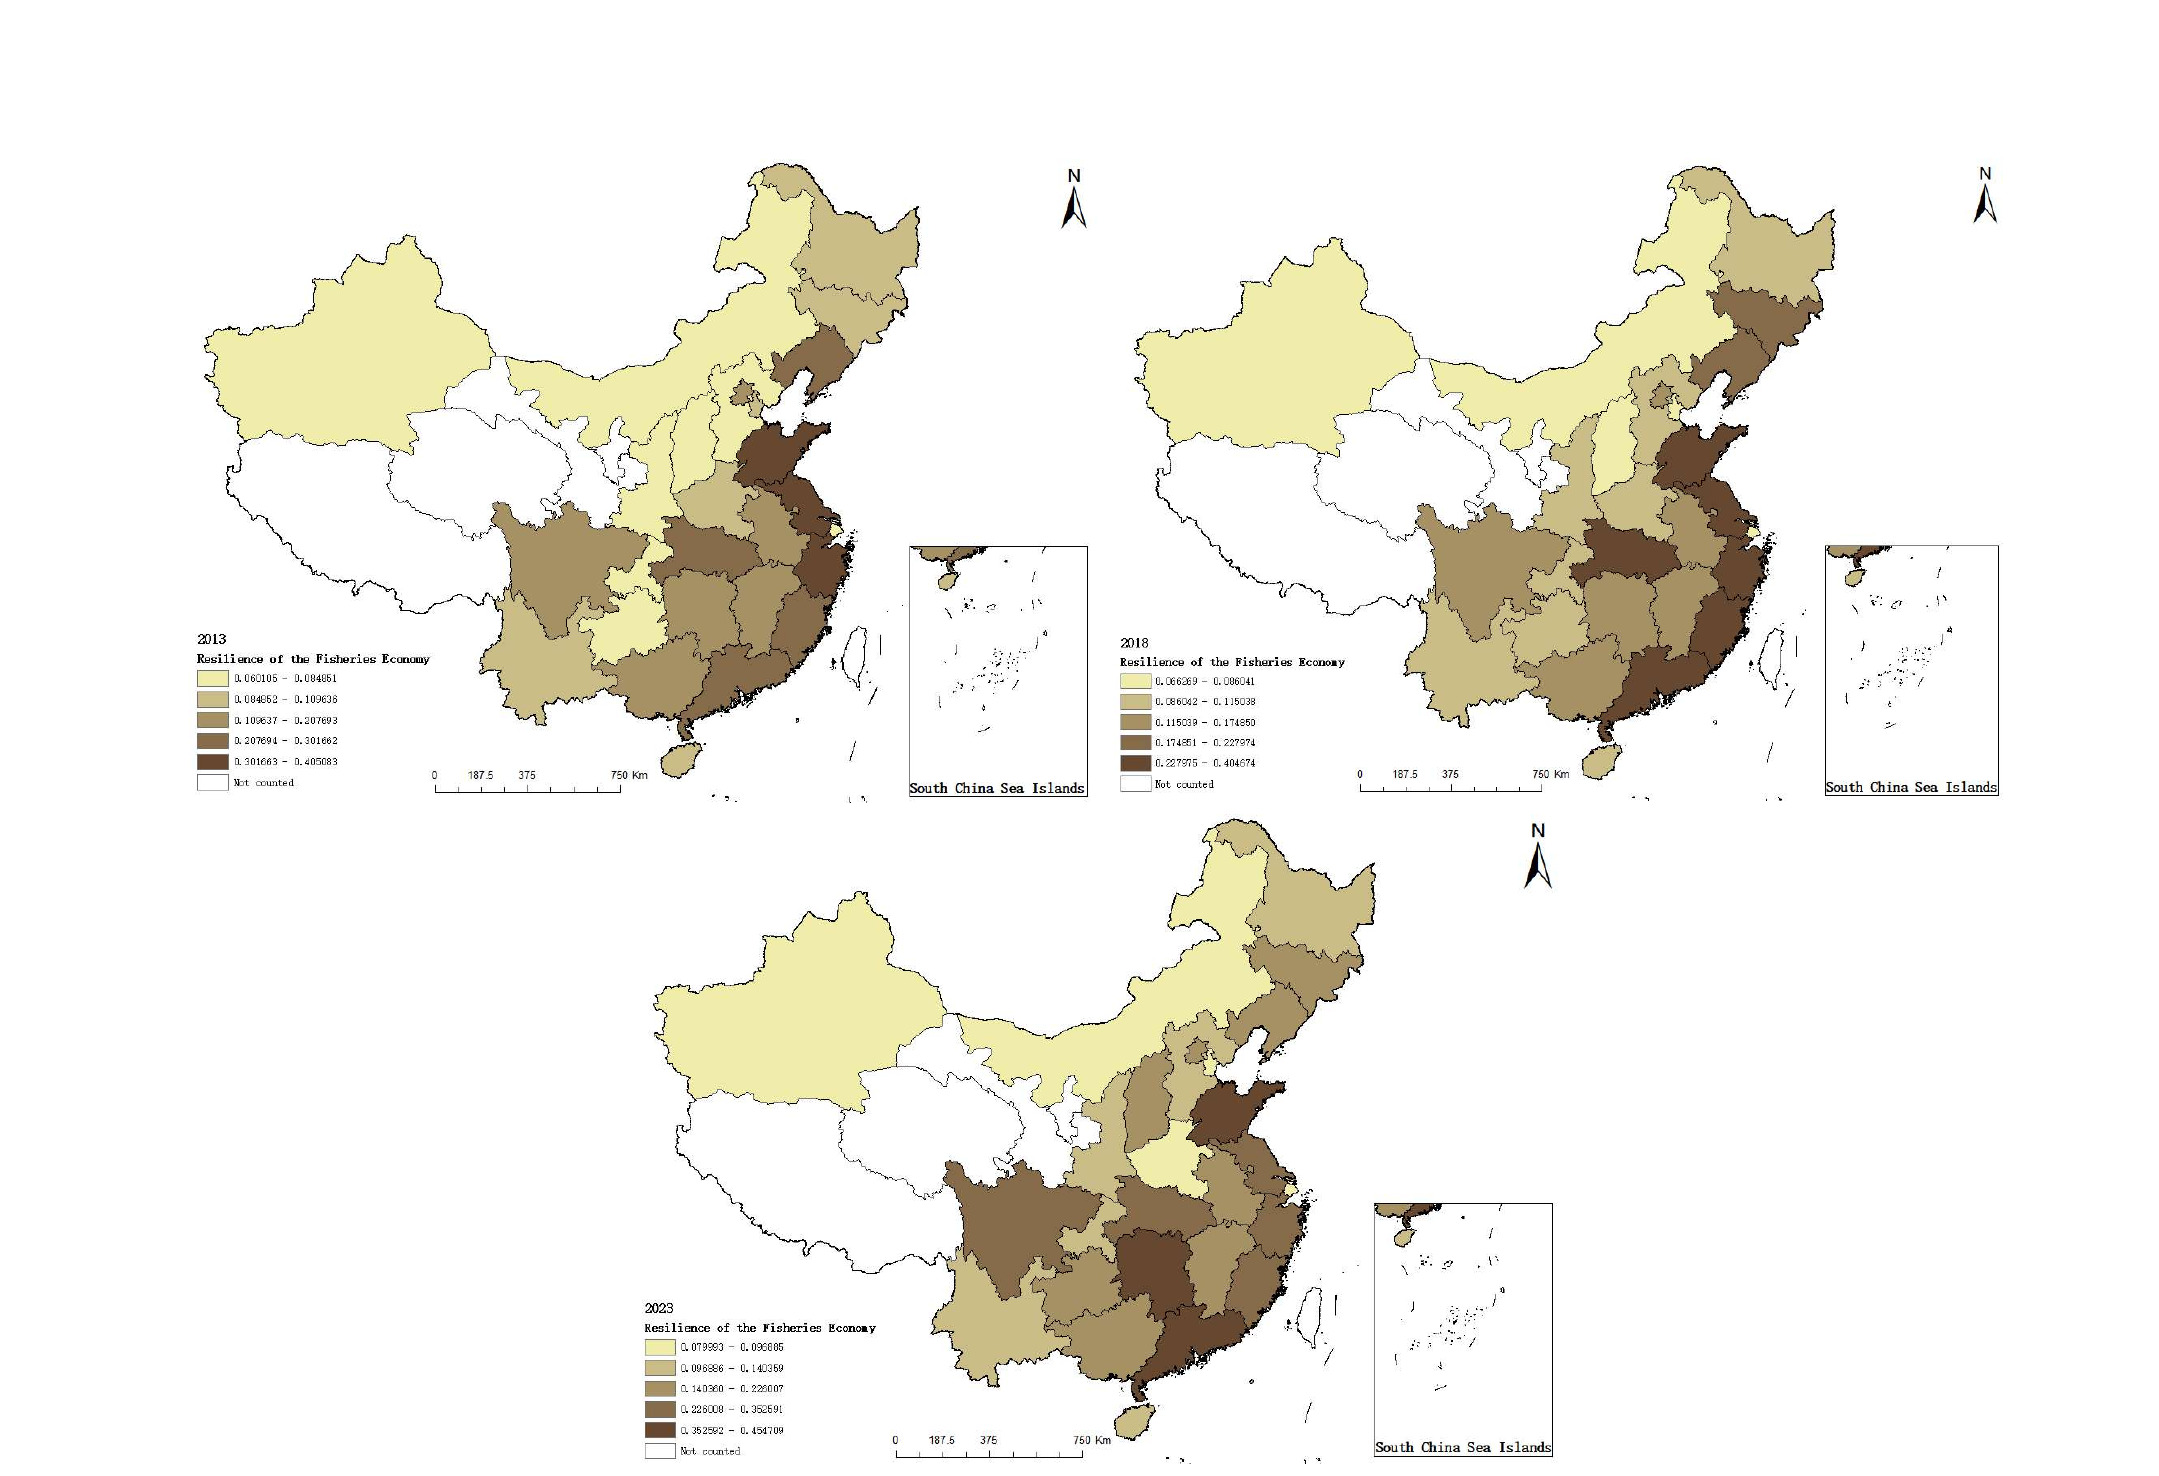
The spatial distribution of FER across provinces further confirms the overall pattern of “high in the east and low in the west” (Figure 2). High-resilience provinces are mainly concentrated along the eastern coast, including Guangdong, Zhejiang, Fujian, Shandong, and Jiangsu. These regions, with favorable resource endowments, well-developed infrastructure, strong industrial agglomeration, and innovation capacity, have built relatively robust fishery-based economic systems. In contrast, inland and western regions such as Xinjiang, Shaanxi, and Inner Mongolia are constrained by limited water resources, weak industrial foundations, and short industrial chains, resulting in generally low resilience levels.
Regional disparities in internal resilience are also quite pronounced. The eastern region shows particularly prominent internal differences, with the highest-resilience province (Shandong, 0.4032) and the lowest-resilience province (Shanghai, 0.0737) differing by more than fivefold. Within the central region, Hubei(0.3058) is significantly higher than Henan (0.0970), reflecting obvious structural differences. Although the western region as a whole has a relatively low level, provinces such as Sichuan and Yunnan perform relatively well in resilience due to better aquaculture conditions and regional market support.
3.2. Structural Characteristics of the Overall, Individual, and Block Model of the Spatial Correlation Network of FER
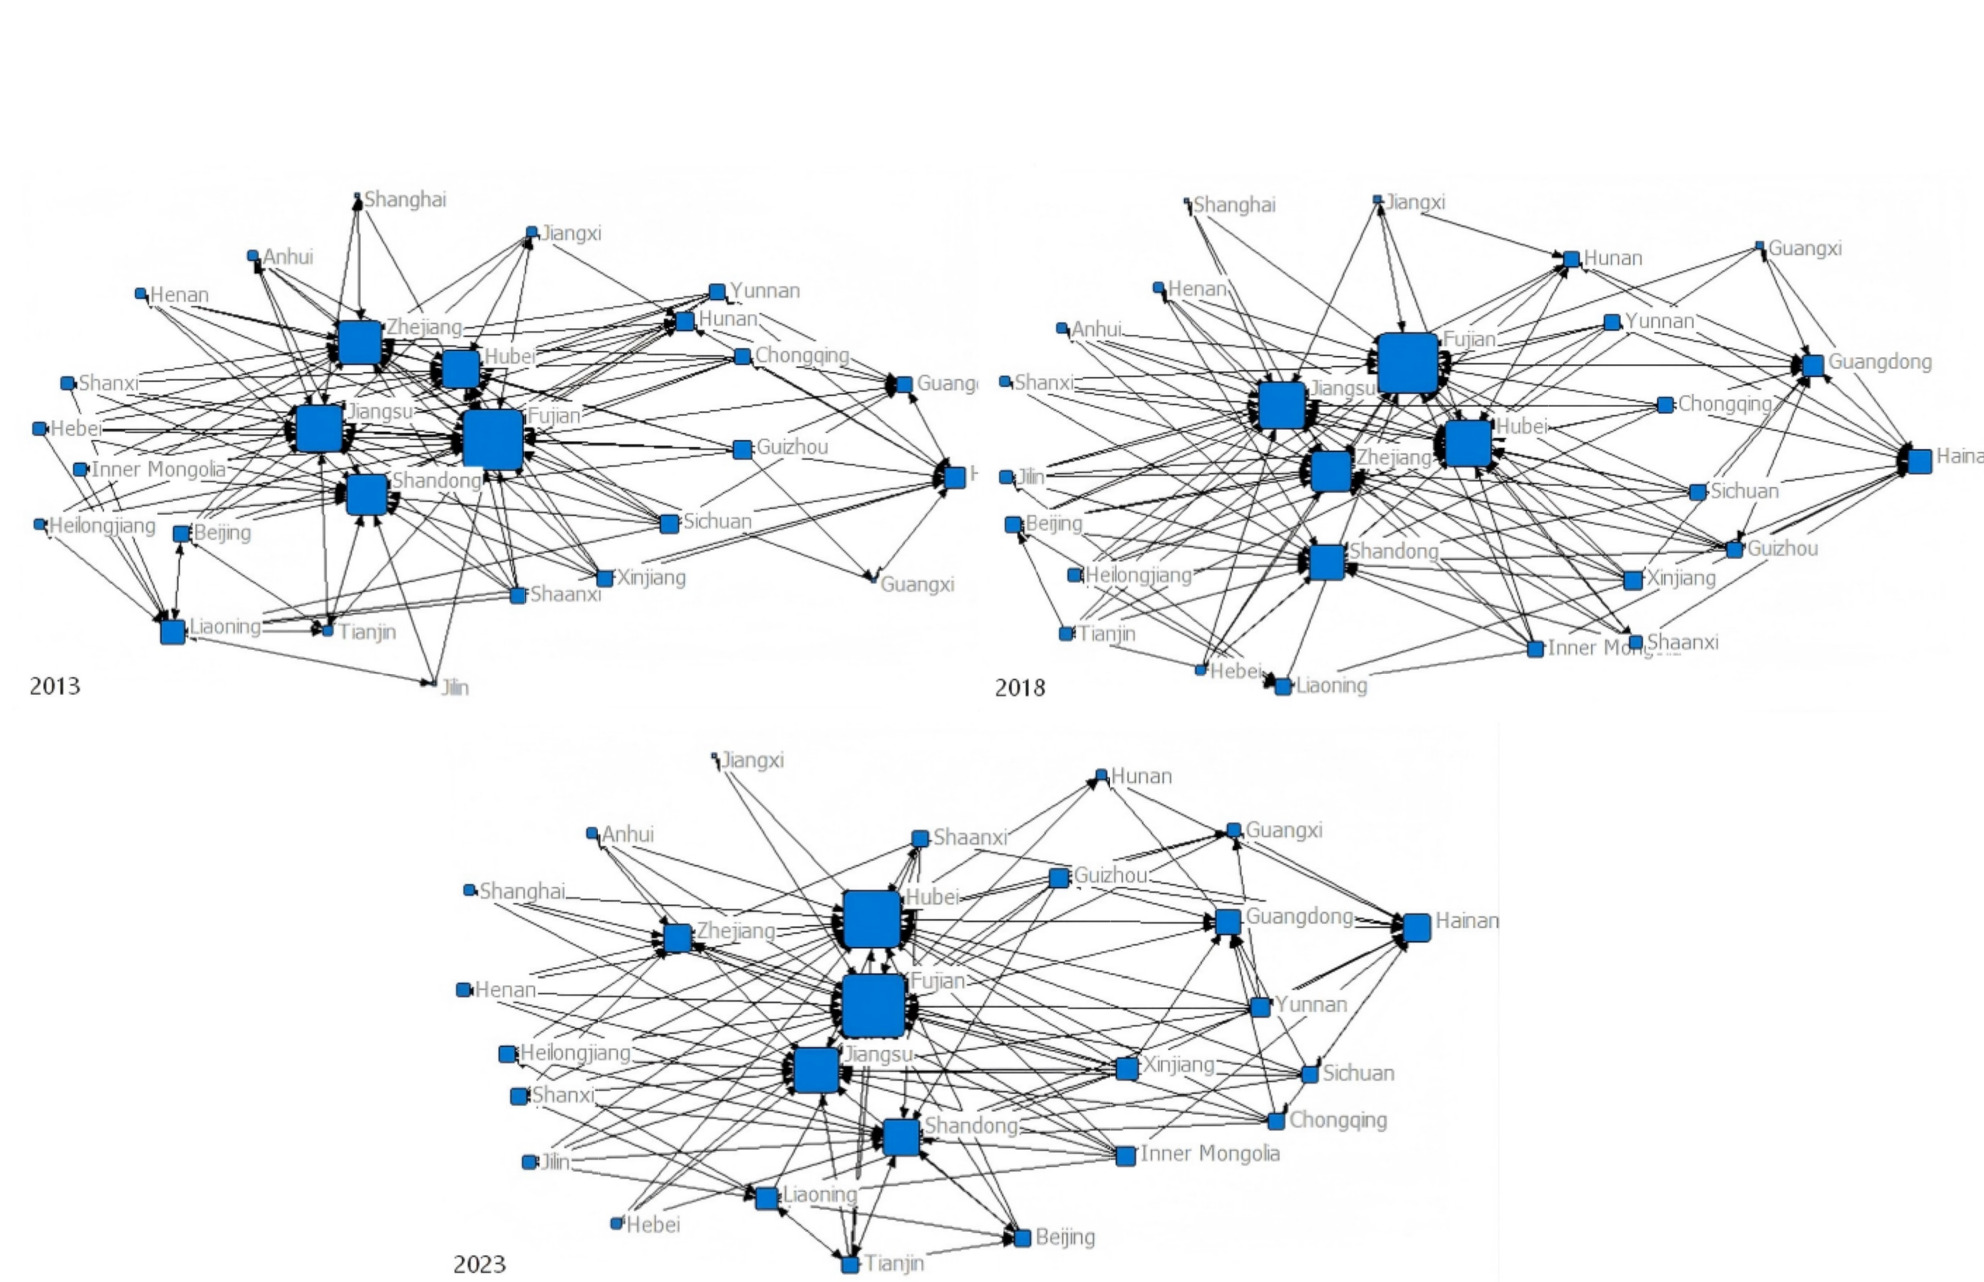
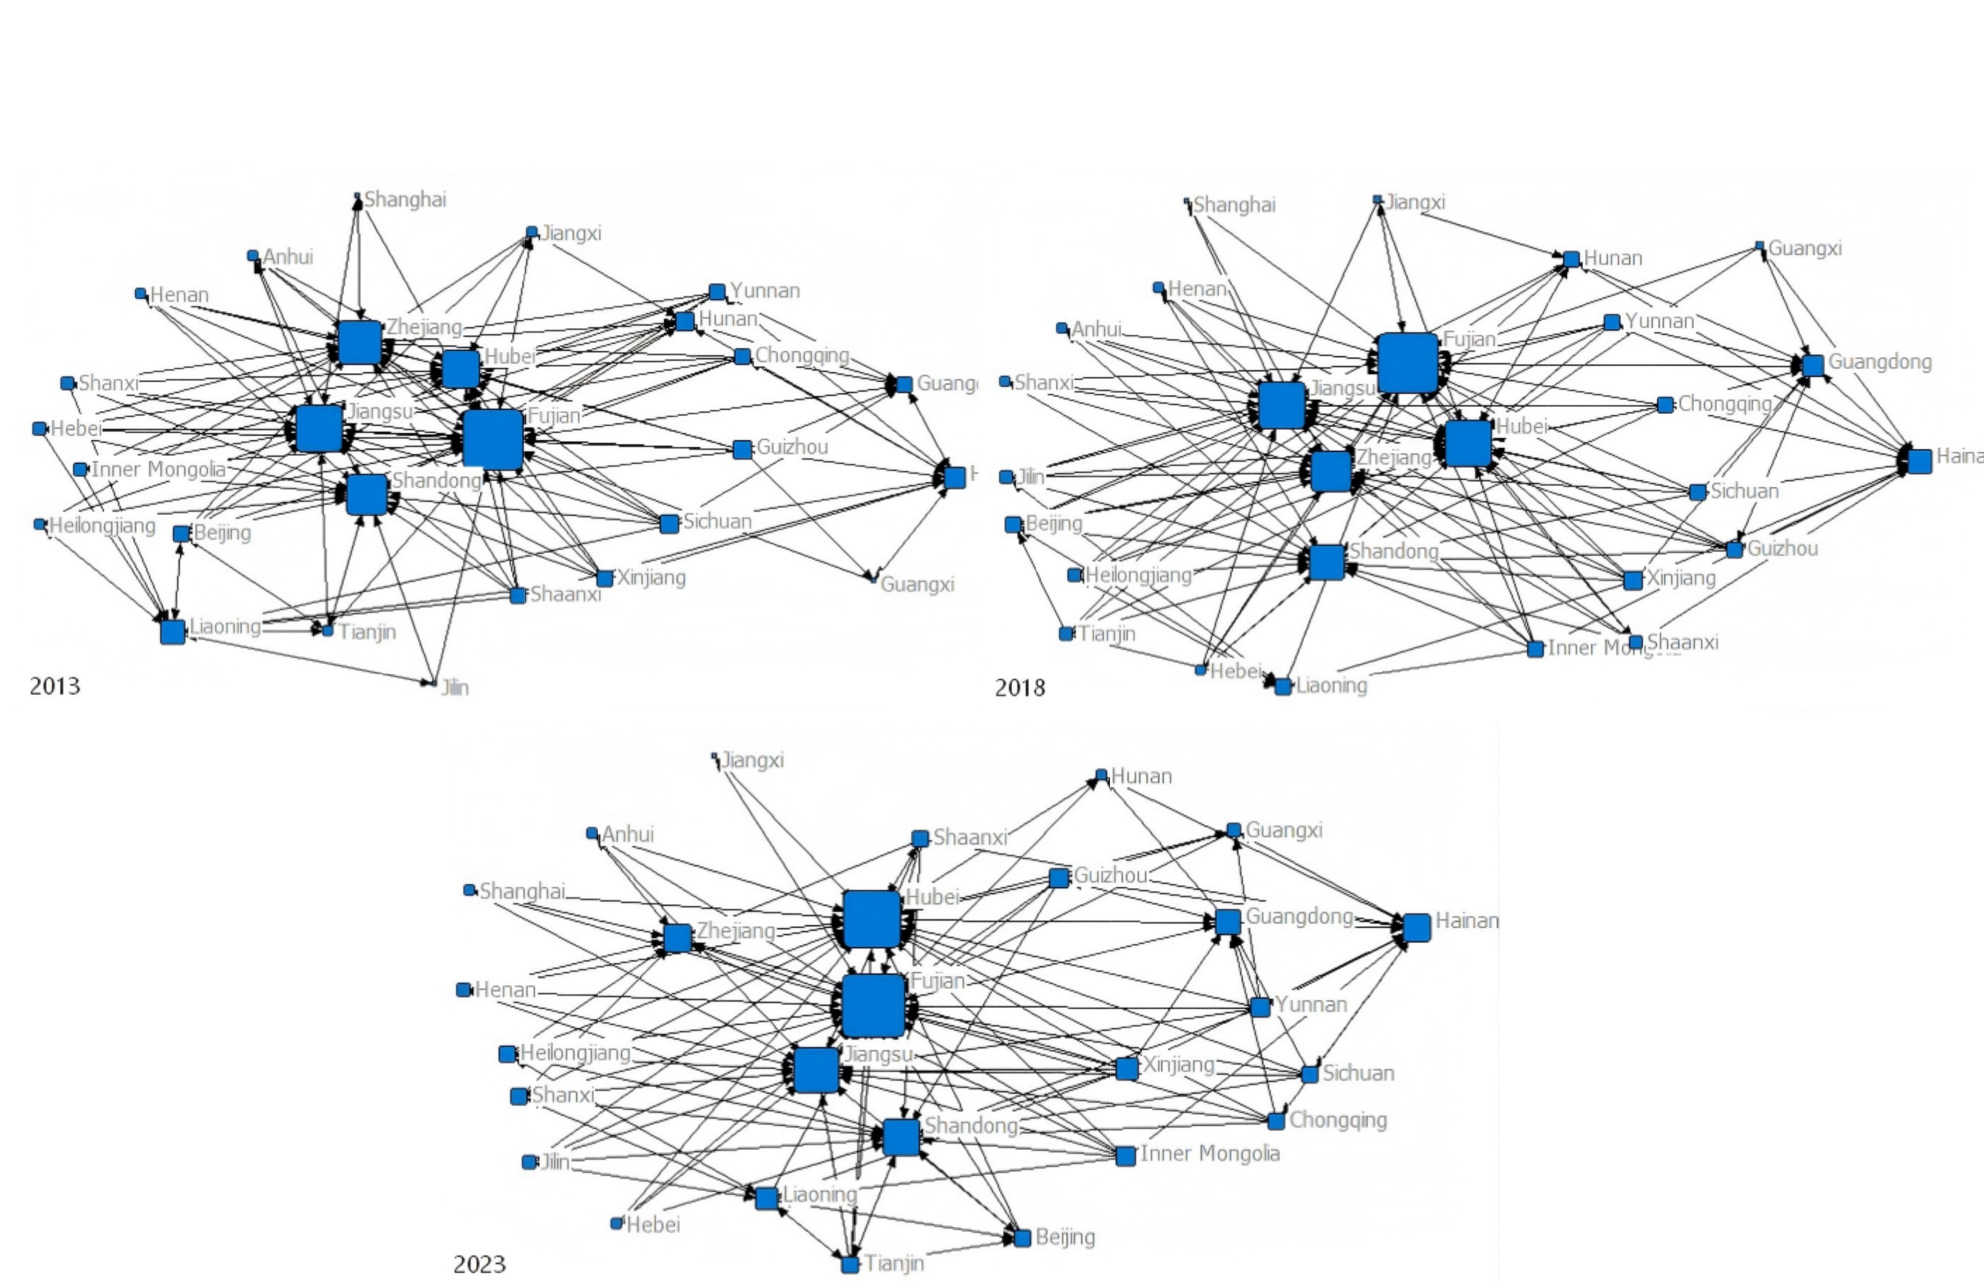
Based on the modified gravity model, this study calculates the spatial correlation strength of FER among provinces and constructs the spatial correlation matrix for 2013–2023 accordingly. Network topology diagrams are plotted using Ucinet software (selected years are shown in Figure 3). The results indicate that complex spatial network structures spanning regions were formed each year, demonstrating that resilience development exhibits significant spatial interaction and dependence.
3.2.1. Analysis of the Overall Structural Characteristics of the Spatial Correlation Network
The spatial correlation network of China’s FER exhibited systematic structural evolution characteristics during 2013–2023 (Table 2). The network correlation degree was consistently 1, indicating that all provinces were incorporated into a unified system with no isolated nodes. The network hierarchy decreased from 0.2069 to 0.1429, reaching its lowest value of 0.0741 in 2022, indicating a weakening of the core–periphery structure and enhanced regional synergy. The network efficiency increased from 0.7323 to 0.7477, suggesting more refined factor flow paths. The network density adjusted from 0.2137 to 0.2023, and the number of network relations decreased from 150 to 142, indicating that the network structure became increasingly compact.
3.2.2. Analysis of Individual Structural Characteristics of the Spatial Correlation Network
To reveal the relative status and functions of each province within the network, this paper analyzes the structural characteristics of the FER spatial association network using three indicators: in-degree centrality, in-closeness centrality, and betweenness centrality (Tables 3, 4, 5). On the whole, eastern coastal provinces remain at the core of the network by virtue of their comprehensive advantages; central provinces, represented by Hubei, have continuously enhanced their hub status by virtue of their locational and circulation advantages; while western provinces are generally at the periphery, though the connectivity role of certain provinces within the network has been strengthened.
-
Analysis of in-degree centrality
In-degree centrality reflects the number of associations a node receives, indicating its convergence and capacity for influence within the network. The national overall mean fluctuates slightly between 20.23 and 22.08, showing no monotonic trend. The mean value for the eastern region is approximately 36.40, with Fujian, Jiangsu, Zhejiang, and Shandong consistently leading, indicating that these provinces exhibit relatively strong factor convergence and absorption capacity within the network, mainly due to their complete industrial chains, developed market systems, and technological advantages. The mean value of the central region is approximately 17.66, with Hubei performing exceptionally well at a level significantly above the regional mean, reflecting its hub status in the region. The mean value of the western region is only 3.98, generally low and situated at the periphery of the network. -
Analysis of in-closeness centrality
In-closeness centrality measures the ease with which associations initiated by other provinces can reach a given province; a higher value indicates that the province is more likely to be rapidly associated by other nodes in the network. The national mean fluctuates between 42.21 and 45.14. The in-closeness centrality of the eastern region is generally leading, with Fujian, Jiangsu, Zhejiang, and Shandong ranking among the top, indicating that other provinces can transmit resilience factors to these provinces through relatively short paths, and that their attractiveness as destinations within the network is relatively strong. Hubei in the central region is comparable to the core eastern provinces; while the western region is generally low and situated at an extremely peripheral position, making it difficult for other provinces to transmit associations to it through effective paths. -
Analysis of betweenness centrality
Betweenness centrality characterizes a node’s capacity to serve as a bridge between other nodes; a higher value indicates a stronger capacity of the province to regulate resource flows within the network. The national overall mean fluctuates between 4.23 and 5.58. The mean value of the eastern region is significantly higher than those of the central and western regions. Within the eastern region, betweenness centrality exhibits pronounced differentiation: Shandong, Fujian, and Hainan rank among the top, while provinces such as Beijing, Tianjin, Shanghai, and Hebei have relatively low betweenness centrality, indicating that functional differentiation also exists within the eastern region—some provinces assume core hub functions, whereas others, despite being widely connected, play only a limited intermediary role in resource allocation. In the central region, Hubei’s betweenness centrality has been steadily increasing, making it a key bridge for connecting flows between the east and the west; Henan and Anhui also serve certain intermediary functions. The betweenness centrality of the western region is generally low, indicating limited capacity to control network resource flows.
3.3. Analysis of Block Model Characteristics of the Spatial Correlation Network
To further reveal the structural differentiation and functional coordination within the network, this paper employs the CONCOR module in UCINET with the criteria of depth set to 2 and convergence set to 0.2 to divide the FER spatial association network from 2013 to 2023 into blocks. The results show that the network has formed four major blocks with relatively clear functions and relatively stable structures (Table 6). The spillover–benefit relationships among blocks constitute the main body of network connections, reflecting pronounced functional differentiation and spatial imbalance in factor flows. The net benefit block is mainly composed of strong fishery provinces in the eastern coastal region, maintaining a high scale of factor reception over the long term, serving as the primary net inflow area within the network and reflecting its leading and agglomeration role. The net spillover block covers Beijing, Tianjin, Hebei, and most central and western provinces, with its scale continuously expanding; its outward spillover relationships significantly exceed inward reception, and its function as a factor exporter has been continuously strengthened, reflecting the supportive role of the central and western regions in the national fishery resilience system. The two-way spillover block exhibits notable changes in membership, expanding from its initial members (Liaoning and Shandong) to include Guangdong, Jiangxi, Guangxi, Hunan, Zhejiang, and others; while factors flow in both directions, internal connections remain weak, exhibiting transitional attributes. The broker block assumes the role of an intermediary bridge, with its membership dynamically adjusting from multiple provinces to Shandong and Liaoning, maintaining a balance between reception and spillover, and serving as an important hub for preserving network structural integrity. The changes in block membership reflect the dynamic adjustment of functional structures, and the network presents a clear factor allocation pattern of “eastern regions benefiting, central and western regions spilling over.” The eastern coastal region relies on its industrial and technological advantages to assume a leading role, while the central and western regions rely on their resource endowments to play output- and support-role functions. The dynamic evolution of functional differentiation promotes the deepening of the FER system’s development toward collaborative integration.
3.4. Analysis of Driving Factors
Based on QAP regression analysis, with the number of random permutations set to 2000, this paper examines the driving mechanism of the spatial correlation network of FER from five dimensions: differences in fiscal support for agriculture, differences in geographic distance, differences in per capita GDP, differences in the level of aquatic technology extension, and differences in the proportion of feed and seedling input costs. The results are shown in Table 7.
-
The overall influence of fiscal support for agriculture (Gov-Sup) is relatively weak. During the study period, the coefficients of this variable were negative in most years and ceased to be significant after 2019, indicating that the impact of fiscal support differences on the FER spatial association network is not stable, and that it is difficult to form a sustained network driving effect solely by relying on differences in fiscal input.
-
Geographical distance (Distance) exerts a consistently stable negative influence. Across all 11 years, the coefficients are negative and all pass the 1% significance test, indicating that geographical proximity has always been a fundamental factor promoting inter-provincial FER associations, which is consistent with the First Law of Geography. The inhibiting effect of geographical distance shows no significant attenuation over the sample period, reflecting that the cross-regional flow of fishery factors remains subject to the rigid constraints of transportation costs and spatial distance.
-
The influence of per capita GDP (PGDP) exhibits an inverted U-shaped pattern. From 2015 to 2021, the effect is significantly positive, indicating that the promoting effect of economic development disparity on network associations is subject to a threshold effect; once a certain level is exceeded, the driving role of growth poles tends to weaken.
-
The role of the number of aquatic technology promotion institution demonstration bases (Tech-Base) exhibits a phased strengthening trend. It shifts from non-significant to significantly positive, and although it fluctuates thereafter, it remains positive overall, indicating that technologically advanced regions have gradually become an important force in promoting regional resilience associations through knowledge spillovers.
-
The driving role of the proportion of feed and seedling costs (Feed-Seed) has been continuously strengthening. This variable shows a significantly positive influence in all years, with the coefficient gradually increasing from 0.099 in 2013 to 0.173 in 2023, indicating that differences in upstream industrial chain input capacity are a stable and increasingly critical factor shaping the FER spatial network. As core inputs in fishery production, feed and seedlings determine that their inter-provincial differences directly affect the depth and breadth of inter-regional industrial chain collaboration.
Overall, the formation of the FER spatial network is driven by the dual stable forces of geographical proximity and industrial chain dependence, with technology spillovers gradually becoming more prominent since 2018, while the influences of fiscal support and economic development level tend to weaken over time. This result indicates that the driving mechanism is gradually shifting from policy and growth-pole pulling toward a multi-dimensional collaborative stage co-dominated by technology, supply chains, and markets.
3.5. Robustness Test
To ensure the reliability of the QAP regression results and avoid the influence of subjectivity in the selection of the binarization cutoff for the gravity matrix on the research conclusions, this paper, following the approach of Wang et al.,51 further selects 90% and 110% of the mean gravity values of inter-provincial FER as alternative cutoffs, and reconstructs the binarized spatial association matrices for 2013, 2018, and 2023 as dependent variables for separate QAP regression analyses, in order to test the robustness of the original empirical results (Table 8). The results indicate that, whether using 90% or 110% of the mean gravity value as the cutoff, only the regression coefficient for fiscal support for agriculture in 2023 changes, and the significance results do not change substantially compared with the original results. Although the adjusted R2 varies slightly across cutoffs, it remains within a reasonable range overall, further validating the robustness of the benchmark regression results.
4. Discussion
4.1. The Deep Logic of the Coexistence of Regional Resilience Level Differentiation and High Network Connectivity
This study reveals that FER exhibits a gradient of “high in the east and low in the west,” while all provinces are incorporated into a fully connected spatial network, forming a distinctive pattern of long-term coexistence between horizontal differentiation and high connectivity. Its deep logic can be understood from two dimensions: resource dependence and product attributes. In the resource dimension, the absolute dependence of fisheries on natural aquatic conditions determines the basic contours of the pattern—the eastern coastal region, relying on natural fishing grounds, mature aquaculture waters, and long-accumulated industrial capital and cold-chain facilities, has formed risk resistance advantages that the central and western regions cannot replicate in the short term; the spatial lock-in of resource endowments explains why regional disparities have not converged. In the product dimension, the high perishability of aquatic products constitutes a rigid constraint on cross-regional coordination: the freshness preservation window of live products is measured in hours, compelling provinces to form high-density spatial associations in cold-chain logistics, emergency reserves, and production-marketing coordination, so that functional connectivity must be maintained even when resilience levels differ greatly.
Boundary conditions also merit attention. Eastern municipalities directly under the central government, such as Shanghai and Tianjin, are constrained by water area and industrial scale, and their resilience levels are instead lower than those of some central provinces such as Hubei and Hunan, indicating that the “high in the east and low in the west” pattern is not absolute geographical determinism, with industrial scale and resource carrying capacity constituting important moderating variables. At the same time, western provinces such as Sichuan and Yunnan, by virtue of their relatively good freshwater aquaculture foundations and regional market support, perform better than the regional mean, suggesting that local institutional arrangements can, to a certain extent, offset geographical disadvantages.
4.2. Structural Logic and Counterexamples of Network Structure from Efficiency Optimization to Risk Sharing
The network structure exhibits sustained optimization features of declining hierarchy degree and increasing efficiency, which shares similarities with observations in marine economic resilience networks,26 but the driving paths differ. The decline in hierarchy degree can be attributed to the synergistic effects of three mechanisms: the national fishery industry transfer policy promotes the extension of processing links to inland areas; the popularization of cold-chain logistics technology reduces cross-regional circulation barriers; and e-commerce and new business formats enable western specialty products to bypass traditional hierarchical levels and directly connect to consumer markets, thereby increasing the connectivity channels of peripheral nodes.
However, the overall trend does not automatically benefit all nodes. The in-degree centrality of some central provinces, such as Jiangxi and Anhui, actually declined during the sample period (Jiangxi from 11.54 to 7.69, Anhui from 19.23 to 15.39), which may stem from the “siphoning effect” generated by neighboring Hubei and Hunan through policy agglomeration and technological upgrading, leading to the concentration of factors such as capital and talent toward regional cores. This counterexample suggests that the overall de-hierarchization of the network is accompanied by intensified competitive differentiation within regions, which warrants differentiated attention in policy design.
4.3. The Dynamic Shift of Driving Mechanisms from Exogenous Policy Dominance to Endogenous Collaborative Dominance
The driving mechanisms exhibit a phased transition: geographical proximity consistently serves as a stable fundamental factor, while the remaining variables show temporal differentiation. In the early stage of the study (2013–2018), equalized fiscal support for agriculture was an important instrument for promoting regional coordination, with the number of network relationships peaking at 155 in 2019; however, diminishing marginal returns rendered it non-significant by 2023 (p = 0.435). In the later stage of the study (2018–2023), the influence of the proportion of feed and seedling costs (p decreasing from 0.045 to 0.007) continued to strengthen. From 2013 to 2023, the influence of aquatic technology promotion (p) decreased from 0.245 to 0.087, indicating that network associations are increasingly shaped by vertical industrial-chain division of labor and the input-supply network. The significance of per capita GDP was confined to the middle of the study period, displaying an episodic rather than sustained pattern. This implies that disparities in economic aggregate do not constitute a consistently stable driver of the network structure.
From the perspective of boundary conditions, the above-mentioned transformation is not synchronized across regions. Western provinces, due to their weak industrial chain support facilities and technological absorption capacity, may face the dilemma of insufficient continuity of endogenous momentum after the withdrawal of fiscal support for agriculture. Therefore, differentiated strategies are particularly necessary. The eastern region should strengthen technology spillovers and industrial chain integration; the central region should consolidate its hub function for the flow of factors between the east and the west; and the western region still needs external policy support for a relatively long period, and should gradually shift to an endogenous-driven track after its industrial base is strengthened.
4.4. Research Limitations
-
The adjusted R2 of the QAP regression model ranges from 0.056 to 0.092. Although the model passes the significance test at the 1% level in all years, its overall explanatory power is relatively low. This is to some extent common in relational data regression, as the gravity matrix itself contains substantial structural noise, and network formation is influenced by multi-level interacting factors that are difficult to be fully explained by a limited set of variables; nevertheless, it also indicates that important driving factors remain to be explored.
-
Tibet, Qinghai, Gansu, and Ningxia were excluded due to systematic missingness of key indicators. Since one of the core findings of this study is the spatial gradient pattern of “high in the east and low in the west,” and all four excluded provinces are less-developed western regions, their exclusion may lead to an underestimation of the regional resilience gap, thus exerting a certain impact on the accuracy of judgment regarding the overall national pattern.
-
The spatial association intensity is calculated based on the modified gravity model, which relies on the specified form of squared geographical distance and per capita fishery GDP differences. Although this specification references existing literature, different parameter choices may lead to variations in the association matrix, thereby affecting the robustness of network characteristics and regression results.
-
QAP regression reveals statistical associations among variables rather than causal relationships. Although the selection of driving factors references a theoretical framework, in the absence of strict exogenous shocks or instrumental variables, it is inappropriate to overinterpret the regression results as causal inference.
5. Conclusions and Prospects
By constructing an integrated framework of “horizontal measurement—network analysis—driving factors,” this study systematically examines the spatiotemporal evolution, spatial correlation network structure, and driving factors of China’s FER from 2013 to 2023. The main conclusions are as follows: (1) FER presents a special pattern of coexistence of horizontal differentiation and high network connectivity, with all provinces being incorporated into a fully connected spatial correlation network, forming a mandatory pan-regional collaborative architecture. (2) The network structure continues to be optimized on the basis of maintaining full connectivity, manifested as declining hierarchy and improving efficiency, while prioritizing the guarantee of the system’s capacity for joint prevention and control of risks. (3) The driving mechanism has shifted from exogenous policy- and growth-pole-driven to endogenous synergy of industrial chain and technology; fiscal support played a significant role in the early stage, while the influence of industrial chain dependence and technological spillover has become increasingly prominent in the later stage.
Based on the above conclusions, future research could be further expanded in the following directions: First, to deeply dissect the specific collaborative channels and cross-domain governance mechanisms underlying the high network connectivity. Second, to simulate the dynamic response and reconstruction processes of resilience networks by incorporating external shock scenarios such as climate change and trade friction. Third, to extend the analytical framework constructed in this study to other resource-based industries with similar systemic risks, conducting comparisons and validations to enhance the universality and explanatory power of this framework.
Acknowledgments
This study is supported by the following project: Shandong Provincial Social Science Planning Project “Research on the Energy Level Transition of Shandong Marine Industry Innovation Ecosystem from the Perspective of Four Chain Integration” (Project No. 25CJJJ12) and Research on the Transformation, Upgrading, and Innovative Development of Traditional Industries Driven by New Quality Productive Forces, Qingdao Agricultural University (Project No. 660/2424778)
Authors’ Contribution
Conceptualization: Lingling Wang (Equal), Yuantong Gong (Equal), Lin Li (Equal). Funding acquisition: Lingling Wang (Lead). Supervision: Lingling Wang (Equal), Lin Li (Equal). Writing – original draft: Lingling Wang (Lead). Writing – review & editing: Lingling Wang (Equal), Panpan Zhang (Equal), Yuantong Gong (Equal), Lin Li (Equal). Data curation: Panpan Zhang (Lead). Formal Analysis: Panpan Zhang (Lead). Methodology: Panpan Zhang (Equal), Yuantong Gong (Equal). Validation: Panpan Zhang (Equal), Yuantong Gong (Equal). Visualization: Panpan Zhang (Lead).
Competing of Interest – COPE
No competing interests were disclosed.
Ethical Conduct Approval – IACUC
Not applicable. This work does not involve animals or plants.
Informed Consent Statement
All authors and institutions have confirmed this manuscript for publication.
Data Availability Statement
All are available upon reasonable request.