
_injecti.tiff)
_over_time_(days)_for_control_and_various_d.tiff)
_between_st.tiff)
_functional_classification_of_degs_in_zebrafish_liver_induced_by_stz.tiff)
_in_zebrafish_liver_in.tiff)
1. Introduction
Diabetes mellitus (DM), a globally prevalent metabolic disorder characterized by chronic hyperglycemia and impaired glucose homeostasis, poses a severe threat to public health due to its high incidence, complex pathogenesis, and associated complications such as cardiovascular disease, nephropathy, and neuropathy.1,2 The exploration of reliable animal models is critical for deciphering the pathological mechanisms of diabetes, screening potential therapeutic agents, and optimizing clinical intervention strategies. While mammalian models (e.g., mice, rats) have been widely used in diabetes research, they are limited by high experimental costs, long breeding cycles, and ethical constraints, prompting the need for alternative model organisms with complementary advantages.3
Zebrafish (Danio rerio) has emerged as a promising vertebrate model in metabolic disease research owing to its high genetic homology with humans (sharing ~70% of protein-coding genes and ~84% of disease-related genes), rapid development, large brood size, and transparent larvae that facilitate in vivo observation.4,5 In the context of diabetes research, adult zebrafish exhibit conserved glucose metabolic pathways, including insulin synthesis and secretion by pancreatic β-cells, insulin-dependent glucose uptake by peripheral tissues, and hepatic gluconeogenesis regulation—key processes disrupted in the diabetic state.6 These characteristics enable zebrafish to recapitulate core pathological features of human diabetes, making it an ideal model for studying glucose homeostasis disorders.
Streptozotocin (STZ), a naturally occurring nitrosourea compound, is commonly used to induce experimental diabetes by selectively damaging pancreatic β-cells.7 Its mechanism of action involves oxidative stress induction, DNA alkylation, and subsequent β-cell apoptosis, leading to insulin deficiency and hyperglycemia.8,9 While STZ-induced diabetes models have been well-established in mammals, the application of STZ in zebrafish remains inconsistent due to variations in experimental protocols (e.g., injection dose, frequency, and post-treatment temperature) and ambiguous outcomes regarding glucose metabolism and tissue toxicity.10 Previous studies have reported conflicting results: some showed STZ-induced hyperglycemia in zebrafish, while others observed no significant glucose elevation or even hypoglycemia, possibly attributed to species-specific differences in STZ sensitivity and metabolic adaptation.10,11 Additionally, high-dose STZ has been associated with non-specific toxicity in zebrafish, including tissue damage at injection sites.12 However, to the best of our knowledge, no prior study has systematically combined dose-ranging survival, glycemic, histopathological, and transcriptomic endpoints to comprehensively evaluate STZ toxicity in adult zebrafish. Consequently, the underlying molecular mechanisms of these non-specific toxic effects remain poorly understood.
The liver, as a central organ in glucose metabolism, plays a pivotal role in maintaining glucose homeostasis by regulating glycogen synthesis, glycogenolysis, and gluconeogenesis.13 In diabetic states, hepatic metabolic dysfunction exacerbates hyperglycemia, and liver damage further contributes to disease progression.10 Transcriptome sequencing (RNA-seq) has become a powerful tool for investigating global changes in gene expression and identifying key pathways involved in pathological processes. By analyzing the liver transcriptome of STZ-induced zebrafish, we can identify differentially expressed genes (DEGs) and enriched pathways associated with STZ toxicity and glucose metabolic disorders, providing insights into the molecular basis of the liver’s response to STZ-induced stress.
In this study, we aimed to systematically evaluate the toxic effects of STZ in zebrafish and to explore the underlying molecular mechanisms of hepatotoxicity using liver transcriptome profiling. Rather than establishing a standardized diabetic model, this study provides a rigorous toxicological characterization and a crucial cautionary framework for the application of STZ in zebrafish research. Furthermore, it reveals the molecular mechanisms underlying STZ-induced metabolic collapse and non-specific liver damage, laying a critical foundation for optimizing future metabolic disease modeling strategies.
2. Materials and methods
2.1. Animals
The AB strain wild-type zebrafish (Danio rerio) used in this experiment were purchased from the Wuhan Jiangxia Wanwuyuan Experimental Equipment Business Department. They were approximately 6 months old and in good health. The rearing water for zebrafish was tap water aerated and filtered through activated carbon for more than 24 hours. Wild-type, age-matched zebrafish (4–6 months old) with an equal gender ratio were used for all experiments, and fed brine shrimp and commercial feed regularly every morning and evening. Fish tanks were cleaned weekly to maintain water quality. The temperature of the fish room was maintained at (28.0±1.0) ℃, with a light-dark cycle of 14-hour light/10-hour dark.
2.2. Streptozotocin Injection
The zebrafish were anesthetized by brief exposure to chilled water at 15°C and 5°C for several seconds prior to streptozotocin (STZ) injection.10 This hypothermic anesthesia approach was specifically chosen over the conventional MS-222 (tricaine) to prevent anesthetic-induced neuroendocrine stress and subsequent hyperglycemia, thereby avoiding chemical interference with our metabolic assessments.14 For intraperitoneal (i.p.) injection, insulin syringes fitted with 28.5-gauge needles were used to deliver 0.3% STZ (Sigma-Aldrich, Cat. No. S0130, St. Louis, MO, USA) dissolved in 5 mM citrate buffer (pH 5.0) at doses of 50, 100, 150, 200, 250, 300, and 350 mg/kg. Fish in the control group were injected with an equal volume of citrate buffer alone. The injection timeline is illustrated in Figure 1, and all zebrafish were maintained at a constant temperature of 25℃ throughout the entire diabetes induction and maintenance phases post-injection.
_injecti.tiff)
2.3. Survival Rate Statistics
After STZ injection, all zebrafish in each group (n=15 per group, 8 groups in total) were observed daily from day 14 to day 22 post initial injection. The number of surviving fish in each group was recorded at the same time every day, and the survival rate was calculated as follows: Survival rate (%) = (Number of surviving fish / Total number of fish in the group) × 100%. Data were presented as mean ± SEM, and survival curves were plotted using GraphPad Prism 9 software.
2.4. Blood glucose measurement
Zebrafish were fasted for 24 hours and then anesthetized by immersion in water at 15 and 5℃ for several seconds, respectively. As described above, this non-chemical anesthesia was essential for maintaining basal physiological glucose levels and preventing MS-222-induced hyperglycemia. After anesthesia, the caudal fin was transected, and blood glucose was measured using a Yuwell-580 glucose meter (Jiangsu Yuwell-POCT Biological Technology Co., Ltd.). The fasting blood glucose levels of 5 randomly selected fish per group (from the initial cohort of n=15 per group) were measured on day 23 post-injection, which corresponded to the transcriptome sampling time.
2.5. Histology analysis
Zebrafish were fixed in 4% buffered paraformaldehyde and paraffin-embedded. Tissues were sectioned into 5 µm slices (Leica RM2135 microtome), mounted on glass slides, and dried at 37 - 42℃ for 24 hours. After deparaffinization (anhydrous xylene, 2×5 min) and rehydration (gradient ethanol: 100%, 90%, 80%, 70%, 50%; 3 min each), slides were H&E-stained. Post-staining, dehydration (95% ethanol, 2×3 min; 100% ethanol, 2×3 min) and clearing (anhydrous xylene, 2×5 min) were performed. Slides were then rinsed with PBS, air-dried, and mounted with glycerol gelatin aqueous medium.
2.6. RNA extraction, library construction and transcriptome sequencing
To elucidate the molecular mechanisms of STZ-induced acute hepatotoxicity, liver tissues from the control group and the 350 mg/kg STZ-treated group were selected for transcriptome analysis. The total RNA was extracted from liver by Trizol reagent (Takara, Japan). The purity and concentration of RNA were determined using a Nano-Drop2000 spectrophotometer (Thermo, USA). RNA integrity number (RIN) was assessed, with the requirement that RQN ≥ 4.5 (Table S1). Library preparation was performed according to the instructions of the Illumina TruSeq RNA sample preparation kit (Illumina, San Diego, CA, USA) to construct non-stranded mRNA libraries. The synthesized libraries were then sequenced on the Illumina NovaSeq 6000 platform at Majorbio Biotech Co., Ltd. (Shanghai, China), using a paired-end strategy, yielding an average sequencing depth of approximately 40 million raw reads (exceeding 5.45 Gb of clean data) per sample.
2.7 RNA-seq analysis
FastQC was used to assess sequencing data quality, followed by filtering to obtain high-quality, clean reads. HISAT2 (version 2.2.1) was used to map the clean reads to the zebrafish reference genome (Danio rerio, GRCz11), and StringTie (version 2.1.2) was used for transcript assembly and expression-level quantification of the successfully aligned reads. Additionally, edgeR (version 3.14.0) was applied to perform differential gene expression analysis. To rigorously control for false positives in multiple testing, the significance threshold for identifying differentially expressed genes (DEGs) was set at a False Discovery Rate (FDR) < 0.05 and an absolute log2^(fold change)^ > 1. Finally, the GO and KEGG databases were used to conduct gene functional annotation and pathway enrichment analysis.
2.8 Statistical analysis
All samples were represented as biological replicates and presented as mean ± SEM. The one-way ANOVA was conducted using GraphPad Prism 9.5.1, and statistical significance was analyzed using Duncan’s new multiple-range test. Significance was determined at P < 0.05.
3. Results
3.1. The effect of STZ injection on fasting blood glucose levels (FBGLs) in zebrafish
To evaluate the impact of STZ on zebrafish glucose homeostasis, we assessed the fasting blood glucose levels (FBGLs) of zebrafish treated with different doses of STZ (50, 100, 150, 200, 250, 300, and 350 mg/kg) and compared them with the citrate buffer (control) group.
3.1.1. Morphological changes in zebrafish after STZ injection
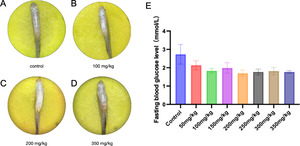
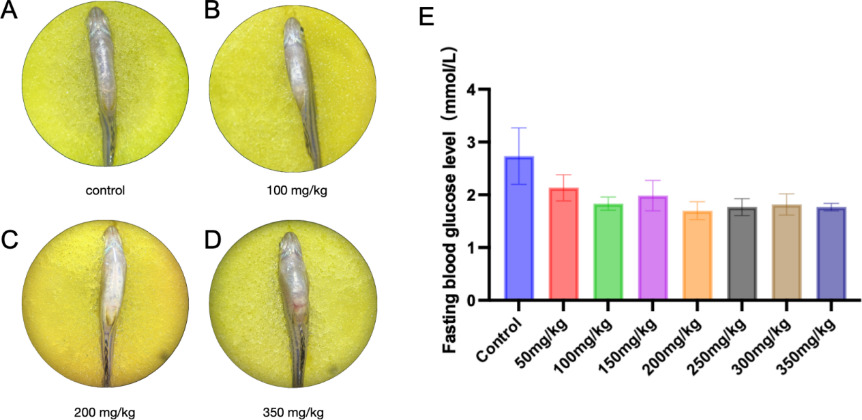
As shown in Figure 2 (A-D), the zebrafish in the control group (A) exhibited normal morphology. At a STZ dose of 100 mg/kg (B), no obvious morphological abnormalities were observed. However, zebrafish treated with 200 mg/kg STZ (C) showed abdominal swelling. In contrast, the zebrafish in the 350 mg/kg STZ group (D) displayed severe tissue damage at the injection site, with more pronounced abdominal swelling. These results indicate that high doses of STZ can induce toxic effects.
3.1.2. Fasting blood glucose level changes
The FBGLs of zebrafish in each group were measured and presented in Figure 2 (E). The control group had a FBGL of approximately 2.7 mmol/L. Compared with the control group, zebrafish treated with 50 mg/kg STZ showed a slight decrease in FBGL (around 2.1 mmol/L), while those in the 100 mg/kg STZ group had a FBGL of about 1.8 mmol/L. The FBGLs of zebrafish in the 150, 200, 250, 300, and 350 mg/kg STZ groups were approximately 2.0, 1.7, 1.8, 1.9, and 1.8 mmol/L, respectively. These results suggest that STZ injection at the tested doses does not increase zebrafish FBGLs; instead, there is a trend toward decreased glucose levels, possibly due to STZ-induced toxicity that disrupts normal metabolic processes.
3.2. Survival rate of zebrafish under different STZ dose interventions
To assess the toxicity of STZ on zebrafish survival, we monitored the survival probability of zebrafish treated with various STZ doses (50, 100, 150, 200, 250, 300, and 350 mg/kg) over a 10-day period.
As shown in Figure 3 (Overall Survival), the control group and the 50 mg/kg STZ group maintained a 100% survival rate throughout the 10-day observation period. The 100 mg/kg STZ group also showed no mortality, with a consistent 100% survival probability. In contrast, zebrafish in the 150 mg/kg STZ group began to exhibit mortality from day 6 onward, with the survival rate dropping to approximately 30% by day 10. The 200 mg/kg STZ group showed a survival rate of 50% starting on day 6, which remained stable until day 10. For the 250 mg/kg STZ group, mortality started at day 4, and all fish in this group died by day 8. The 300 mg/kg STZ group experienced a sharp decline in survival rate from day 4, with all fish succumbing by day 6. Similarly, the 350 mg/kg STZ group showed 100% survival only until day 4, after which all fish died by day 6.
These results clearly demonstrate that STZ doses at or above 150 mg/kg induce significant mortality in zebrafish, with higher doses (250, 300, and 350 mg/kg) resulting in rapid, complete mortality within 4-8 days. In contrast, doses of 100 mg/kg or lower do not affect zebrafish survival over the 10-day observation period.
_over_time_(days)_for_control_and_various_d.tiff)
3.3. Histological changes of zebrafish tissues after STZ injection
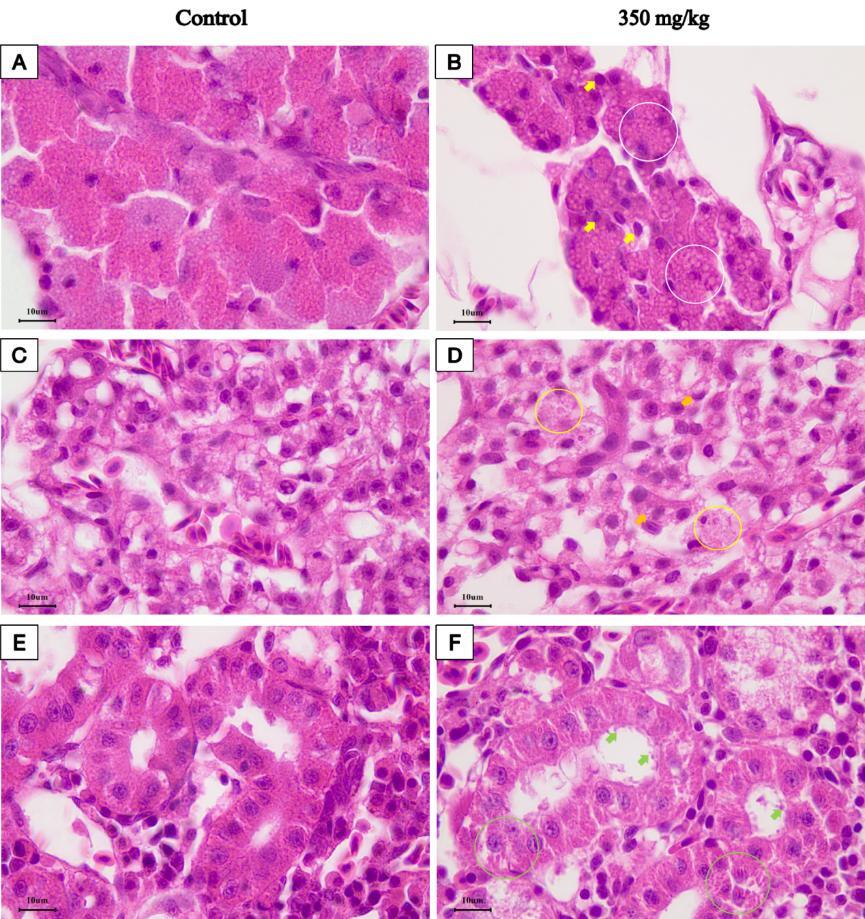
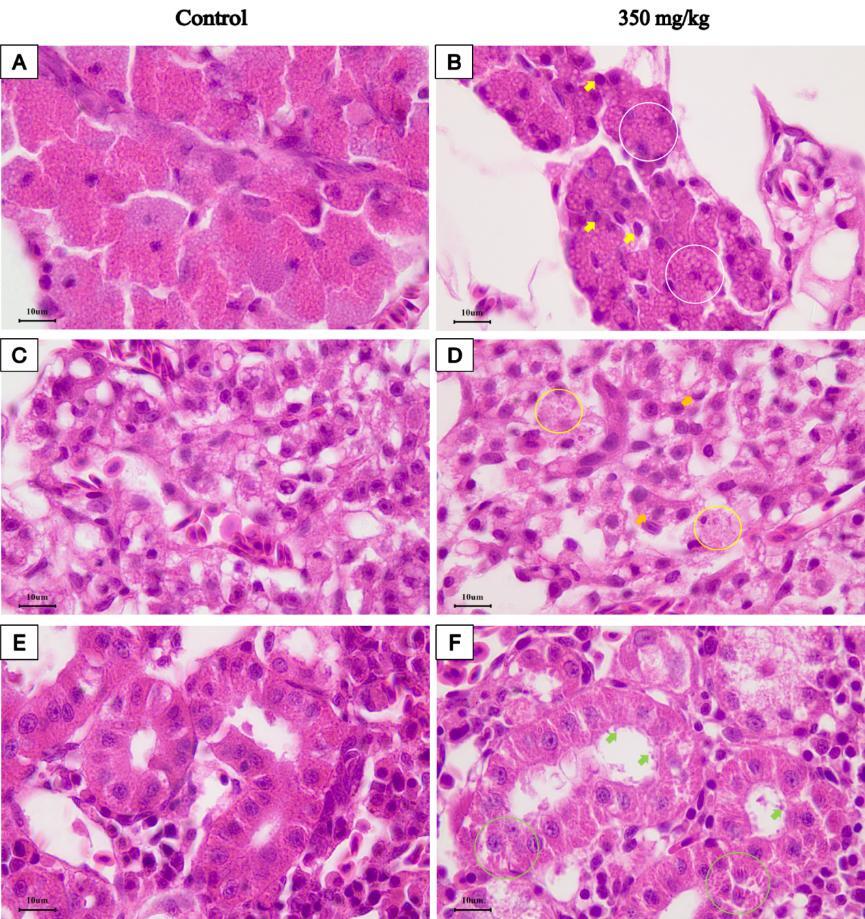
Given that high-dose STZ induced marked lethality and severe gross morphological abnormalities, we further assessed the structural damage inflicted by STZ on major metabolic and excretory organs, including the pancreas, liver, and kidneys, using histopathological examination. Histopathological analysis using H&E staining revealed significant morphological alterations induced by STZ in the examined tissues compared with the control group. In the pancreas, control islets displayed a compact and cohesive architecture, whereas the STZ-treated group exhibited marked structural disorganization, characterized by the loosening of cellular arrangement, intercellular edema, and nuclear pyknosis indicative of endocrine cell degeneration (Figure 4A, B). Hepatic tissue in the model group exhibited severe hepatocellular injury, characterized by intense cytoplasmic hypereosinophilia and granular degeneration with cellular dissociation, in sharp contrast to the normal polygonal hepatocytes and granular cytoplasm observed in controls (Figure 4C, D). Furthermore, renal histopathology revealed acute tubular injury (ATI) in the treated group, in which proximal tubules showed diffuse hydropic degeneration and marked epithelial swelling, resulting in luminal narrowing, unlike the intact, high-columnar epithelium and preserved tubular structure of the control group (Figure 4E, F).
3.4. Transcriptome analysis
Histological results confirmed severe liver damage. To explore the molecular mechanisms underlying this severe hepatotoxicity, we selected representative liver samples from the control group and the 350 mg/kg STZ-treated group for RNA-seq analysis.
3.4.1. Sequencing data quality control analysis
After de novo assembly, 241,189,124 clean reads were generated from six transcriptome libraries. With all libraries having Q30 >96.14% and the transcriptome’s average GC content at 45.84% (Table 1), the sequencing data were high-quality.
RNA-seq read mapping results (Table 2) showed total mapped rates of 87.45% - 94.40% (unique: 84.91% - 88.12%) in the control group and 88.27% - 89.76% (unique: 83.97% - 84.95%) in the diabetes group.
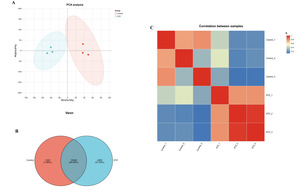
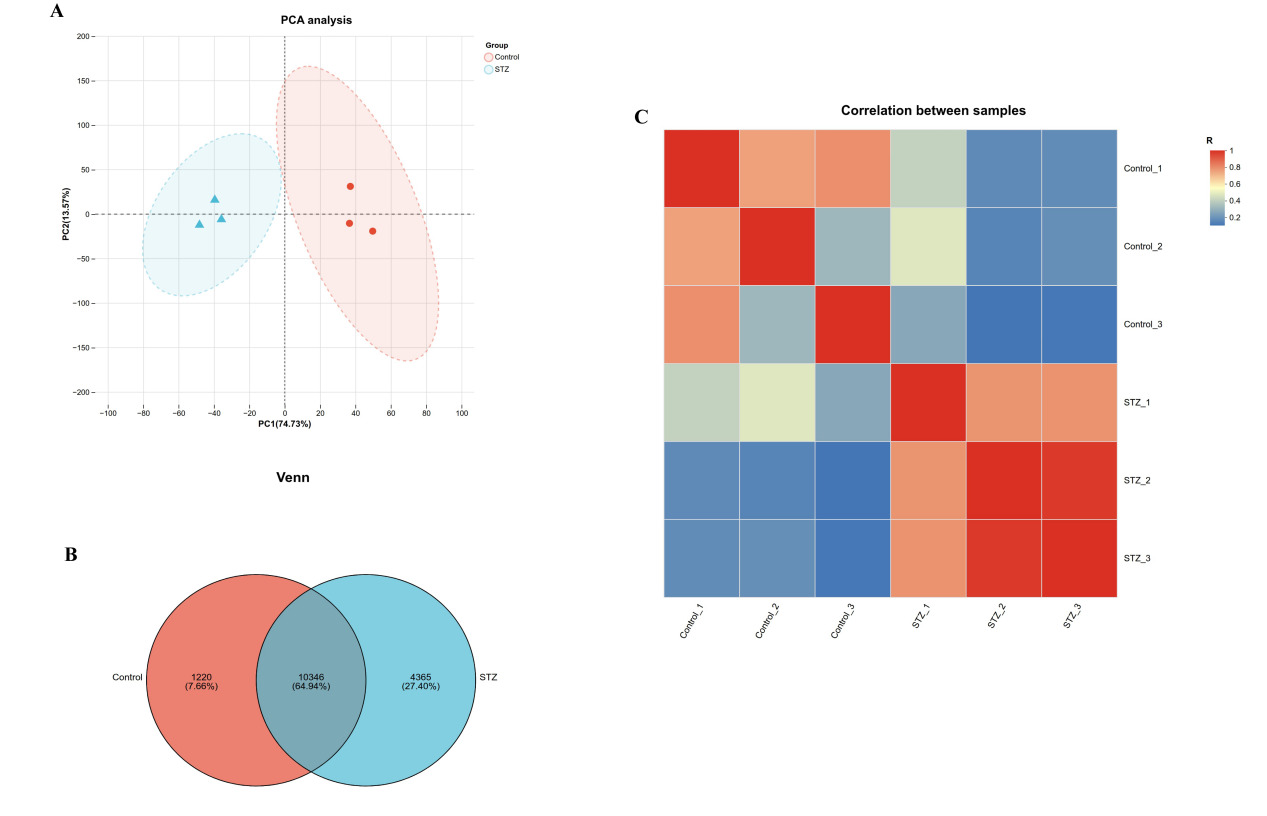
In addition, to characterize transcriptomic differences between control and STZ-treated samples, we performed principal component analysis (PCA), Venn diagram analysis, and sample correlation assessment (Figure 5). PCA (Figure 5A) showed distinct group clustering along PC1 (47.9% variance explained) and PC2 (17.7% variance explained), indicating marked transcriptomic divergence. The Venn diagram (Figure 5B) revealed 14,305 co-expressed genes (92.40%), 1,200 control-specific genes (7.86%), and 1,068 STZ-specific genes (6.94%). Sample correlation analysis (Figure 5C) validated reliability: intra-group samples had high pairwise correlations (R² > 0.85), while inter-group correlations were lower (R² < 0.75), supporting robust intra-group reproducibility and clear inter-group separation.
3.4.2. Transcriptome data annotation and classification
Functional annotation of assembled transcripts/genes via multiple databases (Table 3) revealed the highest annotation rates in NR (expressed genes/transcripts: 95.91%/96.25%; all genes/transcripts: 88.42%/91.82%), followed by EggNOG (91.43%/92.36% for expressed ones). All transcripts achieved 99.99% annotation rate in Total_anno. These results confirmed satisfactory sequencing quality for further analysis. The raw RNA-seq reads have been deposited in the NCBI sequence read archive under the accession number PRJNA1434694.
3.4.3. Analysis of differentially expressed genes
Given the significant transcriptomic separation between the two groups, we further identified differentially expressed genes (DEGs) using |log2^(fold change)^ | > 1 and false discovery rate (FDR) < 0.05 as the screening criteria. A total of 7,351 DEGs were identified, including 3,444 upregulated genes and 3,907 downregulated genes in the STZ-treated group compared with the control group (Figure 6A). The volcano plot clearly illustrates the distribution of these DEGs, with red dots representing upregulated genes, green dots representing downregulated genes, and blue dots representing non-differentially expressed genes (Figure 6B). The hierarchical clustering heatmap of DEGs showed distinct expression patterns between the two groups, with intra-group samples clustering closely and inter-group samples showing obvious separation (Figure 6C), further verifying the reliability of DEG identification.
_between_st.tiff)
3.4.4. Analysis of Genomic Variations: SNP and InDel Characteristics
To further evaluate the impact of STZ induction on the genomic stability and transcriptional landscape of zebrafish, we identified and characterized Single Nucleotide Polymorphisms (SNPs) and Insertions/Deletions (InDels) from the liver transcriptome data. The analysis of variant distribution across genomic regions revealed that the majority of identified variants were located in non-coding and regulatory regions, specifically upstream and downstream of genes and within introns. A significant number of variants were also identified in intergenic regions. Within the protein-coding regions, missense variants that may alter protein function and synonymous variants were prominently represented. Notably, the total number of variants in the STZ-treated group (ranging from approximately 1.51 × 10⁶ to 1.84 × 10⁶) was generally higher than that in the control group (1.26 × 10⁶ to 1.75 × 10⁶), suggesting a potential increase in genomic variability following STZ treatment (Table 4).
Furthermore, the classification of SNP mutation types showed a distinct bias toward transitions (Ti) over transversions (Tv) (Table 5). The most frequent transition types across all samples were A/G, C/T, G/A, and T/C. Among transversions, A/T and T/A were the most prevalent. The overall SNP count in the STZ-treated group was higher than in the control group, consistent with the observed total variant counts. This enrichment in transitions is typical of biological genomes and may reflect the selective pressure or the specific chemical nature of STZ-induced DNA damage.
3.4.5. GO enrichment analyses
To further elucidate the biological functions and functional response mechanisms of the zebrafish liver transcriptome to Streptozotocin (STZ) toxicity, Gene Ontology (GO) classification was performed on the identified differentially expressed genes (DEGs). The DEGs were categorized into three major domains: Biological Process (BP), Cellular Component (CC), and Molecular Function (MF). As shown in Figure 7, the functional distribution patterns of up-regulated genes (Figure 7A) and down-regulated genes (Figure 7B) were largely consistent, indicating a broad and systematic transcriptomic response.
In the BP category, “cellular process” was the most enriched term, followed by “biological regulation” and “metabolic process”. Notably, the significant enrichment of genes in “metabolic process” aligns with the liver’s central metabolic role, suggesting STZ-induced metabolic dysregulation, while terms like “response to stimulus” and “developmental process” point to activated hepatic defense and tissue repair mechanisms. Regarding the CC category, the majority of DEGs were concentrated in “cell part” and “organelle”, followed by “membrane”, indicating that STZ toxicity exerts widespread effects on overall cellular structural integrity and membrane systems rather than being localized to specific components. Finally, in the MF category, “binding” and “catalytic activity” were the dominant terms; the substantial alteration in catalytic activity genes correlates with the observed metabolic shifts, further confirming the disruption of hepatic enzymatic systems and biochemical reactions by STZ.
_functional_classification_of_degs_in_zebrafish_liver_induced_by_stz.tiff)
3.4.6. KEGG enrichment analyses
To further elucidate the specific signaling cascades and metabolic networks underlying the identified DEGs, we performed KEGG pathway enrichment analysis. The results revealed a distinct functional divergence between the up- and down-regulated gene sets (Figure 8). Down-regulated genes were predominantly enriched in Metabolism categories, specifically “lipid metabolism”, “carbohydrate metabolism”, and “amino acid metabolism”, indicating that STZ treatment leads to a comprehensive suppression of hepatic metabolic functions (Figure 8A). In contrast, up-regulated genes were significantly clustered in Environmental Information Processing and Cellular Processes, with “signal transduction” and “cell growth and death” as the most prominent terms; this suggests activation of stress-response mechanisms and apoptotic pathways in response to toxicity (Figure 8B). Additionally, the involvement of the “endocrine system” and “immune system” in both gene sets highlights the systemic disruption of the liver-endocrine axis and the induction of inflammatory responses. Collectively, these findings demonstrate that STZ-induced hepatotoxicity is driven by a dual mechanism: the inhibition of core metabolic processes and the concomitant activation of cell death and stress signaling pathways.
_in_zebrafish_liver_in.tiff)
4. Discussion
This study systematically investigated the dose-dependent toxic effects of streptozotocin (STZ) in adult zebrafish and elucidated the molecular mechanisms underlying its hepatotoxicity using liver transcriptome sequencing. Although some studies have reported that STZ can successfully induce hyperglycemia in zebrafish for antidiabetic drug screening,12,15 its efficacy remains controversial, with some attributing its failure to species-specific differences in sensitivity.10 Addressing this controversy, our experimental data clearly demonstrate that STZ treatment did not cause significant fluctuations in blood glucose levels, strongly supporting the view that the STZ-induced zebrafish diabetic model has inherent limitations. In this study, adult zebrafish were treated with STZ at gradient doses of 50–350 mg/kg via intraperitoneal injection, and all groups exhibited a distinct blood glucose decline rather than elevation—the control group had a blood glucose level of approximately 2.7 mmol/L, while all STZ-treated groups dropped to below 2.1 mmol/L, with a more notable decrease in high-dose groups. This result subverts the traditional view that STZ can induce hyperglycemia in zebrafish. Unlike in mammals, where STZ specifically damages pancreatic β-cells, causing insulin deficiency and hyperglycemia, the blood glucose decline in zebrafish suggests that STZ does not solely target pancreatic β-cells in this species.16 Instead, STZ-induced acute systemic toxicity severely disrupts zebrafish’s overall glucose metabolic balance, with the disorder of core processes such as hepatic gluconeogenesis outweighing the single effect of pancreatic β-cell damage.16,17 This finding confirms that STZ cannot consistently induce hyperglycemia in zebrafish in this experimental system, thereby ruling out an ineffective induction method and preventing experimental deviations due to model misjudgment. Additionally, previous studies have reported non-specific toxicity (e.g., injection-site tissue damage) with high-dose STZ in zebrafish but have not defined a toxic dose threshold or systematically analyzed histopathological damage in key metabolic organs.18
In mammals, STZ’s toxic dose is much higher than its diabetes-inducing dose,19 with damage mainly concentrated in the pancreas.20,21 In contrast to the pancreas-specific toxicity observed in mammalian models, where STZ selectively targets pancreatic β-cells via the GLUT2 transporter22This study reveals that STZ exerts significant multi-organ-targeted toxicity in zebrafish and is characterized by a markedly lower tolerance threshold. While rodents often tolerate doses up to 200 mg/kg without acute systemic failure.20 Zebrafish exhibited a drastic decline in survival (only 30% at 10 days) when the dose reached 150 mg/kg, accompanied by severe hepatocellular degeneration and renal hydropic degeneration.
These pathological findings suggest that the metabolic pathways or receptor distributions of STZ in teleosts are considerably more extensive than those in higher vertebrates. Consequently, our results indicate that zebrafish are markedly more sensitive to STZ and that its toxicological profile in fish is systemic rather than organ-specific. This discovery not only delineates a clear safety boundary for STZ application in zebrafish (≤100 mg/kg) but also fills a critical research gap by highlighting the need to account for concurrent hepatic and renal impairment when utilizing this model for metabolic studies.
As the core organ of glucose metabolism, the liver is a key target of STZ toxicity, but previous studies have only focused on morphological liver damage in STZ-treated zebrafish without exploring the underlying molecular mechanisms.23,24 In mammals, transcriptomic studies on STZ-induced hepatotoxicity mostly focused on oxidative stress-related pathways and did not find systemic suppression of overall metabolic pathways.25 RNA-seq analysis in this study identified 7,351 differentially expressed genes (DEGs) in the liver of STZ-treated zebrafish: downregulated DEGs were mainly enriched in lipid, carbohydrate and amino acid metabolic pathways, while upregulated DEGs were significantly concentrated in cell apoptosis and signal transduction pathways. Compared with mammalian studies, the zebrafish liver showed a more intense molecular response to STZ, with broader metabolic suppression across three major metabolic systems, and extensive activation of signal transduction pathways, indicating a more complex stress response in the zebrafish liver. This finding advances STZ hepatotoxicity research from the morphological to the molecular regulatory level, clarifies that hepatic metabolic collapse is a key inducement of STZ-induced systemic toxicity in zebrafish, and provides transcriptomic data for analyzing the species-specific molecular mechanisms of STZ toxicity.
Beyond transcriptomic alterations, previous studies on STZ’s mechanism mainly focused on DNA alkylation and oxidative stress-induced apoptosis, with no attention to its impact on zebrafish genomic stability.26 Although a small number of STZ-induced DNA mutations have been reported in mammals, no obvious increase in SNP frequency or mutation-type bias was observed.27,28 Through in-depth transcriptome mining, this study found that the total number of SNPs in the livers of STZ-treated zebrafish was significantly higher than in the control group, with a pronounced shift toward missense and synonymous mutations. This finding extends the toxicological mechanism of STZ, demonstrating that STZ not only induces apoptosis via direct DNA alkylation but also induces genomic instability, exacerbating cell damage and metabolic disorders. It is an important study that incorporates genomic stability into the toxic effects of STZ in zebrafish, revealing STZ’s non-specific genomic damage and providing a new research dimension for a comprehensive understanding of its toxic effects.
Zebrafish are an important model organism for metabolic disease research due to their high genetic homology with humans, rapid reproduction, and transparent larvae for in vivo observation.29–31 Previous studies have widely attempted to use STZ-induced zebrafish models for diabetes research, but their validity has not been systematically verified,10 for instance, used such models for antidiabetic drug screening without fully verifying stability, ignoring the interference of STZ’s non-specific toxicity. Through multidimensional analysis of survival rate, blood glucose, histopathology, and liver transcriptome, this study clearly demonstrates that high-dose STZ induces only acute systemic toxicity and metabolic collapse in zebrafish, whereas low-dose STZ causes no obvious changes in blood glucose or histology. This conclusion systematically verifies the limitations of STZ in zebrafish diabetic model construction, suggesting subsequent research should abandon single STZ induction and explore more effective strategies such as combined induction, gene editing, and dietary intervention. It also provides a reference for constructing diabetic models in other organisms: the effects of inducers must be fully verified, their nonspecific toxicity comprehensively evaluated, and toxic interference excluded to ensure model stability and reliability.
This study has certain limitations: it investigated only the short-term effects of STZ in adult zebrafish, without exploring its effects in larvae or the cumulative toxicity of long-term low-dose exposure. Furthermore, the transcriptomic analysis was conducted with a relatively small sample size (n=3 per group) and was restricted to a single high dose (350 mg/kg STZ). This experimental design limits the generalizability of our molecular findings and prevents a comprehensive understanding of the dose-dependent molecular dynamics underlying STZ toxicity. Additionally, the key pathways and genes identified by transcriptome analysis were not verified by in vivo and in vitro functional experiments. Future research can further explore STZ’s toxic effects on zebrafish at different developmental stages, verify the regulatory roles of key genes via gene knockout, overexpression, and other technologies, and combine multi-omics analyses (metabolomics, proteomics) with transcriptome data to elucidate the molecular regulatory network of STZ-induced metabolic disorders, providing more evidence for screening STZ toxicity antagonists and optimizing zebrafish diabetic model construction.
5. Conclusion
In conclusion, this study demonstrates that STZ fails to establish a stable diabetic model with hyperglycemia in adult zebrafish, but rather induces acute systemic toxicity and metabolic collapse in a dose-dependent manner. High doses of STZ (≥ 150 mg/kg) cause significant mortality and severe multi-organ damage, particularly in the liver, pancreas, and kidneys. Transcriptomic and genomic analyses further reveal that STZ-induced hepatotoxicity is driven by the global suppression of essential metabolic pathways (lipids, carbohydrates, and amino acids), the activation of apoptosis and stress-response signaling, and increased genomic instability, characterized by elevated SNP frequencies and transition bias. These findings systematically expose the inherent limitations and severe non-specific toxic risks of using STZ for zebrafish diabetes modeling, suggesting that researchers should exercise extreme caution and consider alternative strategies for metabolic disease research in this species.
Acknowledgments
This study was supported by grants from the Sichuan Provincial Natural Science Foundation (2025ZNSFSC0275).
CRediT authorship contribution statement
Data curation: Meiyi Luo (Lead). Writing – original draft: Meiyi Luo (Lead). Methodology: Run Zhang (Lead). Validation: Run Zhang (Lead). Investigation: Bowen Liu (Equal), Yanzi Liu (Equal). Resources: Bowen Liu (Equal), Yanzi Liu (Equal), Yu Wang (Equal), Ping OuYang (Equal). Software: Yu Wang (Equal), Ping OuYang (Equal). Conceptualization: XiaoLi Huang (Lead). Formal Analysis: XiaoLi Huang (Lead). Supervision: Wenting Ji (Equal), Weiyong Chen (Equal). Funding acquisition: Wenting Ji (Equal), Weiyong Chen (Equal). Project administration: Wenting Ji (Equal), Weiyong Chen (Equal).
Ethical Conduct Approval – IACUC
All fish handling procedures have been approved by the Animal Care and Use Committee of Sichuan Agricultural University (Approval No. 20260283). All methods were performed in accordance with the relevant guidelines and regulations.
Declaration of competing interest
The authors declare no conflict of interest.
Informed Consent Statement
All authors and institutions have confirmed this manuscript for publication.
Availability of data and materials
The raw RNA-sequencing datasets generated during the current study are available in the NCBI Sequence Read Archive (SRA) repository, PRJNA1434694 (https://www.ncbi.nlm.nih.gov/sra/?term=PRJNA1434694). The bioinformatics analysis was executed using the standard analytical pipelines on the Majorbio Cloud Platform (www.majorbio.com).