
1. Introduction
In the era of the knowledge economy, innovation has become the core competitiveness of national and regional development.1 The report to the 20th National Congress of the Communist Party of China emphasizes the need to strengthen the forward-looking, strategic, and systematic layout of basic research, optimize resource allocation and layout structure, and provide fundamental theoretical support and technical source supply for innovative development. As a key traditional industry in China, fisheries are crucial to safeguarding national food security, increasing fishermen’s income, and maintaining the marine ecological balance.2,3 However, this vital industry is currently trapped in dual predicaments: rigid resource constraints and continuous ecological environment deterioration,4 making the traditional fisheries development model increasingly incompatible with the demands of modern society.5,6 Against this backdrop, the overlapping implementation of the strategies of building a strong maritime nation and rural revitalization urgently requires scientific and technological innovation to drive the transformation and upgrading of the entire fishery industrial chain. In fact, modern industrial innovation no longer depends on a single factor; instead, it relies on the flow and integration of multiple factors across the innovation chain, industrial chain, and value chain, which further drives the formation of a multi-layered innovation network through the flow, networking, and interweaving of various factors.7 Against this industrial and innovation context, accurately grasping the dynamic evolution and driving mechanisms of the fisheries industry innovation cooperation network is of great significance for an in-depth understanding of the industrial innovation process and for promoting sustainable fisheries development.
Since Freeman first proposed the concept of the innovation network in 1991,8 its research paradigm has gradually expanded from the firm level9 to multiple spatial units, including urban agglomerations10 and river basins.11 Research on urban innovation networks, in particular, adopts a macro urban perspective to explore the spatial organizational patterns of knowledge flows shaped by diverse micro-agents rooted in cities through cross-regional cooperation and collaboration.12 Existing studies on inter-urban innovation networks focus on three core dimensions: First, the establishment of inter-urban innovation linkages for industries with distinct knowledge bases. Scholars have used a variety of indicators to construct innovation networks, such as paper co-authorship, talent mobility, and patent cooperation and transfer,13,14 with patent data being the most widely adopted due to its objectivity and quantifiability.15 Second, the identification of network structures and spatial patterns across different hierarchical levels. Based on the established innovation linkages, social network analysis is applied to examine the overall and individual structural characteristics of networks and combined with GIS spatial analysis to explore their spatiotemporal evolutionary patterns.16 Third, the exploration of the driving mechanisms underlying these networks. Current research investigates the influencing factors of innovation networks primarily from endogenous and exogenous perspectives, including endogenous network structure, node attributes, and exogenous environmental factors.17 Evidently, significant disparities in the inherent attributes, development foundations, and development stages of different industries lead to distinct differences in the evolution of their innovation networks and the underlying mechanisms.18
Overall, the academic community has conducted numerous case studies of urban innovation networks from diverse perspectives, establishing a relatively mature research framework and methodological system. However, existing research on innovation networks has primarily focused on high-tech industries such as semiconductors and strategically emerging industries, with insufficient attention paid to fundamental industries. As a type of innovation network for fundamental industries, research on fisheries innovation networks has so far centered on the integration of marine fisheries innovation chains and industrial chains,19 marine fisheries innovation capacity,20 and sustainable fisheries,21 yet there are few targeted discussions on the innovative relationships within the fisheries industry from a spatial perspective. In particular, only the study by Wang et al.7 has examined the evolutionary characteristics and mechanisms of the innovation network in Yantai’s marine ranching industry from a spatial network perspective. Still, it failed to conduct an in-depth exploration of the mechanisms underlying network formation. Furthermore, the dynamic evolutionary laws of inter-city fisheries industry innovation networks remain unclear.7 Two specific knowledge gaps therefore remain unaddressed. First, while the structural evolution of fishery innovation networks has received preliminary attention, the mechanisms underlying their formation—particularly the roles of multidimensional proximity, urban endowments, and network endogenous structure—have not been empirically examined at the inter-city scale. Second, existing ERGM-based network studies have rarely incorporated the temporal heterogeneity of driving effects across network developmental stages. To address these gaps, this study asks: (1) How has China’s fishery industry innovation cooperation network evolved spatiotemporally from 2007 to 2024? (2) What proximity mechanisms, urban endowment factors, and endogenous structural forces drive network tie formation, and how do these effects vary across developmental stages?
Against this backdrop, this paper constructs an innovation cooperation network for China’s fishery industry based on patent collaboration data from 2007 to 2024. It adopts social network analysis to examine the characteristics of the inter-urban collaboration network and its core-periphery structure, combines GIS spatial analysis to reveal the spatiotemporal evolutionary trends of the network, and employs the exponential random graph model to explore the mechanisms underlying network formation. Compared with existing studies, this paper makes two contributions: it provides the first systematic empirical analysis of the inter-city fishery innovation cooperation network at the national scale, and it reveals stage-heterogeneous driving effects of proximity mechanisms, urban endowments, and network endogenous structure specific to a foundational industry context. By uncovering the spatial evolutionary logic and formation mechanisms of the fisheries industry innovation cooperation network, this study provides a scientific approach to addressing such problems as the inefficient transformation of scientific and technological achievements and the fragmentation of regional innovation, thus facilitating the coordinated implementation of China’s strategy of building a strong maritime nation and rural revitalization.
2. Research Methods and Data Sources
2.1. Research Methods
2.1.1. Social Network Analysis Method
The spatial network characteristics of the fisheries industry innovation cooperation network are analyzed from four dimensions: overall network characteristics, centrality, core-periphery structure, and spatiotemporal network evolution. Among them, the overall relational structure is used to examine the degree of network correlation and the robustness of the network structure, which is mainly measured by network size, connection frequency, network density, average path length, clustering coefficient, and network centralization. Centrality is employed to depict the positional roles and power of cities in the social network, including degree centrality and betweenness centrality, among other metrics. The core-periphery structure is applied to analyze the distribution and evolutionary characteristics of the core-periphery structure across different cities in the network, which can be measured by each city’s core degree. Spatiotemporal network evolution is explored to reveal the network’s temporal and spatial evolutionary trends, with this dimension analyzed using GIS spatial analysis methods.
2.1.2. Exponential random graph model
The exponential random graph model is a mathematical model for describing the structure of social networks. Based on the interdependence of edges in a network, it comprehensively considers endogenous structural factors and exogenous attribute factors to calculate the probability that existing relationships will influence the formation of future ones. Through steps including estimation, diagnosis, simulation and comparison, it realizes parameter estimation and statistical inference of various influencing factors, thereby explaining the formation and evolution mechanisms of the network. The formula is as follows:
Prθ;h,η,g(Y=y)=h(y)exp[η(θ)×g(y)]kh,η,g(θ)
Among these, denotes the realization probability, where represents the actual network, denotes the simulated network, is the model statistic, is the fitting parameter, is the normalization constant that ensures the sum of the probability values of the network structure falls within the range of 0 to 1, is the reference distribution.
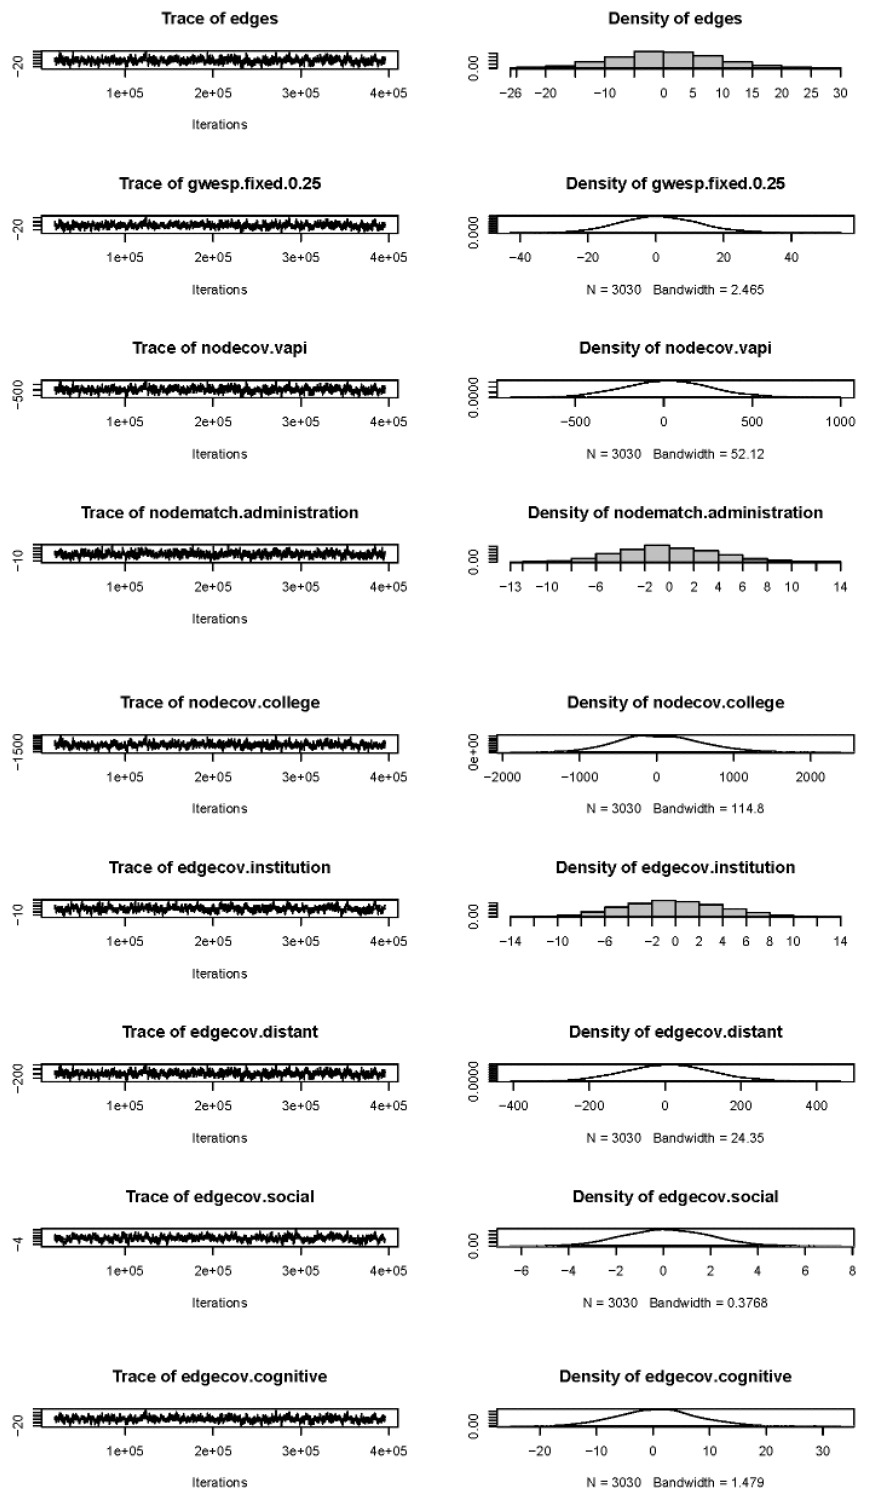
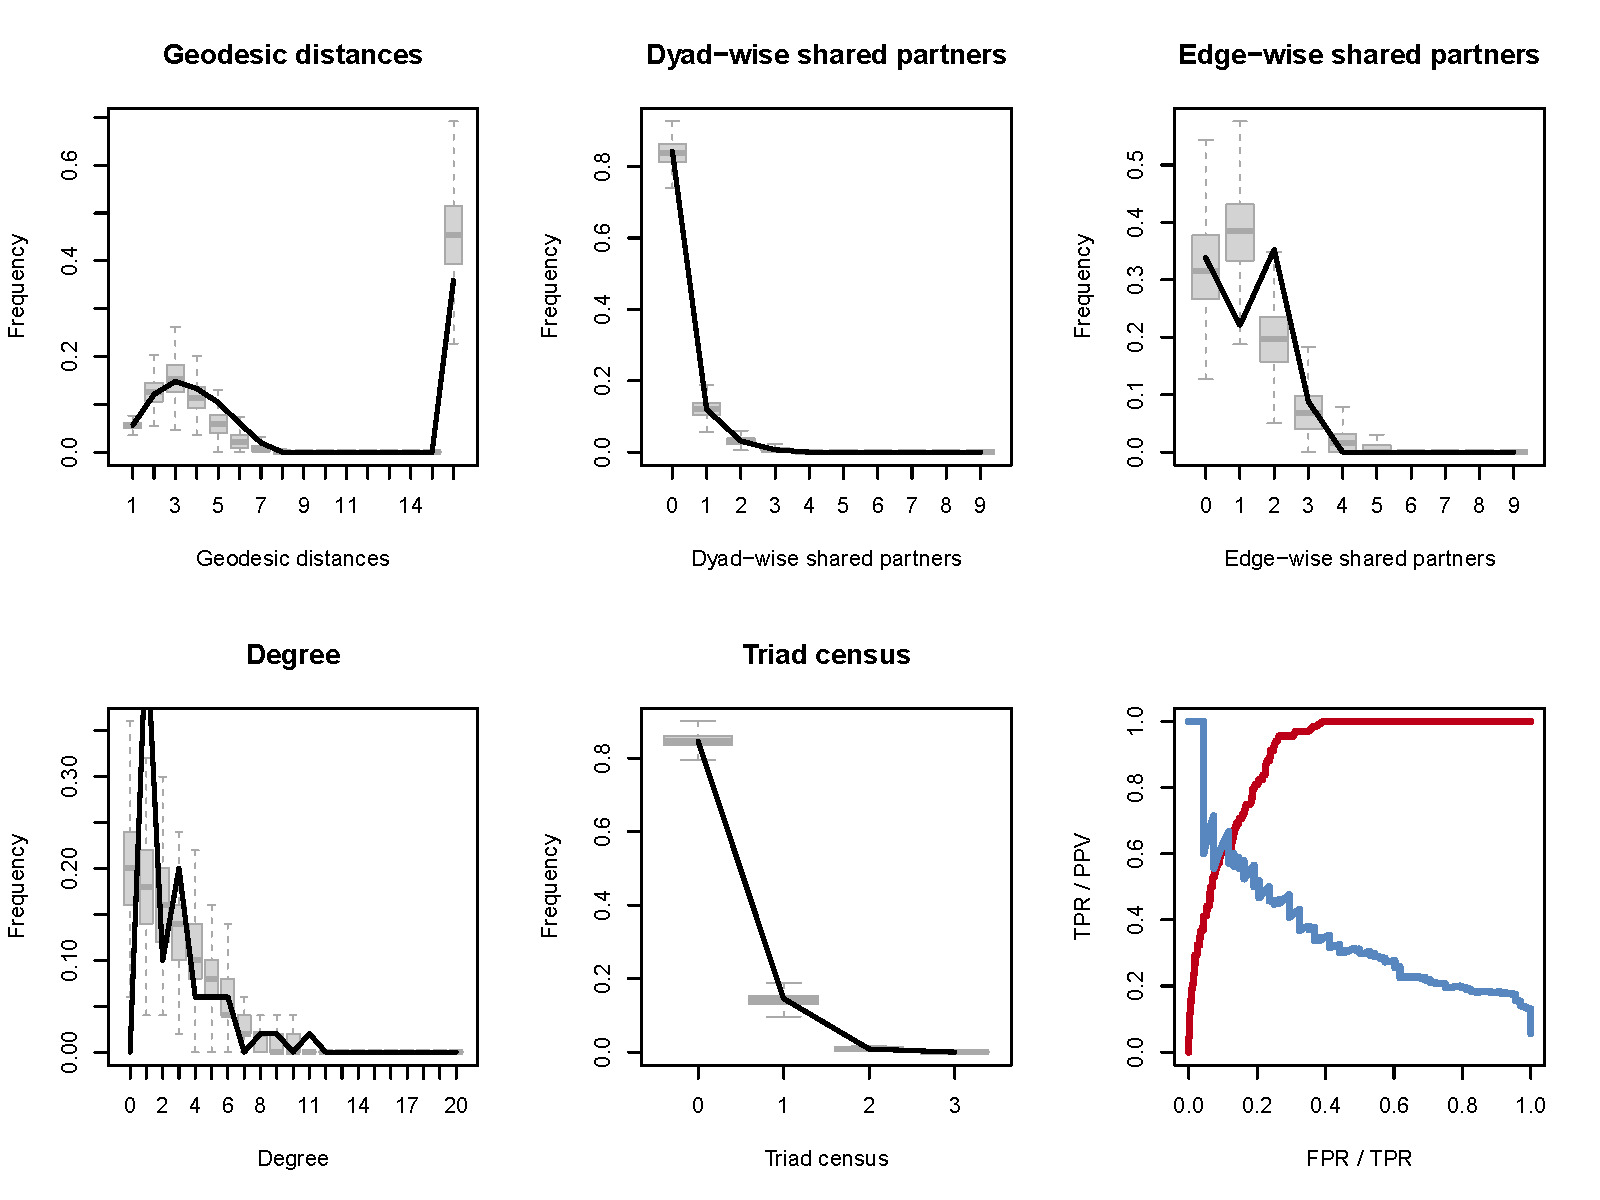
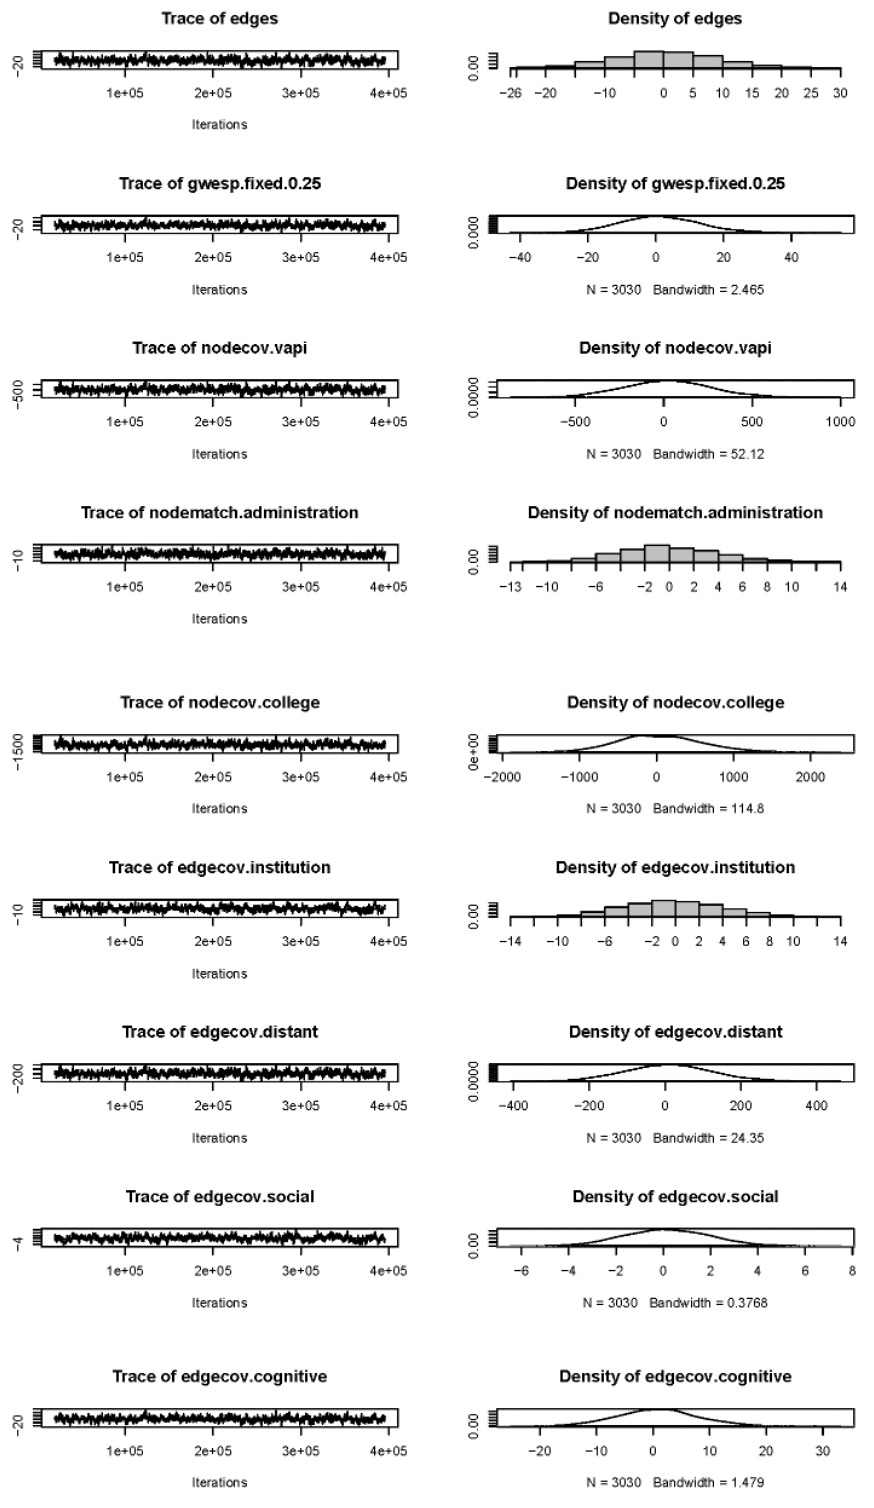
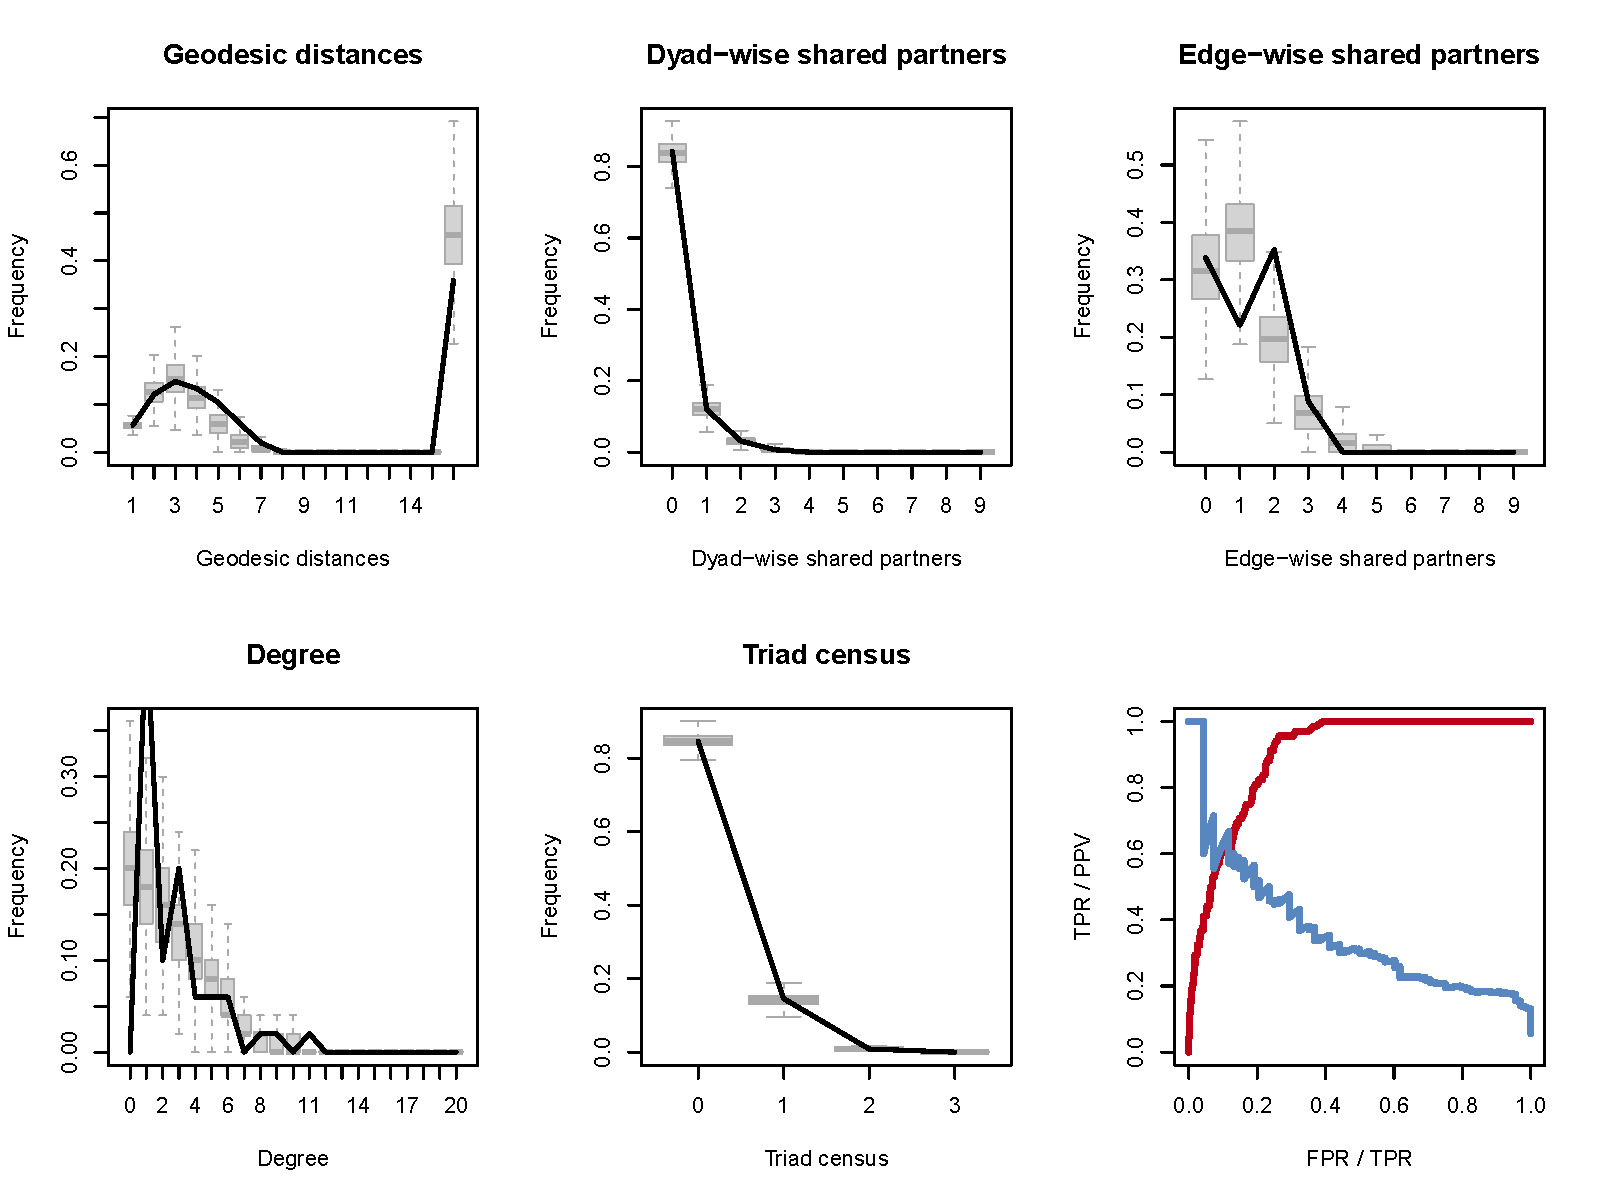
To ensure model reliability, MCMC diagnostics are performed to verify chain convergence by examining whether trace plots show stable fluctuation around stationary values with no systematic drift across iterations, and whether posterior density plots approximate unimodal distributions. Goodness-of-fit (GOF) is assessed by simulating 1,000 networks based on the estimated parameters and comparing key simulated network statistics—including degree distribution, edge-wise shared partners, dyad-wise shared partners, geodesic distance distribution, and triad census—against those of the observed network. A well-fitted model is confirmed when the observed statistics consistently fall within the interquartile range of the simulated distributions.
2.1.3. GIS spatial analysis
ArcGIS 10.8 is employed to spatially visualize the evolutionary characteristics of China’s fishery industry innovation cooperation network. First, network structural metrics—including degree centrality and connection frequency—are calculated in Ucinet and Gephi using the inter-city patent cooperation data, and the results are exported as attribute tables. Second, city geographic coordinates are geocoded and imported into ArcGIS, where the calculated network metrics are joined to city point layers. Connection lines between cooperating city pairs are generated and scaled in thickness proportional to cooperation frequency, while city node sizes are scaled proportional to degree centrality, enabling visual identification of dominant innovation corridors, spatial diffusion patterns, and the evolution of core-periphery structures across the three developmental stages.
2.2. Variable Selection
The variables of the exponential random graph model fall into two broad categories: endogenous and exogenous variables, which cover inter-city multi-dimensional proximity, urban endowment and network structure variables involved in the influencing mechanisms of the fisheries industry innovation cooperation network.
2.2.1. Inter-city Multi-dimensional Proximity Variables
(1) Geographical Proximity. Geographical proximity is reflected by the spatial distance between cooperating parties. In the study by Sun and Peng,22 the Euclidean distance is used to measure the geographical proximity of cooperating entities. First, the latitude and longitude coordinates of urban centers are retrieved from the Amap Open Platform (https://lbs.amap.com/), then converted to plane rectangular coordinates in ArcMap, and the Euclidean distance between cities is calculated. The calculation formula is as follows:
Distantij=√(Xi−Xj)2+(Yi−Yj)2
Where and represent the plane rectangular coordinates of city and city respectively.
(2) Institutional Proximity. Institutional proximity reflects the similarity of institutional environments between organizations. Referring to Hong & Su,23 institutional proximity is measured by whether the cooperating parties belong to the same province. It takes a value of 1 if the two parties are in the same province, and 0 otherwise.
(3) Social Proximity. Social proximity mainly refers to the closeness of cooperative ties between partners. Following Gui et al.,24 social proximity is measured as the relative cooperation intensity between cities using the Jaccard similarity coefficient. The calculation formula is as follows:
Socialij=NijCi+Cj−Nij
Where denotes the number of common partners of city and city and and represent the other partners of city and city respectively.
(4) Cognitive Proximity. Cognitive proximity reflects the similarity of innovation knowledge in the fisheries sector between cities. Referring to the method of Jaffe et al.,25 cognitive proximity is measured using cosine similarity. The calculation formula is as follows:
Cognitiveij=∑nk=1xikxjk√∑nk=1x2ik∑nk=1x2jk
where and denote the share of class patents in the total cooperative patents of city and city respectively, and represents the number of patent classes. To better define patent technology fields, the International Patent Classification (IPC) code is used to categorize patent types. Cognitive proximity ranges from 0 to 1. A value closer to 1 indicates a higher similarity in knowledge structures between the two cities, while a value closer to 0 suggests a greater divergence in their knowledge bases.
2.2.2. Urban Endowment Variables
Drawing on the concept of the “regional innovation system” proposed by Cooke,26 urban endowment variables are constructed from three dimensions: innovation actors, innovation resource factors, and innovation environment. Specifically, the number of higher education institutions (hedu), added value of primary industry (AGDP), and administrative level (adm) are selected to reflect innovation actors, factors, and environment, respectively.
2.2.3. Network Structure Variables
The stability of the network’s endogenous structure directly affects the formation of ties among organizations.27 We include edge structure and geometrically weighted degree to control for the average effects and star structures that influence network formation.
2.3. Data Sources and Period Division
2.3.1. Data Sources
The fisheries patent data used in this study were collected from the Patent Search Platform of the China National Intellectual Property Administration (CNIPA). Due to the diversity of production targets and the complexity of production conditions in the fishery sector, the scope of research in this field has become increasingly broad as it has developed. Therefore, to define the scope of the fishery sector as reasonably and comprehensively as possible, this study draws on existing research.28 It integrates the Classification of Marine and Related Industries, the Correspondence Table between International Patent Classification and National Economic Industry Categories and the International Patent Classification (2024.01) both issued by the CNIPA, as well as expert opinions in relevant fields. By focusing on technological innovations in fishery production and processing, we screen and adopt targeted IPC codes to identify fishery patents. The IPC classes used, and their corresponding technical fields, are presented in Table 1.
Patent applications are less affected by the examination procedures of patent-granting agencies and by human factors, and can more accurately reflect the level of innovation output.29 Meanwhile, considering that invention patents usually have higher technical value and quality, this study focuses on joint invention patent applications. Through searching by the IPC codes in the fishery sector, a total of 92,138 invention patent applications were obtained. The raw patent data were subjected to a multi-step cleaning procedure. First, duplicate records were identified and removed based on patent application numbers. Second, patents with only one applicant and those filed by individual applicants were excluded, as this study focuses on inter-organizational collaboration. Third, patents with applicant addresses in Hong Kong, Macao, and Taiwan, China were excluded. Fourth, patents entirely unrelated to fishery technologies were removed based on manual inspection of invention titles; excluded items included patents containing terms such as desk lamps, lanterns, kitchen appliances, reading lights, bedside lamps, window frame lights, bathroom heaters, decorative lights, clothes rack lights, water dispenser lights, shoe lights, ornamental lights, light fixtures, ambient lights, washing cabinets, and washing drums, among others. Following this iterative cleaning process, 4,635 valid joint-invention patent records for the fishery industry were retained. The addresses of patent applicants were manually retrieved one by one through professional platforms such as Qichacha. Inter-organizational cooperation relationships were then converted into inter-city cooperation relationships to construct an inter-city joint patent database. The city-level statistical data used in this study were collected from the China City Statistical Yearbook, regional statistical bulletins, and government work reports.
2.3.2. Period Division
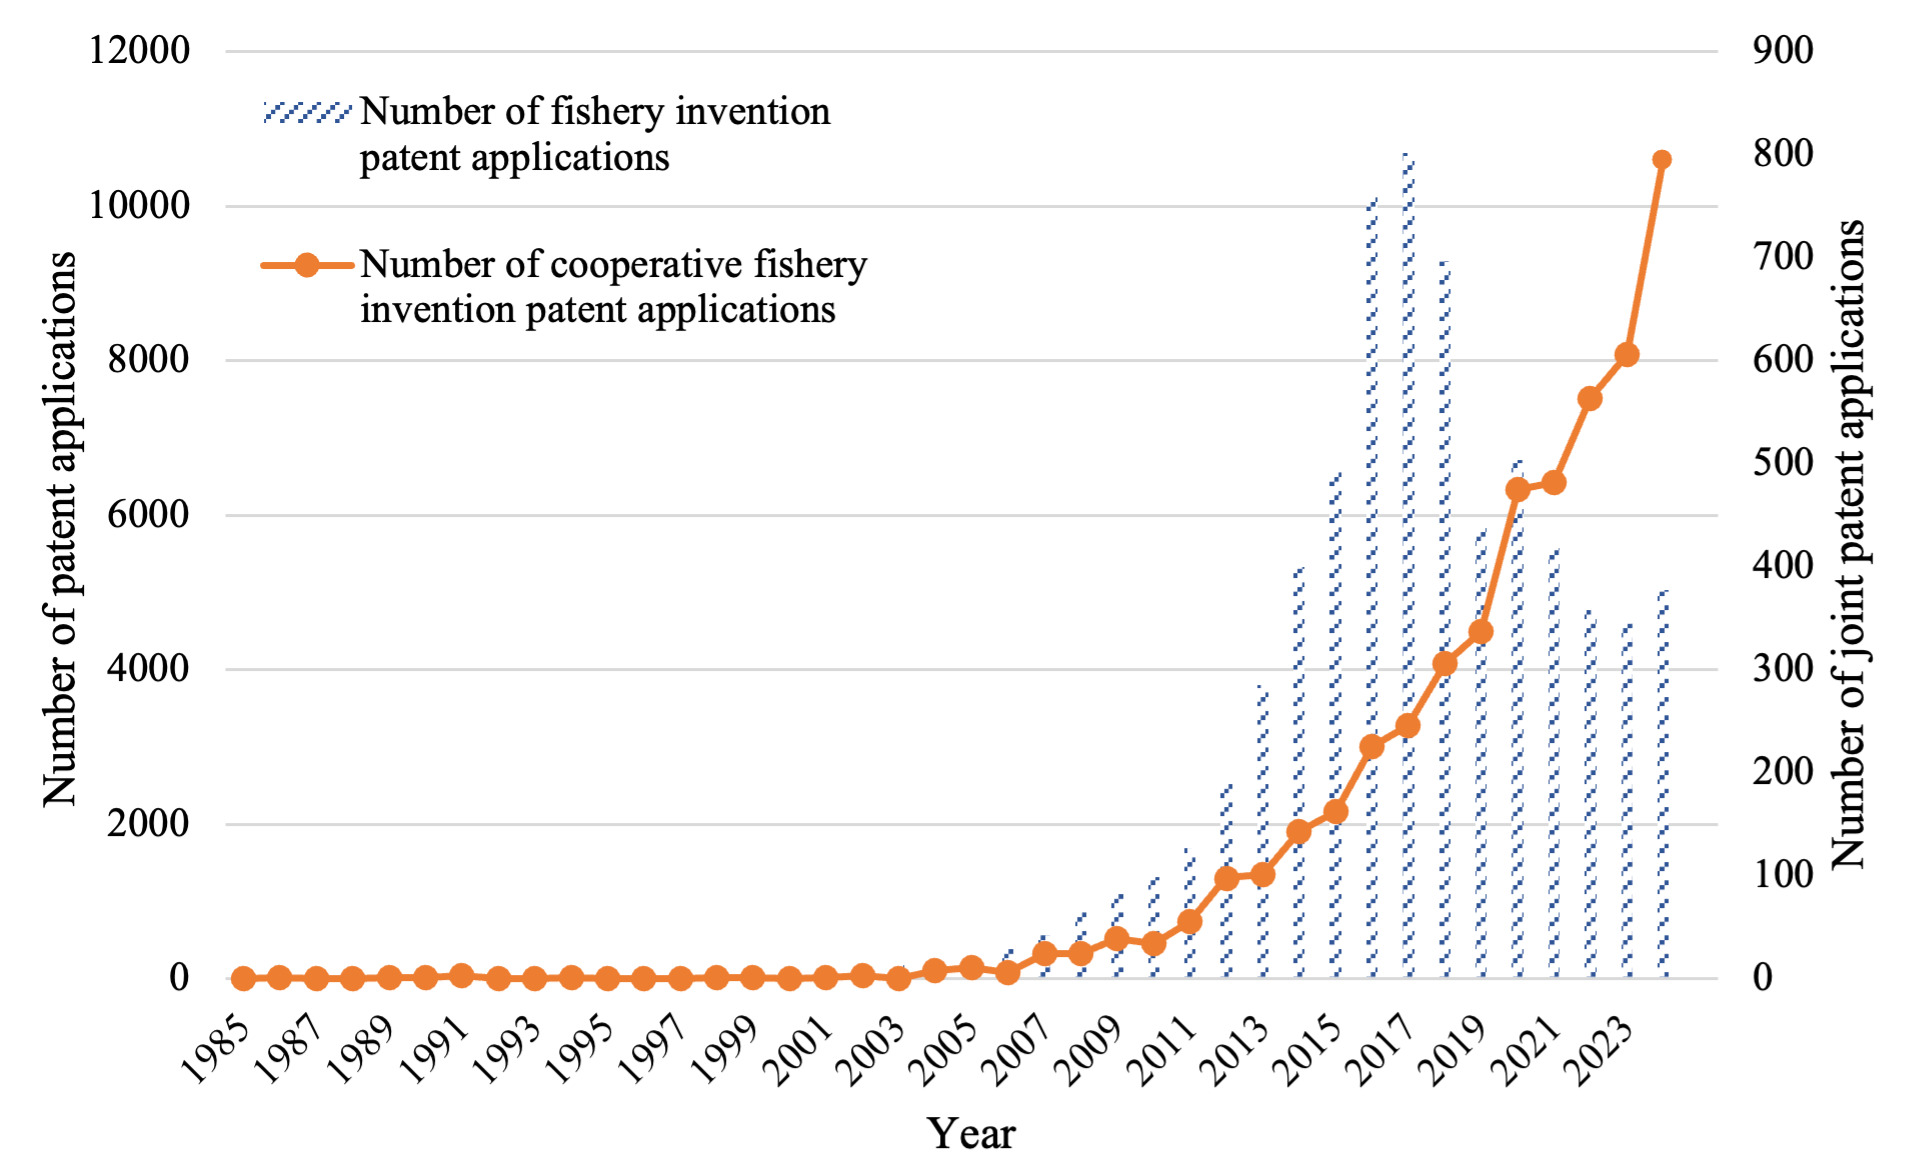
The temporal trend in the number of jointly applied invention patents in the fishery industry is shown in Figure 1. Before 2007, the number of fishery invention patent applications was relatively small, and the number of cooperative patent applications was mostly single-digit or zero. Therefore, this study sets the research period from 2007 to 2024. Since invention patents are generally published 18 months after the filing date, the data for 2022–2024 are for reference only.
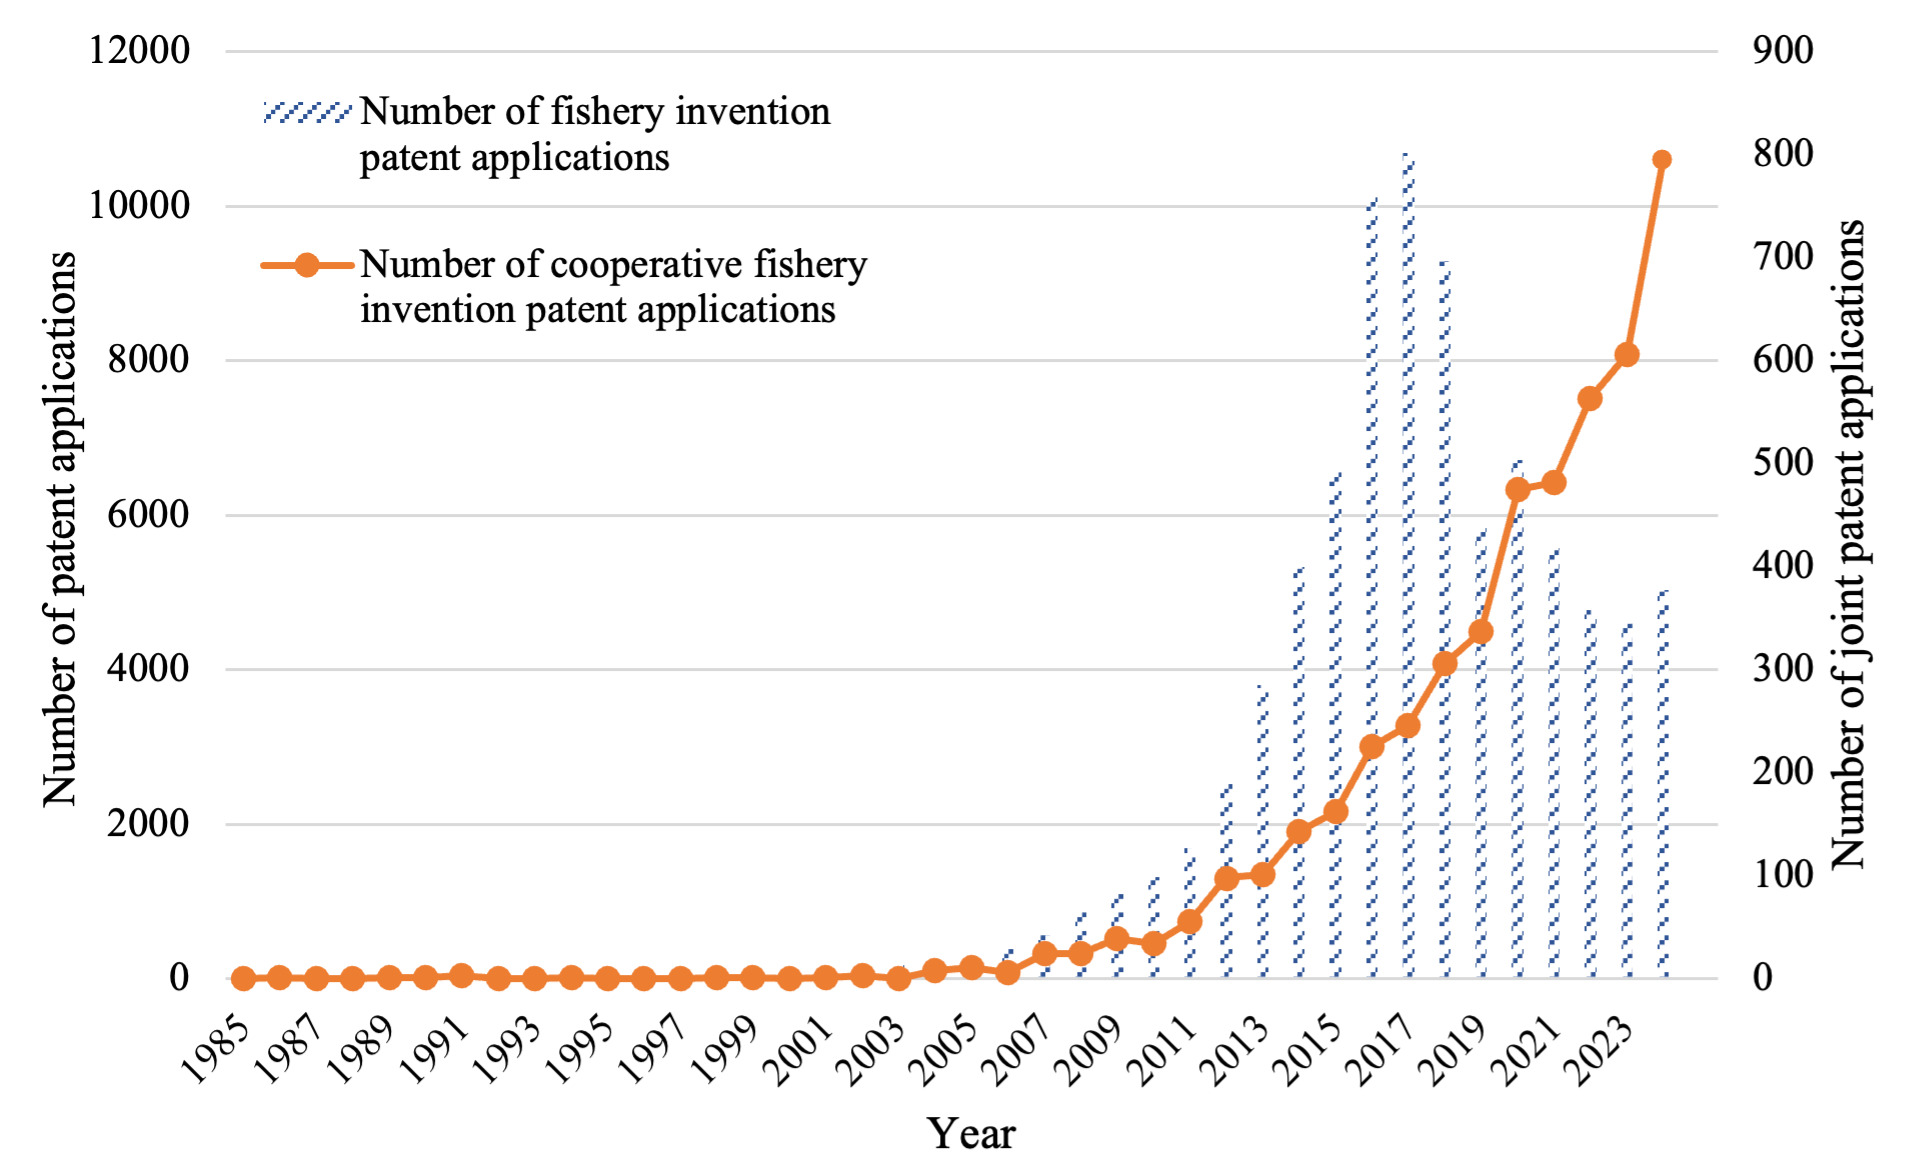
Since 2007, the number of fishery invention patent applications has surged rapidly from 574 to 10,685 in 2017, representing an increase of approximately 18.61 times, followed by a fluctuating decline to 5,035 in 2024. In terms of jointly applied invention patents, except for fluctuations in individual years, the number of fishery cooperative invention patent applications increased from 25 in 2007 to 794 in 2024, representing a growth of approximately 31.76 times.
Further observation reveals that the number of fishery cooperative invention patent applications grew moderately from 2007 to 2011, marking a gradual exploratory stage; from 2012 to 2019, it showed a distinct upward trend, with a steady and continuous increase in the application volume, indicating that fishery cooperative innovation entered a stage of active development; from 2020 to 2024, the number of fishery cooperative invention patent applications expanded rapidly, and the efficiency of fishery cooperative innovation was further unleashed. Accordingly, the development of fishery innovation cooperation is divided into three stages: the initial exploration stage, the steady development stage, and the accelerated leap stage.
3. Evolutionary Characteristics of Innovation Cooperation Networks in China’s Fishery Industry
3.1. Overall Network Characteristics
The overall characteristics of the fishery innovation cooperation network from 2007 to 2024 are presented in Table 2. First, in terms of network scale, the number of cities participating in the fishery innovation cooperation network increased from 50 to 227, and the number of cooperative edges rose from 68 to 819, while the network diameter decreased to 6, indicating that the channels for fishery technology cooperation have increased significantly and the network coverage has continued to expand. Second, the number of connections represents the frequency of technical cooperation between cities. A higher value of this indicator indicates closer cooperation; its growth rate is far greater than that of network edges, demonstrating that technical cooperation between cities has been further strengthened. Third, although the network scale expanded, the innovation network density declined, suggesting that the expansion of network scale did not lead to efficient connections among node cities, and the knowledge spillover capacity of cities weakened somewhat. Finally, the average path length continued to decline to 2.766, and the clustering coefficient fluctuated to 0.526, indicating that while the connectivity of cooperation between cities gradually improved, the agglomeration also continued to strengthen, reflecting closer and more organized innovation cooperation relationships among cities in the fishery sector.
Overall, during the sample period, the spatial connections of China’s fishery innovation cooperation network gradually strengthened, and the network structure tended to stabilize. However, due to the relatively low network density, the overall network was still at an early stage of development.
3.2. Individual Network Structure
From 2007 to 2024, eastern cities continuously dominated and led the development of the fishery industry innovation cooperation network (Table 3). The top two cities in terms of degree centrality evolved from Beijing and Shanghai to Beijing and Guangzhou. In contrast, betweenness centrality shifted from being dominated by Yangtze River Delta cities to Beijing, Wuhan and Guangzhou, highlighting the strong central position of Beijing in the innovation network. With the further maturation of the fishery industry, cities with resource or industrial advantages have gradually moved toward the center and shown certain intermediary and bridging capabilities. Among them, coastal cities such as Qingdao and Zhanjiang are prominent, and inland cities such as Wuhan and Chengdu, representing the central and western regions respectively, occupy important positions in the innovation network.
3.3. Core-Periphery Structure
The core-periphery model in Ucinet software was employed to calculate the core degree of each city across the three stages. Based on the variation in city scores, network nodes were classified into core cities, sub-core cities, and peripheral cities using 0.25 and 0.15 as the division thresholds (Table 4). The total number of core and sub-core cities in the three stages was 10, 12, and 10, respectively, indicating little overall fluctuation. In contrast, the proportion of peripheral nodes increased from 80.00% in the first stage to 95.59% in the third stage, indicating that the network’s core-periphery structure was continuously strengthening.
During the sample period, the core cities evolved from three cities in the Yangtze River Delta to Beijing and Guangzhou, and gradually stabilized. Among them, Guangzhou has become a crucial hub for fishery technology innovation and cooperation by virtue of its aquatic product resources and geographical location advantages. The consolidation of its core position is closely linked to the maturity of the fishery industry cluster in the Pearl River Delta region. Although Beijing is not a typical coastal area, it has occupied a core position in high-end technological innovation such as aquatic breeding and fishery equipment R&D, supported by its favorable innovation environment, strong industrial foundation, and talent agglomeration effect.
The evolution of sub-core cities shows a feature of regional diffusion. From initially concentrating around the Yangtze River Delta, sub-core cities have gradually expanded to cities with abundant resource endowments such as Qingdao, Wuhan and Chengdu. These cities, either relying on the coastal industrial foundation or the advantages of regional scientific research centers, have become important hubs for technology transfer and resource radiation from core cities.
3.4. Spatiotemporal Pattern of the Network
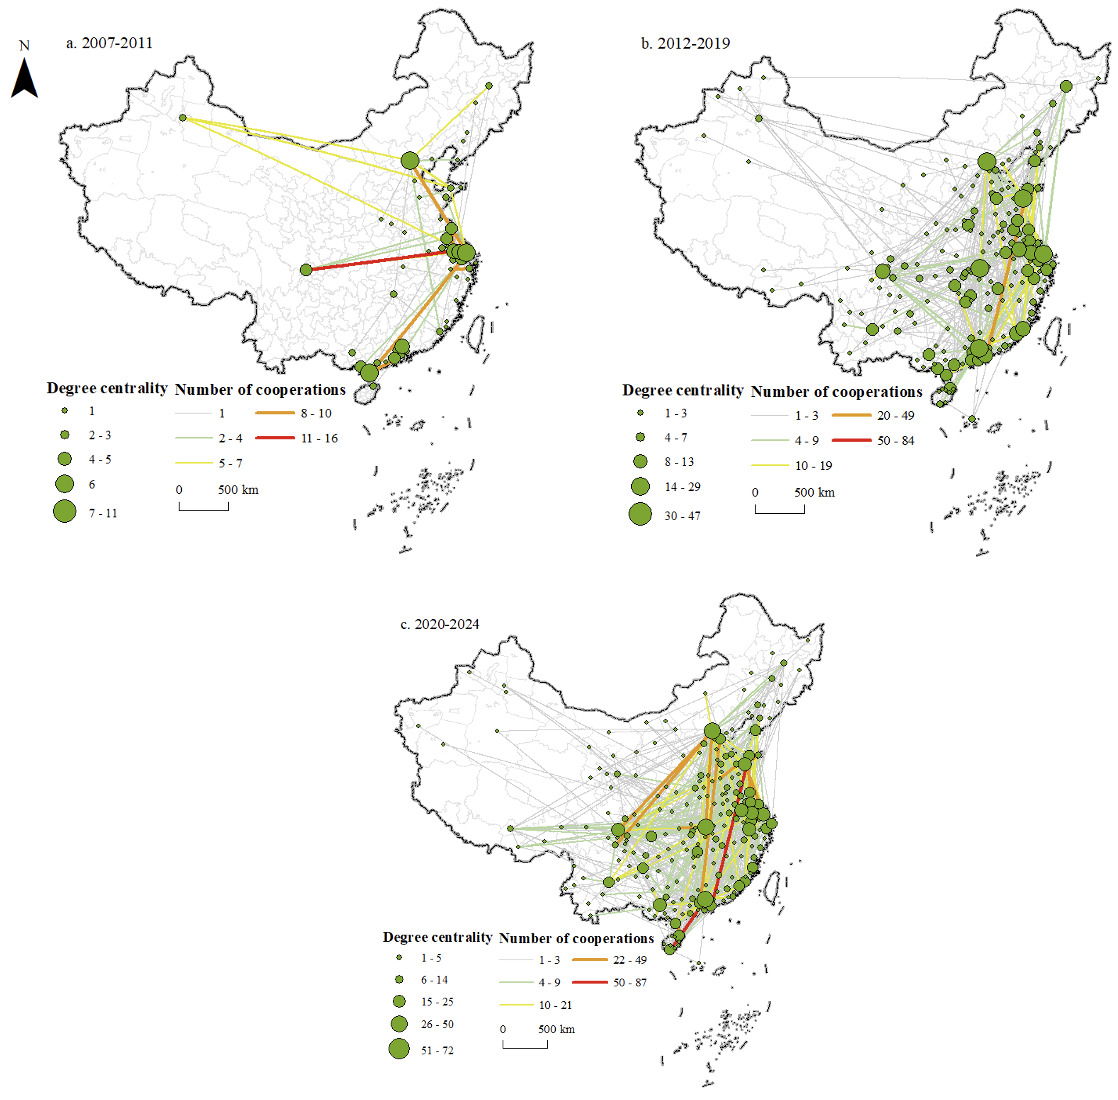
Figure 2 illustrates the dynamic evolution of the fishery industry innovation cooperation network from 2007 to 2024.
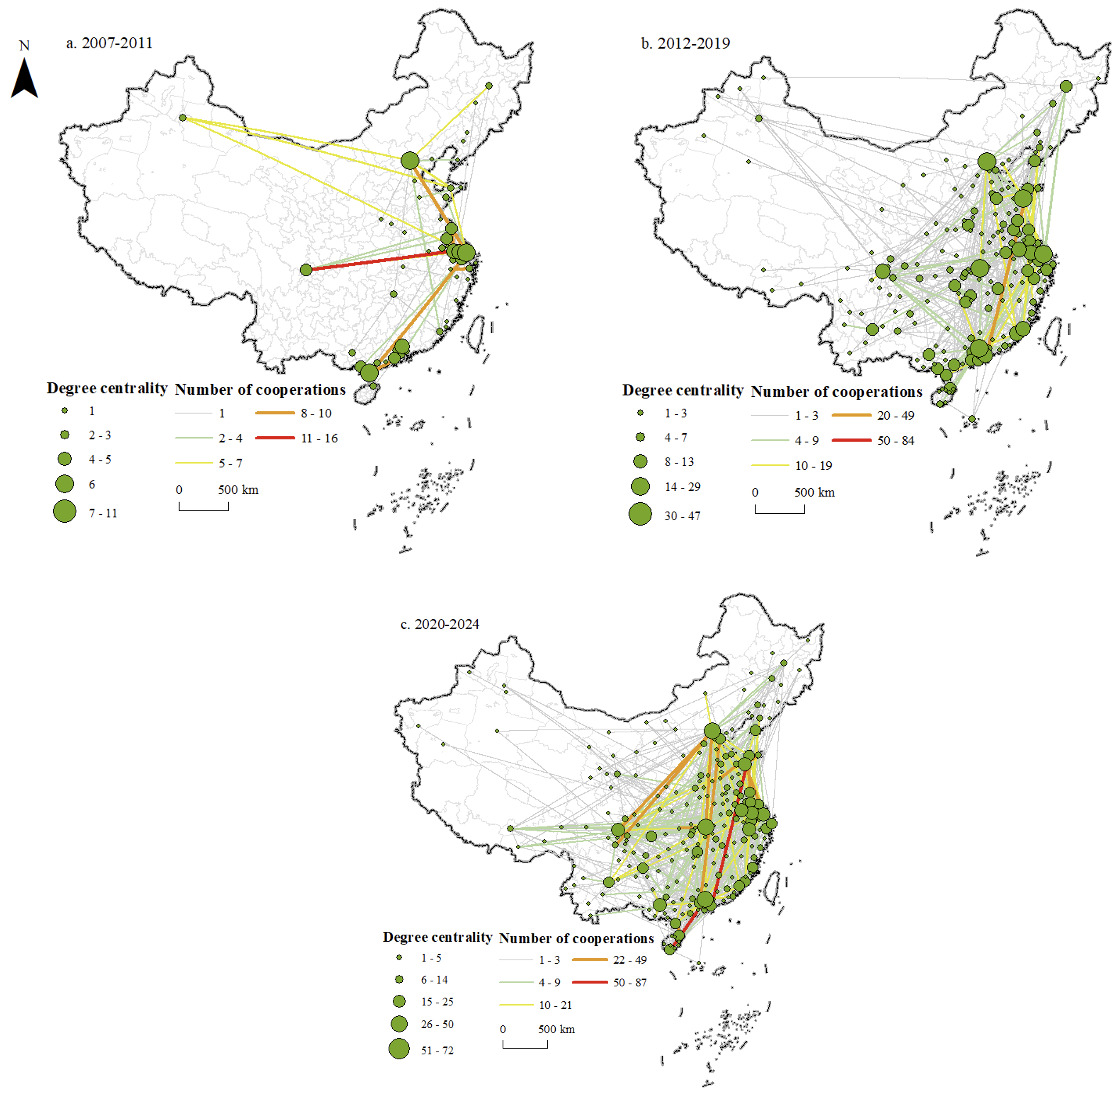
In the Initial Exploration Stage, the network had few innovation nodes and low connection intensity. The main innovation corridors were Wuxi–Chengdu, Jiaxing–Zhanjiang, and Shanghai–Beijing, forming a one-core and three-axis innovation pattern with the Yangtze River Delta as the core. Cities such as Chengdu, Zhanjiang, and Jiaxing gather leading aquatic feed enterprises including Tongwei Co., Ltd. and Guangdong Yuehai Feed Group. Wuxi hosts research institutes such as the Freshwater Fisheries Research Center of the Chinese Academy of Fishery Sciences. Meanwhile, Beijing and Shanghai, as the national political and economic centers, jointly served as the initial sources of the fishery innovation cooperation network, providing early impetus for the innovative development of China’s fishery industry.
In the Steady Development Stage, as the industrial chain upgraded, a large number of innovation nodes joined the network. Coastal cities in the Bohai Rim and the Pearl River Delta, such as Yantai and Guangzhou, became prominent. Guangzhou–Zhuhai and Yantai–Shenzhen emerged as major innovation corridors. Led by coastal cities, the network gradually expanded into the central and western regions, and a multi-node development pattern began to take shape. Among them, Yantai maintained close ties with headquarters in Shenzhen through R&D and innovation in marine fishery equipment, forming a major innovation corridor in the network.
In the Accelerated Leap Stage, the scope of network cooperation further expanded, and the core status of coastal cities in the Bohai Rim and the Pearl River Delta was strengthened. Cities such as Wuhan and Sanya became important directions for network expansion due to their resource and industrial advantages. Yantai–Shenzhen, Guangzhou–Sanya, Zhuhai–Guangzhou, and Shanghai–Qingdao became the main innovation corridors, forming a multi-layered core-periphery network pattern led by the eastern coastal core and supported by multiple inland characteristic cities.
Overall, the fishery innovation cooperation network has evolved from being dominated by a single core in the Yangtze River Delta to a multi-core network expanded with core nodes in the Bohai Rim, Pearl River Delta and other regions, finally forming an evolutionary pattern featuring eastern coastal cities and inland cities with distinctive resource endowments as core hubs.
4. Formation Mechanism of China’s Fishery Industry Innovation Cooperation Network
To comprehensively analyze the formation mechanism of the fishery industry innovation cooperation network, in accordance with the ERGM and variable settings in the previous section, Models 1 to 9 are respectively constructed for the three stages: Initial Exploration Stage, Steady Development Stage and Accelerated Leap Stage, and the ERGM model fitting is performed sequentially (Table 5).
4.1. Proximity Mechanism
Among inter-city relational effects, geographical proximity exerts a significant negative impact, while institutional proximity, social proximity and cognitive proximity all present significant positive effects.
Among them, geographical distance exerts a significant inhibiting effect on innovation cooperation in the fishery industry, which supports Qu et al.'s30 view that geographical distance hinders network formation. This finding is associated with the inherent characteristics of the fishery industry, namely its dependence on on-site technical guidance and the transfer of aquaculture experience. An increase in spatial distance will increase cooperation costs and make knowledge spillovers more difficult. Nevertheless, the decline in the absolute value of its coefficient indicates that geographical constraints have gradually weakened as transportation and communication technologies have advanced and remote collaboration modes have matured. Institutional proximity has a consistently significant positive effect, with its marginal effect continuing to increase. Cities within the same province share similar policy environments, regulatory frameworks, and resource allocation mechanisms, which reduce institutional barriers and uncertainties in cross-regional cooperation. Social proximity also exerts a persistently significant positive influence, and its coefficient keeps rising. Trust relationships and information-sharing channels built through common partners help mitigate opportunistic behavior and lower communication costs, consistent with the role of social proximity in facilitating knowledge flow emphasized by Gui et al.24 The positive impact of cognitive proximity on the formation of innovation networks remains consistently strong across all three stages. This indicates that similarities in knowledge structures and technological foundations across cities in the fishery sector help reduce cognitive barriers and promote knowledge absorption and collaborative innovation, in line with findings by Sun et al.31 that cognitive proximity enhances inter-organizational cooperation.
Finally, according to the intensity of the effects of different dimensions of proximity on cooperation formation, social proximity exhibits the strongest impact, followed by cognitive proximity and institutional proximity, while geographical proximity has the weakest effect.
4.2. Urban Endowment
Among urban attribute variables, the number of universities and the added value of the primary industry exert significant positive effects, while the administrative level presents a significant negative effect. Specifically, the number of universities shows a consistently significant positive impact across all three stages. As the core carriers of innovation, universities enhance a city’s attractiveness for cooperation through knowledge production and talent supply, thereby verifying the key role of innovation actors in the regional innovation system theory proposed by Cooke.26 The administrative level has a significant negative effect, evident only in the latter two stages. This indicates that cities are more inclined to establish innovation ties with cities of higher administrative levels, and this tendency becomes more pronounced as the network configuration becomes more complex. The effect of the primary industry’s added value is not significant in the Initial Exploration Stage but becomes significantly positive in the Accelerated Leap Stage. This shift may be related to the transformation of the fishery industry chain: as the industrial chain upgrades, the supporting industries and market support provided by the agricultural economic foundation gradually come into play.
4.3. Network Endogenous Structure
Among the network structural variables, the weighted ties reflect the self-organizing nature of inter-city cooperation. The predominantly significant negative coefficient of weighted ties indicates that the establishment of fishery innovation cooperation relationships entails substantial coordination costs, while the expansion of the network scale further increases the complexity of collaborative governance. This finding corroborates the non-random and complex nature of network formation. The star structure consistently exhibits a significant positive effect, reflecting a pronounced tendency for preferential attachment within the network. Core cities endowed with abundant innovative resources (e.g., Beijing and Guangzhou) are more likely to attract other cities and forge cooperative ties, thereby forming a star-topology core-periphery structure.
4.4. Model Diagnostics and Goodness-of-Fit
To verify the reliability of the estimated models, MCMC diagnostics and goodness-of-fit (GOF) tests are conducted for the best-fitting models of each developmental stage—Model 3, Model 6, and Model 9—selected on the basis of the lowest AIC and BIC values. Due to space constraints, only the diagnostic results for Model 3 of the Initial Exploration Stage are presented here.
For MCMC diagnostics, as shown in Figure 3, the trace plots of each estimated parameter exhibit stable fluctuations around stationary values with no systematic drift across iterations, and the corresponding density plots approximate unimodal distributions, confirming that the MCMC chains have converged.
For goodness-of-fit, simulated network statistics are compared against observed network values across five dimensions: degree distribution, edge-wise shared partners, dyad-wise shared partners, geodesic distance distribution, and triad census. As shown in Figure 4, the observed statistics consistently fall within the interquartile range of the simulated distributions across all dimensions. The ROC curve approaches the upper-left corner, and the precision-recall curve performs well, indicating strong predictive accuracy. These results confirm that the model specifications adequately capture the structural characteristics of the fishery innovation cooperation network and that the estimated parameters are reliable.
5. Discussion
The spatiotemporal evolution of China’s fishery innovation cooperation network reveals a center-periphery diffusion trajectory, transitioning from a single-core structure dominated by the Yangtze River Delta to a multi-core configuration anchored by Beijing and Guangzhou. This pattern is broadly consistent with findings from other industry-specific innovation network studies in China.16,18 However, the active participation of inland resource-endowed cities alongside coastal hubs reflects the dual influence of fishery resource endowments and geographical location in shaping network boundaries—a feature distinctive to foundational industries. The persistent downward trend in network density alongside continuous scale expansion suggests that this network remains in an extensive growth phase, a developmental characteristic also observed in agricultural eco-efficiency and green innovation networks.15,30
The dominance of social proximity across all stages—and its continuous strengthening—is the most distinctive finding of this study. This is consistent with Gui et al.,24 who demonstrate that social proximity strengthens over time in knowledge collaboration networks while geographical constraints gradually diminish. The strengthening of institutional proximity is consistent with Hong & Su,23 who find that institutional proximity engendered by subordination to the same administrative unit significantly enhances the probability of collaboration in China. This mechanism operates here through shared governance structures across cities. The consistently positive effect of cognitive proximity across all three stages confirms that shared technological knowledge bases constitute a persistent structural prerequisite for fishery innovation cooperation. This is consistent with Sun and Peng22 and Sun et al.,31 who find that cognitive proximity positively drives the formation of collaborative ties in Chinese urban innovation and policy networks. The weakening inhibiting effect of geographical proximity is consistent with Ter Wal,32 who demonstrates that as knowledge networks mature, inventors increasingly rely on network-based mechanisms such as triadic closure while the direct constraining effect of geographic distance on tie formation declines, reflecting the gradual substitution of spatial by relational proximity in innovation cooperation.
The consistently positive effect of the number of universities confirms the foundational role of knowledge-producing actors at all stages of network development. The positive effect of primary industry added value only becomes significant in the Accelerated Leap Stage, suggesting that resource advantages require a sufficiently mature network environment to translate into cooperative momentum. The consistently negative effect of the administrative level reflects cities’ preference for higher-tier administrative partners, consistent with Dai et al.,33 who identify the administrative level as among the strongest exogenous drivers of intercity collaboration in China. This indicates that administrative gradient functions as a structural attractor in China’s fishery innovation system.
The significantly negative effect of weighted ties and the significantly positive effect of star structure together reveal a self-reinforcing hierarchical dynamic: cooperation is costly and selective, while resource-rich core cities continuously attract new collaborative partners. This implies that the fishery innovation network’s core-periphery structure is not merely a product of exogenous attribute differences among cities, but is actively reproduced through endogenous network processes.
6. Conclusions and Implications
6.1. Conclusions
Based on the joint invention patent data of China’s fishery industry from 2007 to 2024, this study adopts social network analysis, GIS spatial analysis and the ERGM to systematically investigate the evolutionary characteristics and formation mechanism of the fishery industry innovation cooperation network. The conclusions are as follows:
(1) The spatial evolution of the fishery industry innovation cooperation network reflects the co-driving effects of economic foundations and resource endowments. The network has progressively transformed from a single-core structure dominated by the Yangtze River Delta to a complex configuration featuring dual-core leadership by Beijing and Guangzhou, coastal city engagement, and multi-point support from inland resource-endowed cities. This evolutionary trajectory reflects a broader pattern of innovation resource concentration in administratively and economically advantaged cities, with resource-endowed peripheral cities gradually integrating into the network as the industrial chain matures. Network scale and connectivity have continuously improved, while density has fluctuated downward, the core-periphery structure has been progressively reinforced, indicating that network growth has been extensive in scale but limited in depth, and that innovation cooperation resources remain highly concentrated among a small number of core cities.
(2) The proximity mechanism exhibits systematic evolution characterized by the enduring dominance of relational trust and the gradual weakening of spatial constraints, with pronounced stage heterogeneity. Social proximity consistently exerts the strongest positive effect and continues to strengthen, indicating that trust built through accumulated prior collaborations is the most fundamental bond in fishery innovation cooperation—a pattern closely tied to the context-specific nature of fishery technical knowledge. As cooperative ties accumulate, trust-based network mechanisms grow increasingly central while the marginal constraint of geographical distance continues to narrow. Institutional proximity strengthens over time, while cognitive proximity remains consistently strong, indicating that knowledge complementarity and shared institutional environments become increasingly important as the network matures, whereas the inhibiting effect of geographical proximity progressively weakens as digital collaboration infrastructure develops.
(3) The driving effects of urban endowments exhibit structural heterogeneity and temporal asymmetry. The number of universities is a consistently positive driver across all stages, confirming that knowledge-producing actors are indispensable to sustaining fishery innovation cooperation at all stages of network development. The positive effect of primary industry added value only becomes significant in the later stage, suggesting that resource advantages require a sufficiently mature network environment to translate into cooperative momentum. The negative coefficient of administrative level reflects cities’ tendency to forge cooperative ties with higher-level administrative cities, a pattern that becomes more pronounced as the network expands, implying that administrative gradients function as a structural attractor in China’s fishery innovation system.
(4) Self-reinforcing endogenous network dynamics constitute the fundamental mechanism underlying the consolidation of the core-periphery structure. The significantly negative effect of weighted ties reveals the non-random and high-coordination-cost nature of fishery innovation cooperation, indicating that network scale expansion does not automatically generate increases in cooperation density. The significantly positive effect of the star structure reflects preferential attachment characteristics, whereby innovation-resource-rich core cities continuously attract new nodes, thereby locking in the core-periphery structure and widening the innovation gap between core and peripheral cities over time.
6.2. Implications
(1) Reinforce dual-core leadership and promote tiered network integration for resource-endowed cities. The fishery innovation cooperation network has evolved into a stable dual-core structure anchored by Beijing and Guangzhou, with peripheral cities—particularly resource-endowed inland cities—remaining structurally marginalized. Governments should leverage the policy and resource concentration advantages of core cities to direct technology outputs to sub-core cities such as Qingdao, Wuhan, and Chengdu through co-funded joint research programs, forming a tiered radiation structure that reduces dependence on spontaneous, market-driven network formation. For resource-endowed cities in central and western regions, local governments should prioritize building university and research institute capacity as the primary channel through which resource advantages can be converted into innovation cooperation momentum, given that primary industry added value only activates cooperation at mature network stages.
(2) Shift innovation policy from single-project support to long-term relationship cultivation. Social proximity is the strongest and most persistently increasing driver of network formation, demonstrating that trust accumulated through repeated collaboration—rather than one-off project funding—is the fundamental mechanism sustaining fishery innovation cooperation. Government funding agencies should therefore reorient support instruments away from short-term project grants toward sustained inter-organizational partnership programs, prioritizing continuity of collaboration over individual output metrics. Provincial science and technology departments should simultaneously advance intra-provincial fishery policy coordination to reduce institutional barriers, and invest in digital collaboration infrastructure to lower the geographic cost of maintaining long-distance cooperative relationships.
(3) Strengthen university-enterprise linkages to bridge resource endowments and innovation capacity. The number of universities is a consistently positive driver across all stages, while primary industry added value only generates significant positive effects in the final stage. This asymmetry reveals that resource advantages alone cannot generate cooperative momentum without the activation role of knowledge-producing institutions. Universities with fishery-related disciplines should be guided by government policy to establish stable, long-term collaborative relationships with fishery enterprises and research institutions in resource-rich cities, thereby deepening industry-university-research integration and accelerating the conversion of regional resource endowments into participation in innovation networks.
(4) Reduce inter-city cooperation coordination costs to drive network quality improvement. The significantly negative effect of weighted ties indicates that high coordination costs constrain cooperation density even as network scale expands, reflecting a structural quality gap between network breadth and depth. Governments should cultivate specialized fishery science and technology intermediary organizations—including technology transfer offices and industry associations—to reduce information asymmetry and transaction costs for cities initiating new partnerships. Core cities and leading enterprises should also be encouraged to leverage their preferential attachment position to actively broker connections between peripheral cities and established cooperation clusters, guiding network evolution from scale expansion toward density and quality improvement.
Acknowledgments
This work was supported by the Ministry of Education’s Major Project of the Program for Key Research in Philosophy and Social Sciences “Research on the Institutional Mechanisms for Building a Diversified Food Supply System under the Grand Food Security Concept” (25JZD021).
Authors’ Contribution – CREDIT TAXONOMY
Conceptualization: Ranran Chao (Lead). Methodology: Ranran Chao (Lead). Formal Analysis: Ranran Chao (Equal), Jie Lyu (Equal), Jingsuo Li (Equal). Investigation: Ranran Chao (Equal), Jingsuo Li (Equal). Writing – original draft: Ranran Chao (Lead). Resources: Ranran Chao (Equal), Jingsuo Li (Equal). Writing – review & editing: Jie Lyu (Equal), Jingsuo Li (Equal). Funding acquisition: Jingsuo Li (Lead). Supervision: Jingsuo Li (Lead).
Competing of Interest – COPE
No competing interests were disclosed.
Ethical Conduct Approval – IACUC
This study did not involve any experimental research on animals or plants.
Informed Consent Statement
All authors and institutions have confirmed this manuscript for publication.
Data Availability Statement
All are available upon reasonable request.