
1. Introduction
Selenotoca multifasciata, commonly known as the spotbanded scat, belongs to the family Scatophagidae and is a highly valuable fish species with both edible and ornamental purposes.
It is naturally distributed in the coastal waters of Thailand, as well as the East China Sea and South China Sea of China.1 Owing to its strong salinity tolerance, S. multifasciata can be cultured in both seawater and brackish water environments. As a marine omnivorous fish, it also exhibits broad tolerance to temperature and salinity.2 Benefiting from its rapid growth rate and delicious flesh, S. multifasciata is widely cultured in net cages and ponds across China.3 In recent years, significant progress has been made in various aspects of S. multifasciata research, including embryonic development,3 larval rearing techniques,2 polyculture systems,4 mitochondrial genome characterization,5 and the identification of sex-linked molecular markers.1 With great aquaculture potential, S. multifasciata has not yet developed into a large-scale industry, leading to relatively low research attention. Meanwhile, whole-genome sequencing was prohibitively expensive, making it unaffordable for most research groups. Therefore, the genomic resources available for S. multifasciata remain extremely limited, severely hindering in-depth studies of its genetic diversity, population structure, and molecular breeding.
Next-generation sequencing (NGS) technology enables the rapid and efficient exploration of large-scale genomic resources.6 These genomic resources are valuable for genetic breeding research, as they can provide functional genes associated with important traits, molecular markers, and targets for genome editing.7
While whole-genome sequencing and de novo assembly can provide the most comprehensive genomic information,8 genome survey analysis using low-coverage NGS data has emerged as a practical and efficient approach to assess key genomic characteristics before undertaking large-scale whole-genome sequencing projects.9–11 This approach allows researchers to estimate important genomic parameters such as genome size, heterozygosity level, GC content, and repeat sequence content, which are crucial for designing optimal sequencing strategies and selecting appropriate assembly algorithms. In recent years, genome survey analysis has been successfully applied to numerous marine fish species, including Siganus oramin,11 Scatophagus argus,12 and Harpadon nehereus.13
Microsatellites, also known as simple sequence repeats (SSRs) or short tandem repeats, are tandemly repeated DNA sequences consisting of 2–6 base pairs (bp).14 As co-dominant molecular markers with high polymorphism and genome-wide abundance, SSRs are widely used in marker-assisted selection breeding, species discrimination, genetic diversity studies, and population structure analysis.14 For example, more than 299,574 and 299,893 SSRs (ranging from mono- to hexanucleotide repeats) have been detected in female and male Scatophagus argus, respectively.12 Currently, there are no reports on SSR isolation in S. multifasciata.
Herein, a genome survey of S. multifasciata was conducted using NGS to elucidate critical genomic characteristics, including genome size, GC composition, and heterozygosity rate. Additionally, we conducted a comprehensive genome-wide identification and analysis of SSR loci and developed a set of polymorphic SSR markers. To our knowledge, this is the first report of SSR marker development in S. multifasciata. The results of this study will not only provide essential genomic resources for future whole-genome sequencing and assembly of S. multifasciata but also offer valuable molecular tools for conserving its genetic diversity and supporting sustainable aquaculture development.
2. Materials and Methods
2.1. Sample Collection and DNA Extraction
A small wild specimen of Selenotoca multifasciata (body length = 3.61 cm) was purchased from the Huangsha Aquatic Products Market in Guangzhou in December 2024. Genomic DNA was extracted from ~30 mg of -80℃ preserved muscle tissue using the TIANamp Marine Animals DNA Kit (Tiangen, Beijing), and its quality and concentration were assessed by 1% agarose gel electrophoresis and Qubit Fluorometer (Thermo Fisher Scientific), respectively.
2.2. Library Construction and Illumina Sequencing
The qualified DNA sample was randomly sheared using an ultrasonic crusher (Covaris M220, Woburn, MA, USA). A paired-end (PE) library with an insert size of 350 base pairs (bp) was constructed from the randomly fragmented genomic DNA. Subsequently, the DNA library was sequenced on the Illumina NovaSeq sequencing platform (Illumina, San Diego, CA, USA) in PE 150-bp mode with a sequencing depth of 50×.
2.3. Sequence Assembly and Analysis
Raw reads were processed with fastp 1.015 to remove adapter-contaminated, poly-N, and <75 bp reads, yielding clean reads for all subsequent analyses. Clean reads were assembled into contigs using SOAPdenovo v2.04 (k-mer=41; Luo et al.16), then scaffolded. For contamination check, 10,000 random clean reads were aligned to NCBI NT database via BLASTN (e-value<1e⁻¹⁰, coverage>80%).
2.4. Estimation of Genome Size, GC Content, and Repeat Ratio
Genome size, heterozygosity and repeat content were estimated via 17-mer analysis using Jellyfish 2.1.417 and GenomeScope.18
2.5. Microsatellite Identification and Analysis
Sequences with a length≥300 bp were selected for SSR analysis. SSRs were screened using the MISA script with thresholds: ≥6 repeats for dinucleotides, ≥5 for tri- to hexanucleotides. The number, frequency, and motif types of SSRs were collected and statistically analyzed using WPS Office. Primers for SSR loci with≥80 bp flanking sequences were designed using Primer3, with parameters: PCR product 100-330 bp, primer length 18-27 bp, GC content 40-60%, Tm 57-63℃.
2.6. SSR Validation, Genotyping, and Data Analyses
Fifty-three SSR primer pairs were synthesized by Sangon Biotech (Shanghai, China) (Table S1). PCR was performed on a Bio-Rad T100 Thermal Cycler in 20-μL reactions containing 50 ng genomic DNA, 1 U Taq polymerase (Accurate, Changsha), 1×Mg²⁺-containing buffer, 0.2 mM dNTPs, and 0.2 μM each primer. Cycling conditions: 94°C 5 min; 35 cycles of 94°C 30 s, 52–56°C (determined by the annealing temperature of the primer)
30 s, 72°C 30 s; 72°C 5 min. Amplicons were verified by 1% agarose gel electrophoresis. Validated forward primers were 5′-labeled with HEX/FAM, and fluorescent PCR products were analyzed by ABI 3730XL capillary electrophoresis with GeneMapper v6.0.
Thirty pairs of SSR primers yielded clear and stable amplification bands. Nine polymorphic SSR loci exhibiting clear fragment-length polymorphisms were empirically screened from eight individuals. We assessed the genetic diversity of 30 wild S. multifasciata individuals from Zhanjiang Bay using these nine SSR primer pairs. Genetic variation parameters, including the number of alleles (Na), number of effective alleles (Ne), observed heterozygosity (Ho), expected heterozygosity (He), and Shannon’s Information Index (I), were calculated using Popgene 1.32.19 The polymorphism information content (PIC) was determined using Cervus v3.0.7.20
3. Results
3.1. Genome Sequencing and K-mer Analysis
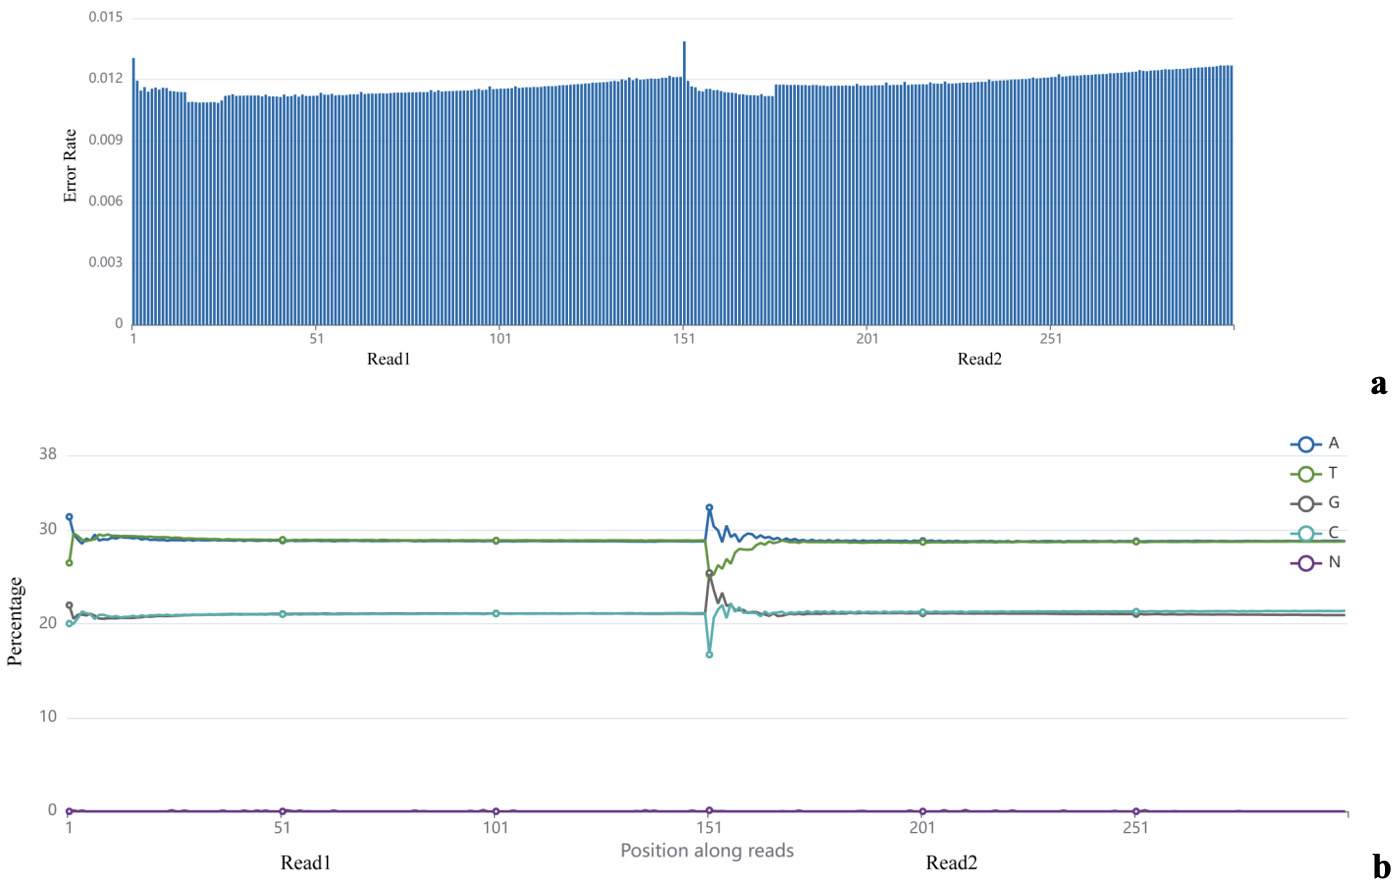
NGS generated a total of 51.63 Gb of raw data, corresponding to 172,112,276 raw reads (Table 1). After filtering and trimming low-quality sequences, more than 42.59 Gb of clean data (141,896,297 clean reads) were obtained (Table 1). The Q20 and Q30 values were 98.77% and 96.64%, respectively, with a sequencing error rate of 0.01% (Table 1, Fig. 1a).
_and_gc_content_(b).png)
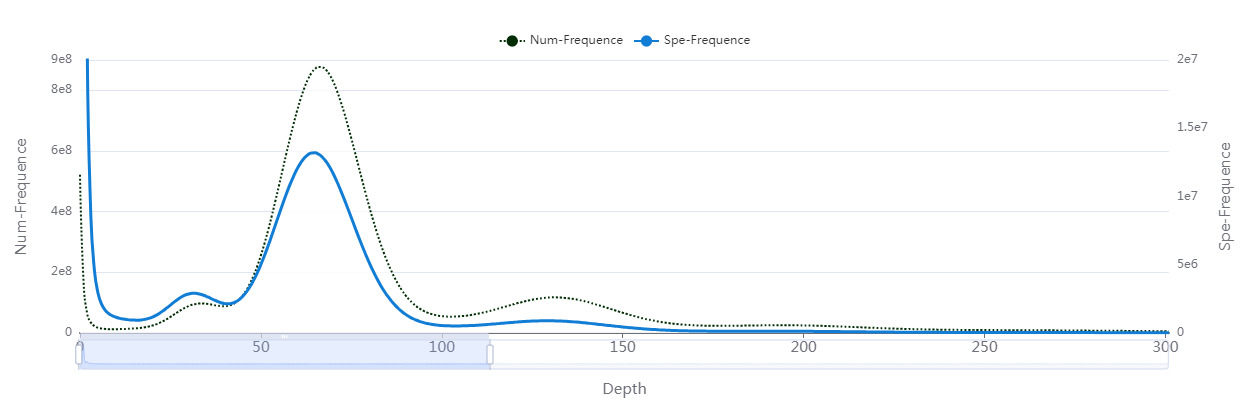
Genome survey analysis was performed using a 17-mer approach based on all clean reads. The K-mer depth distribution showed a main peak at a depth of 66, with a weak heterozygous peak observed between depths of 30 and 40 (Fig. 2). A total of 37,975,091,143 valid K-mers were generated (Table 2). Based on the K-mer distribution, the estimated genome size was 575.38 Mb, and the revised genome size was 567.48 Mb after filtering low-frequency erroneous K-mers (Table 2). The heterozygosity rate was calculated to be 0.43% (Table 2). In addition, the Num-Frequency curve exhibited a clear tailing pattern at depths greater than 100 (Fig. 2), and the repeat sequence ratio was estimated to be 25.97% (Table 2).
_distribution_for_estimating_the_genome_size_of_*s._multifasciata*._the_x-axis.png)
BLASTN analysis of randomly selected reads showed that the best hits were enriched in closely related fish species, including Dicentrarchus labrax (0.9%), Haplochromis burtoni (0.47%), Takifugu rubripes (0.29%), Oreochromis niloticus (0.28%), and Xiphophorus maculatus (0.16%).
3.2. Genome Assembly and Size
Details of contig and scaffold assembly for the draft genome are presented in Table 3, 551,813 contigs (587.82 Mb, N50=4,223 bp) were assembled into 431,116 scaffolds (593.38 Mb, N50=9,458 bp).
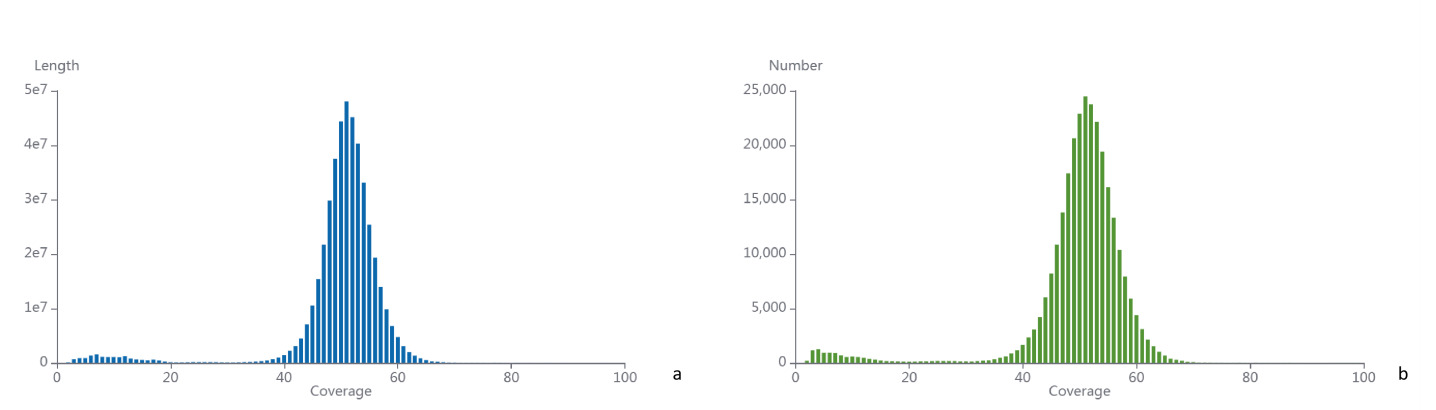
The coverage distribution of the assembled contigs was evaluated. The length distribution exhibited a prominent peak at 51×coverage, representing the effective sequencing depth of single-copy genomic regions (Fig. 3a). The number distribution also peaked at 51× coverage, confirming that most contigs were uniformly covered (Fig. 3b).
__contig_coverage_depth_and_number_dist.png)
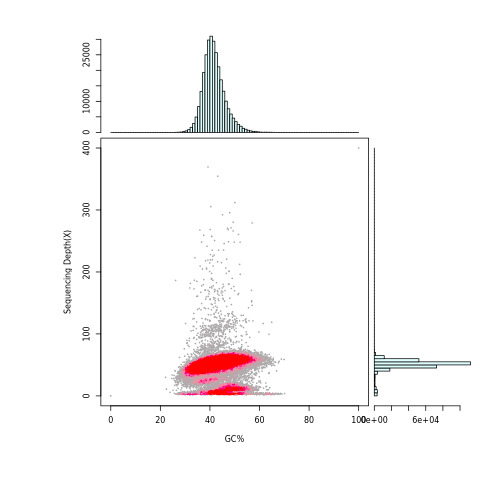
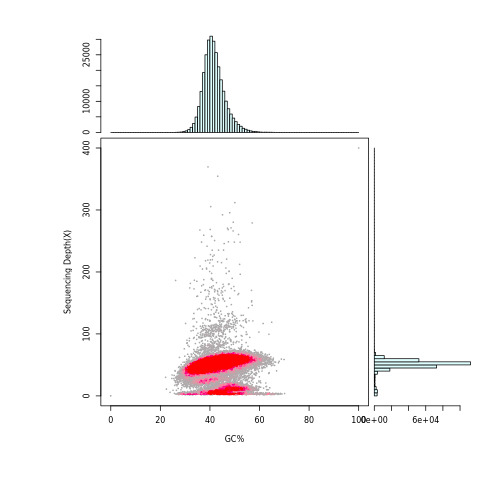
The GC content versus sequencing depth distribution was analyzed to assess data quality and genomic characteristics (Fig. 4). A prominent dense cluster was observed at GC% ≈ 40–50% and sequencing depth ≈ 30–60×. The unimodal GC histogram confirmed an average GC content of ~45% (Fig. 4). The sequencing depth histogram showed a main peak at ~50×. The GC-depth distribution was segregated into two layers: a low-depth layer below a high-depth layer (Fig. 4).
3.3. SSR Identification
A total of 214,419 SSR loci were identified from the assembled sequences (Table 4; Table S2). Dinucleotide repeats were the most abundant SSR type (172,576 loci, 80.49%), followed by trinucleotide (27,341 loci, 12.75%), tetranucleotide (10,753 loci, 5.01%), pentanucleotide (3,336 loci, 1.56%), and hexanucleotide repeats (413 loci, 0.19%) (Table 4). The overall microsatellite density was 377.84 loci/Mb, dominated by dinucleotide repeats (304.11 loci/Mb), followed by trinucleotide (48.18 loci/Mb) and tetranucleotide repeats (18.95 loci/Mb). Total SSR length was 1.15 Mb, representing 0.20% of the S. multifasciata draft genome (Table 4).
A total of 239 SSR motifs were detected in the assembled S. multifasciata genome, with 4, 10, 31, 88 and 106 types for di- to hexanucleotide repeats, respectively (Table S2). The repeat number of all motifs ranged from 5 to 19, with a general trend of decreasing copy number with increasing repeat unit length. Dinucleotide motifs were concentrated in 6–19 repeats, trinucleotide motifs in 5–13 repeats, and hexanucleotide motifs in 5–7 repeats (Table S2). The most abundant repeat number was 6, with 44,987 motifs (20.98%), followed by 7 repeats (29,892 motifs, 13.94%) and 8 repeats (21,939 motifs, 10.23%) (Table S2).
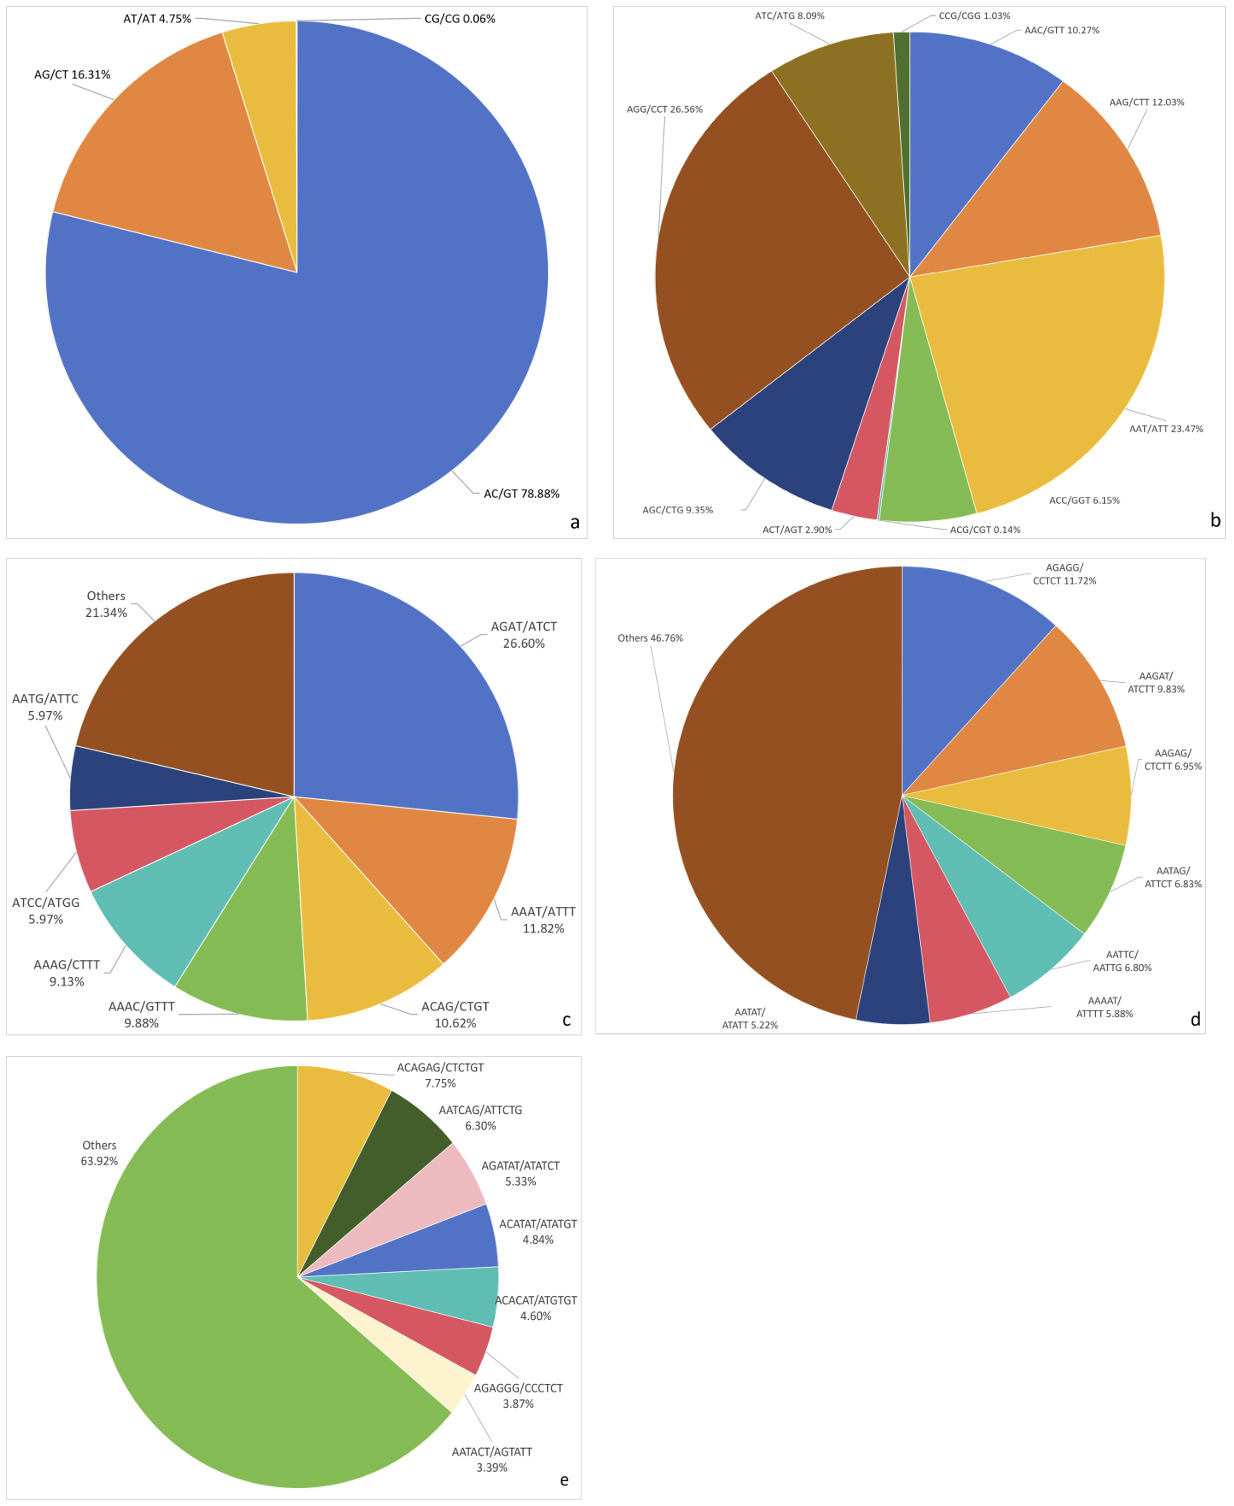
AC repeats were the most abundant SSR motif (136,135 loci, 239.89 loci/Mb), followed by AG repeats (28,147 loci, 49.60 loci/Mb) and AT repeats (8,192 loci, 14.44 loci/Mb) (Table 5), accounting for 78.88%, 16.31%, and 4.75% of dinucleotide repeats, respectively (Fig. 5). For trinucleotide repeats, AGG was the most abundant motif (7,262 loci, 12.80 loci/Mb), followed by AAT (6,416 loci, 11.31 loci/Mb) and AAG (3,290 loci, 5.80 loci/Mb) (Table 5), representing 26.56%, 23.47%, and 12.03% of trinucleotide repeats (Fig. 5). AGAT was the most abundant tetranucleotide motif (2,860 loci, 5.04 loci/Mb), accounting for 26.60% of tetranucleotide repeats (Fig. 5). AGAGG and ACAGAG were the dominant pentanucleotide and hexanucleotide motifs, respectively, although their proportions were relatively low (Fig. 5).
_dinucleotide._(b.png)
3.4. Development of Genome-Wide SSR Markers
Primers were designed for all identified SSR loci based on their flanking sequences, yielding 75,315 genome-wide SSR markers in S. multifasciata (Table 6). The frequency of SSR markers was 132.72 loci/Mb. Dinucleotide repeats were the most abundant type, with 57,333 markers (76.13% of the total SSR markers), followed by trinucleotide (13,731 markers, 18.23%) and tetranucleotide repeats (3,656 markers, 4.85%) (Table 6). In contrast, pentanucleotide (515 markers, 0.68%) and hexanucleotide repeats (75 markers, 0.10%) accounted for only a very small proportion of the total SSR markers.
3.5. Validation and Polymorphism Analysis of SSR Markers
To evaluate the polymorphism of the developed SSR markers, 53 pairs of primers were synthesized (Table S1). Of the tested primer sets, 30 (56.60%) produced clear and reproducible bands after PCR amplification. Nine pairs of these primers were selected for capillary fluorescence electrophoresis to analyze 30 wild S. multifasciata individuals from Zhanjiang Bay (Table S1). Table 7 summarizes genetic diversity parameters for the 9 microsatellite loci. A total of 48 alleles were detected, with Na=2.0000–8.0000 (mean 5.3333), Ne=1.3846–3.5857 (mean 2.6190), Ho=0.20000–0.8667 (mean 0.4704), He=0.2825–0.7333 (mean 0.5827), I=0.4506–1.5274 (mean 1.1492), and PIC=0.2392–0.6866 (mean 0.5340). Most loci showed moderate to high polymorphism, suitable for population genetic analysis.
4. Discussion
4.1. Genome Sequencing Characteristics of S. multifasciata
S. multifasciata has become a valuable marine aquaculture species in the southeast coastal areas of China.1 With breakthroughs in artificial breeding technology, large-scale cultivation of S. multifasciata has become feasible. However, research on this species remains limited, especially regarding the mining and utilization of its genetic resources. Genomic characteristics, including genome size, heterozygosity, GC content, and repeat ratio, can be efficiently analyzed using NGS and K-mer analysis without prior genomic information.21 In recent years, this strategy has been successfully applied to genomic studies of several marine fish species, such as Siganus oramin,11 Gadus macrocephalus,22 and Scatophagus argus.12 In the present study, the draft genome of S. multifasciata was sequenced and assembled, and key genomic parameters, including genome size, repeat content, heterozygosity, and GC content, were evaluated. The present genome survey was performed based on a single individual of S. multifasciata, which inevitably imposes several inherent limitations on genomic parameter estimation. All genomic characteristics calculated in this study, including genome size, heterozygosity, GC content, and repetitive sequence proportion, only reflect the genomic features of the sampled specimen rather than universal species-level or population-level genomic traits.23,24 Owing to the lack of geographic population background and biological replicates, individual-specific genetic variants, rare mutations, and unique heterozygous site distributions may lead to biased parameter estimates. Furthermore, potential local population differentiation, germplasm introgression, and genetic drift cannot be ruled out, making it impossible to determine whether the observed genomic signatures reflect species-conserved characteristics or stochastic variation at the individual level.23,24 Accordingly, these preliminary genomic estimates cannot serve as standardized baseline data for wild germplasm evaluation, population genetic analysis, or comparative genomic research of conspecific populations. Instead, they should only be regarded as fundamental reference information for future high-quality chromosome-level genome assembly and subsequent molecular marker development. To obtain more accurate and representative genomic parameters, future studies should include multiple individuals from different geographic populations to reduce individual genetic noise and validate population-level genomic characteristics.
Quality assessment of the raw sequencing data showed high Q20 (98.77%) and Q30 (96.64%) values (Table 1), indicating high data quality suitable for subsequent genome assembly and survey analysis. K-mer analysis has been widely used to estimate genome size in various animals.11,25 In this study, the estimated genome size of S. multifasciata was 567.48 Mb (Table 2), which is larger than that of Siganus oramin (447.63 Mb; Huang et al.11) and Sillago sihama (508 Mb; Li et al.26), but smaller than that of Scatophagus argus (597.60 Mb; Huang et al.12) and Gadus macrocephalus (658.22 Mb; Ma et al.22).
The genomic repeat ratio may affect genome size and chromosomal structure.27 The Num frequency curve exhibited obvious tailing at sequencing depths greater than 100 (Fig. 2), whereas the length distribution showed no obvious tailing at high coverage (Fig. 3a). The repeat ratio of the S. multifasciata genome was 25.97%, representing a moderate level of repetitive sequences. This value is close to that of Scatophagus argus (27.06%; Huang et al.12), Protosalanx hyalocranius (24.43%; Liu et al.28), and Siganus oramin (28.01%; Huang et al.11), but lower than that of Acanthogobius ommaturus (38.31%; Chen et al.29) and Pogonophryne albipinna (39.03%; Jo et al.25).
Besides repetitive sequences, heterozygosity is another critical factor affecting genome assembly and analysis.27 High heterozygosity often leads to fragmented assembly, redundant contigs, and overestimated genome size.27 Assembly becomes particularly challenging when heterozygosity exceeds 0.5%.17 In this study, a weak secondary peak was observed to the left of the main K-mer peak, and the estimated heterozygosity was 0.43%, indicating low to moderate heterozygosity. Moreover, the narrow and symmetric peak shape suggested uniform sequencing coverage and reliable assembly quality (Fig. 3b). Collectively, these results demonstrate that the S. multifasciata genome has relatively low heterozygosity, facilitating genome assembly.
Genomes with heterozygosity below 1% are generally considered easy to assemble.17 Thus, the genome of S. multifasciata is amenable to high quality assembly. The GC content of most marine fish exceeds 40%, such as Scatophagus argus (41.78%; Huang et al.12), Acanthopagrus latus (42.07%; Zhu et al.30), and Sillago sihama (45.04%; Li et al.26). Consistent with these reports, the GC content of S. multifasciata was 42.20% (Table 1; Fig. 4), which falls within the favorable range for genome sequencing and assembly.31
In conclusion, the S. multifasciata genome exhibits a moderate size, low to moderate heterozygosity, and a moderate proportion of repetitive sequences, all of which are conducive to high quality genome assembly. Based on these findings, we propose that a high-quality chromosome-level genome of S. multifasciata can be constructed in future studies using PacBio long-read sequencing and Hi-C technology. Chromosome-level genome assembly enables precise characterization of chromosomal architecture, gene arrangement, repetitive sequence distribution, and large-scale structural variations, providing a fundamental resource for studying fish evolution, trait localization, stress adaptation mechanisms, and germplasm genetics.32,33
4.2. Characterization of SSRs
SSR loci can be efficiently, accurately, and rapidly identified from genomic sequences. With decreasing costs of genome sequencing, large numbers of SSRs have been mined from genomic data in many species. To date, no studies on SSR development have been reported in S. multifasciata. In this study, a total of 214,419 SSR loci were identified from genome survey data. This number is lower than those reported in A. ommaturus (349,138), G. macrocephalus (789,860), and H. nehereus (760,890),13,22,29 but higher than those in Sillago sihama (149,257; Li et al.26) and Sebastiscus marmoratus (191,592; Xu et al.34). Generally, the total number of SSRs is correlated with genome size.22,26 In addition, the parameters used for SSR detection also influence the total number of identified loci. The density of microsatellites in the S. multifasciata genome was 377.84 loci/Mb, which is higher than that in S. sihama (293.81 loci/Mb; Li et al.26) and A. ommaturus (376.23 loci/Mb; Chen et al.29). This may be caused by the following reasons. First, intrinsic biological factors of the species play a decisive role, and replication slippage constitutes the primary driver of microsatellite expansion. Higher mismatch repair (MMR) activity leads to fewer accumulated SSRs and lower SSR density.35 Second, technical artifacts from genome survey sequencing36 introduce bias: insufficient sequencing depth and short read lengths fail to span long tandem microsatellites, resulting in extensive missed detection of long SSR loci.37 Third, artificial SSR screening thresholds (minimum repeat copy number) directly alter statistical estimates of SSR density. The SSR filtering parameters used for S. sihama differ slightly from those used for A. ommaturus and S. multifasciata.26,29
Among all SSR types, dinucleotide repeats were the most abundant (80.49%, 304.11 loci/Mb) in the S. multifasciata genome, followed by trinucleotide (12.75%, 48.18 loci/Mb) and tetranucleotide repeats (5.01%, 18.95 loci/Mb). This pattern is consistent with previous studies in fish; for instance, dinucleotide repeats accounted for 74.42% in Siganus oramin11 and 86.87% in Pogonophryne albipinna.25 This phenomenon can be explained by the short repeat unit (2 bp) of dinucleotide motifs, which are more prone to DNA polymerase slippage during replication, leading to higher mutation rates and more frequent expansion. The AC motif was the most dominant dinucleotide repeat, followed by AG, which is consistent with observations in other fish species,10,38 Macaca mulatta,39 and mosquitoes.40
Owing to the limited length of scaffolds generated from genome survey sequencing, the maximum repeat number of SSRs in S. multifasciata was only 19, much lower than that detected in high quality assembled genomes. For example, SSR repeat numbers range from 5 to 447 in Lateolabrax maculatus,38 5 to 319 in A. latus,10 and 5 to 259 in Hypophthalmichthys molitrix.41 In addition, the total length of SSR regions in S. multifasciata was 1.15 Mb (Table 4), considerably lower than that in L. maculatus (5.12 Mb; Fan et al.38), H. molitrix (6.49 Mb; Wang et al.41), and A. latus (9.07 Mb; Peng et al.10). SSR analyses of these species were all based on complete genome assemblies. Therefore, obtaining a high quality reference genome of S. multifasciata will enable more comprehensive identification of SSR loci and deeper exploration of its genetic resources.
SSR markers were successfully developed by designing primers based on sequences flanking SSR loci.14 In this study, 75,315 SSR markers were obtained, representing only 35.16% of all detected SSR loci. The low conversion rate was mainly attributed to the short flanking sequences of many SSR loci, which hindered the design of suitable primers. Subsequently, 53 markers were randomly selected and validated in 30 wild S. multifasciata individuals, and six highly polymorphic SSR markers (PIC > 0.5) were identified.42
In summary, this study performed a genome survey of S. multifasciata using K-mer analysis to estimate genome size, heterozygosity, GC content, and repeat ratio. Furthermore, we systematically characterized the distribution of SSRs and identified polymorphic SSR markers. These results provide a valuable basis for whole genome sequencing and assembly of S. multifasciata, as well as important genomic resources for its genetic breeding and improvement.
Acknowledgments
This work is supported by the Open Program of Key Laboratory of Cultivation and High-value Utilization of Marine Organisms in Fujian Province (2025fjscq04); Hunan Natural Science Foundation Youth Project (2024JJ6331); the Excellent Young Scholars Project of Hunan Provincial Department of Education (25B0629); the Open Foundation of the Hunan Provincial Key Laboratory for Molecular Immunity Technology of Aquatic Animal Diseases (2025KF07).
Authors’ Contribution
Conceptualization: Chao Peng (Lead). Formal Analysis: Chao Peng (Lead). Data curation: Chao Peng (Lead). Writing – original draft: Chao Peng (Lead). Methodology: Gaojie Chen (Equal), Peirong Ye (Equal), Linwen Xie (Equal), Xianzhen Luo (Equal). Writing – review & editing: Shuiqing Wu (Lead). Validation: Shuiqing Wu (Lead). Supervision: Shuiqing Wu (Lead). Project administration: Shuiqing Wu (Lead). Investigation: Sigang Fan (Lead).
Competing of Interest – COPE
No competing interests were disclosed.
Ethical Conduct Approval – IACUC
The study was conducted in accordance with the Declaration of Helsinki, and were approved by the Hunan University of Arts and Science Institutional Animal Care and Use Committee.
Informed Consent Statement
All authors and institutions have confirmed this manuscript for publication.
Data Availability Statement
All are available upon reasonable request.
Supplementary data
Table S1 Microsatellite markers used in this study.
Table S2 Summary of SSR motifs and repeats.