
Introduction
Light is one of the most important environmental factors regulating fish physiology. In aquaculture systems, artificial light is mainly determined by spectral composition, light intensity, and photoperiod. These factors can influence feeding activity, growth, endocrine rhythms, reproductive maturation, and immune status through retinal, pineal, and deep-brain photoreceptive pathways.1–5 Therefore, light regulation has become a useful management tool in broodstock culture and controlled reproduction.
However, excessive or insufficient illumination can impair reproductive performance and health. Photoperiod is widely regarded as a key signal for synchronizing seasonal reproductive rhythms in teleosts. Changes in day length can alter melatonin secretion and regulate the hypothalamic-pituitary-gonadal axis, thereby affecting gonadotropin secretion, steroidogenesis, and gametogenesis.6–12 Spectral composition has species-specific effects on fish reproduction. Blue, green, and red light have been reported to produce different responses in Nile tilapia, yellowtail damselfish, little yellow croaker, and red spotted grouper.12–16 In addition, light intensity can modify physiological responses by changing stress status, energy allocation, and oxidative balance.11,17–21 These differences are likely associated with species-specific habitat adaptation and visual sensitivity. However, the combined effects of spectrum, light intensity, and photoperiod are less well understood than the effect of every single factor.
Reproductive development is closely related to endocrine and immune status. Plasma 17β-estradiol (E2) and testosterone (T) are important indicators of ovarian and testicular endocrine activity in teleosts.22–25 Immunoglobulin M (IgM) and complement component 3 (C3) are commonly used to evaluate humoral immunity and innate immune activation.26–30 Because reproductive processes and immune responses are closely linked, simultaneous evaluation of gonadal histology, sex steroid hormones, and immune factors can provide a more complete understanding of broodstock physiological status.
Hexagrammos otakii is an economically important cold-temperate marine fish in China. Previous studies have mainly focused on artificial breeding, nutrition, intestinal health, and early development.31–34 However, information on light-environment regulation of gonadal development and immunity in this species remains limited. Therefore, this study evaluated the effects of light spectrum, photoperiod, and intensity on gonadal maturation, steroid hormone secretion, and immune status in H. otakii, with the aim of providing practical guidance for broodstock light management.
Materials and Methods
1. EXPERIMENTAL FISH AND FEEDING MANAGEMENT
Adult H. otakii were obtained from the Key Laboratory of Applied Biology and Aquaculture in Northern China, Dalian Ocean University. The average body length and body weight of the fish were 25.71 ± 5.58 cm and 381.97 ± 15.87 g, respectively. All broodstock were confirmed to be at a comparable gonadal developmental stage before the trial.
The experiment was carried out in 600 L tanks equipped with bottom-side drainage valves. A 14-day acclimation period was followed by a 60-day light-exposure trial. Nine artificial-light treatment groups and one natural-light reference group were established. Each group had three replicate tanks, and 30 broodstock were randomly assigned to each tank at a female-to-male ratio of 1:1. The tank was considered the experimental unit, and individual-fish measurements were averaged within each tank before statistical analysis. During the trial, water temperature was maintained at 16-20 °C, salinity at 27 ± 2 ppt, pH at 7.9 ± 0.4, and dissolved oxygen at 6.6 ± 0.7 mg/L. Total ammonia nitrogen and nitrite were maintained below 0.1 mg/L by exchanging one-third of the tank water twice daily. Fish were fed soft pellets twice daily at 07:30 and 16:00 to apparent satiation, and uneaten feed was removed after feeding.
2. LIGHT TREATMENTS
Three light spectra (red, 629 nm; green, 533 nm; and blue, 450 nm), three photoperiods (8L:16D, 12L:12D, and 24L:0D), and three light intensities (200, 1500, and 3000 lx) were arranged according to an L9(33) orthogonal design. The artificial-light treatments were designated R1-R3, G1-G3, and B1-B3. Specifically, the red-light treatments were R1 (1500 lx, 8L:16D), R2 (200 lx, 12L:12D), and R3 (3000 lx, 24L:0D); the green-light treatments were G1 (1500 lx, 12L:12D), G2 (200 lx, 24L:0D), and G3 (3000 lx, 8L:16D); and the blue-light treatments were B1 (1500 lx, 24L:0D), B2 (200 lx, 8L:16D), and B3 (3000 lx, 12L:12D). The natural-light reference was maintained under the ambient light conditions of the culture facility without artificial manipulation (Table 1). During the 60-day trial, the natural photoperiod varied from approximately 12L:12D to 15L:9D, and the natural light intensity reaching the water surface fluctuated between 1000 and 5000 lx depending on weather conditions and time of day. Because its spectrum, intensity, and photoperiod varied simultaneously, the natural-light group was treated as a practical husbandry reference rather than as a controlled orthogonal treatment.
Black shading cloth and light-blocking plates were used to prevent light leakage among tanks. Lighting fixtures were supplied by Shenzhen Anhong Ruida Technology Co., Ltd. The lamps were connected to an automatic timing-control system according to the assigned photoperiods. Light intensity was measured and calibrated daily using an illuminance meter (Zhejiang Yonghua Precision Electrical Manufacturing Co., Ltd., Yongkang, China). Because illuminance (lux) is weighted by the human photopic response, equal lux values at different wavelengths do not represent equal photon irradiance. To quantify the magnitude of these differences and aid interpretation, the recorded photometric setpoints were retrospectively converted to estimated theoretical photon flux density (PFD). The conversion was conducted using the following standard physical equation:
PFD=Ev×λ×0.00836683×V(λ)
where Eᵥ is the measured illuminance in lux, λ is the nominal peak wavelength of the LED (nm), and V(λ) is the standard relative visual sensitivity at that wavelength. The estimated PFD values for all experimental groups are presented in Table 2. These calculations assumed monochromatic emission at the nominal peak wavelength and did not account for the full spectral power distribution of the lamps. Spectral power distributions and photon flux densities were not measured directly; therefore, the calculated values are approximate and do not replace direct radiometric measurements.
3. SAMPLE COLLECTION
At the end of the 60-day trial, fish were fasted for 24 h and anesthetized with tricaine methanesulfonate (MS-222, 100 mgL-1). Eighteen fish, comprising nine females and nine males, were randomly sampled from each replicate tank. Thus, 27 females and 27 males were sampled from the three replicate tanks in each treatment group. Blood was collected from the caudal vein using sterile syringes and centrifuged at 1000 × g for 15 min at 4 °C. The plasma was aliquoted and stored at -80 °C for the determination of sex steroid hormones and immune parameters. Plasma E2 was determined in the sampled females, whereas plasma T was determined in the sampled males. Plasma IgM and C3 were determined in all sampled fish.
After blood collection, fish were dissected and gonads were removed. Sex was identified according to gonadal morphology. Portions of gonadal tissues were fixed in Bouin’s solution for histological examination, while the remaining tissues were frozen in liquid nitrogen and stored at -80 °C.
4. HORMONE AND IMMUNE PARAMETER DETERMINATION
Plasma E2 (Cat. No. H102-1-2), T (Cat. No. H090-1-2), IgM (Cat. No. H109-1-2), and C3 (Cat. No. H186-1-2) concentrations were measured using the corresponding commercially available enzyme-linked immunosorbent assay (ELISA) kits (Nanjing Jiancheng Bioengineering Institute, Nanjing, China), according to the manufacturer’s instructions.
5. HISTOLOGICAL ANALYSIS
Ovarian and testicular samples were fixed, dehydrated through a graded ethanol series, cleared in xylene and embedded in paraffin. Sections were cut at 5 µm, stained with hematoxylin and eosin, mounted on glass slides and observed under an optical microscope. Ovarian and testicular developmental stages were assessed according to the standardized terminology for reproductive development in fishes.35
Nine females and nine males from each replicate tank were used for ovarian and testicular histological analyses, respectively. Therefore, 27 females and 27 males were examined histologically in each treatment group. For each fish, three non-consecutive sections were analyzed, and at least five randomly selected microscopic fields were counted per section. To minimize observer bias, all histological slides were assigned coded identification numbers before quantification. Germ-cell staging and counting were performed by an investigator blinded to treatment identity, and the treatment codes were revealed only after all histological measurements had been completed. The percentage of each developmental stage was calculated as the number of cells at that stage divided by the total number of germ cells counted and multiplied by 100. Fish-level percentages were averaged within each replicate tank to generate one tank-level value for statistical analysis.
6. STATISTICAL ANALYSIS
Data are expressed as mean ± standard deviation (SD). Normality and homogeneity of variance were assessed before analysis. Differences among treatment combinations were analyzed by one-way ANOVA followed by Tukey’s multiple-comparison test. Orthogonal range analysis was used to evaluate the main effects of light spectrum, photoperiod, and light intensity. The natural-light reference was included in the one-way comparisons but excluded from the orthogonal range analysis because its light conditions were uncontrolled. Statistical significance was set at P < 0.05. Statistical analyses were performed using SPSS 29.0, and figures were prepared using GraphPad Prism 10.0. The tank was considered the experimental unit. Individual-fish measurements within each tank were averaged to generate one tank-level value; therefore, the sample size used for statistical inference was three replicate tanks per treatment (n = 3).
Results
1. GONADAL HISTOLOGY
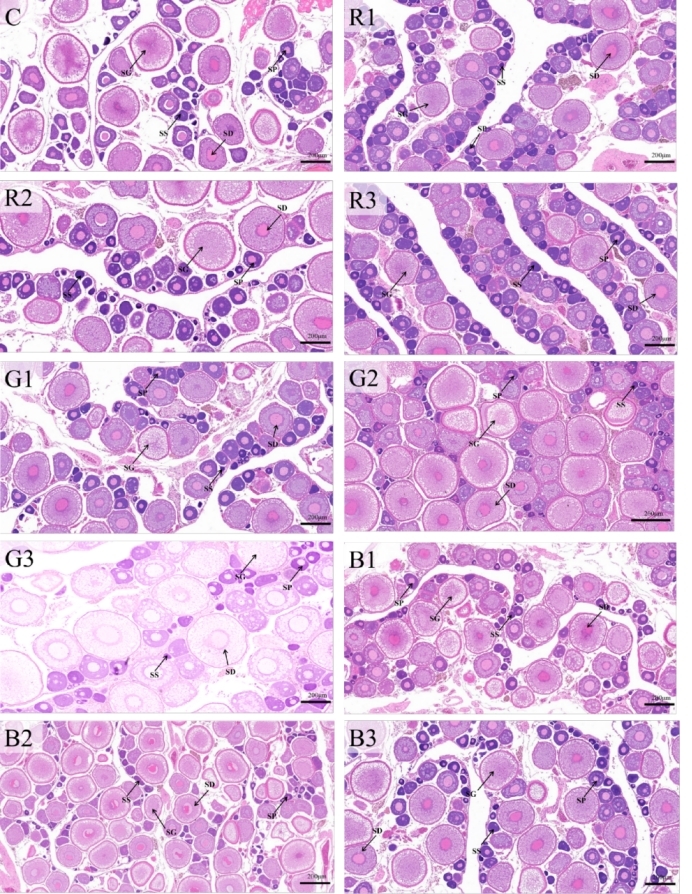
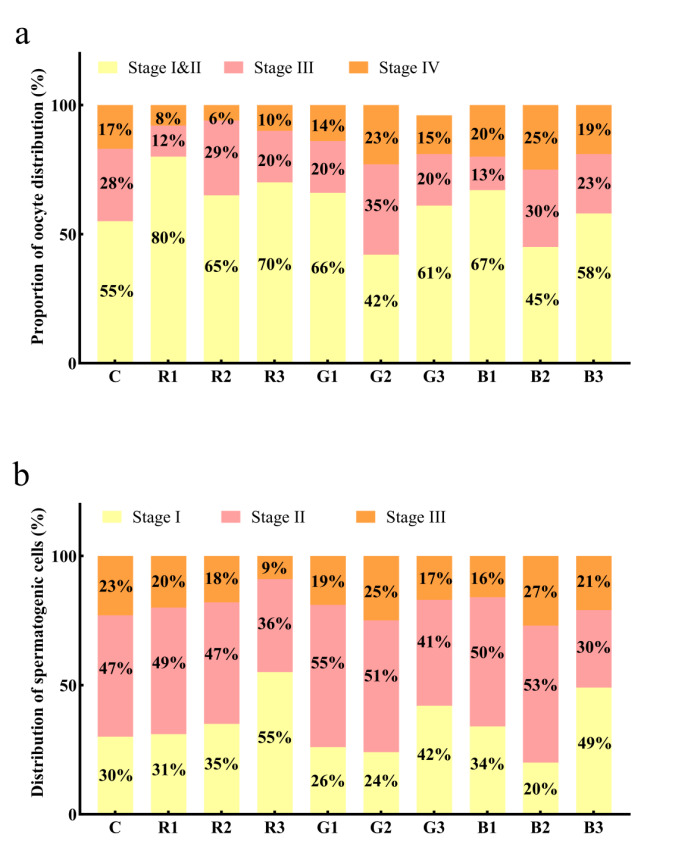
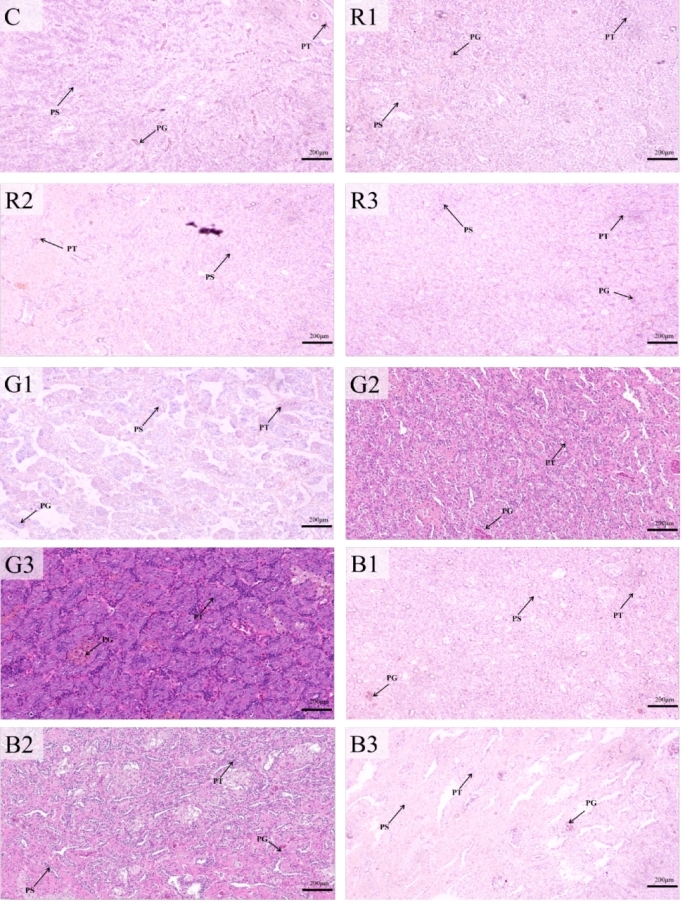
As shown in Fig. 1 and Fig. 3(a), gonadal development differed among light treatments. Ovarian tissues in all groups contained oocytes at different developmental stages. Stage I and stage II oocytes were dominant in most groups, while stage IV oocytes represented the most advanced maturation stage observed in this study.
_of_ovarian_tissue_slices_under_differe.jpeg)
The highest proportions of stage IV oocytes were observed under blue light at 200 lx with an 8L:16D photoperiod and green light at 200 lx with a 24L:0D photoperiod (B2 and G2, respectively), reaching approximately 25% and 23%, compared with approximately 17% in the natural-light reference. All three red-light combinations showed lower proportions of stage IV oocytes than the two 200-lx blue- and green-light combinations. Among the red-light treatments, red light at 200 lx under 12L:12D (R2) showed the lowest proportion, at approximately 6%. Ovaries exposed to the two 200-lx blue- and green-light combinations contained more vitellogenic oocytes with enlarged cytoplasm and abundant yolk accumulation, whereas the red-light combinations contained higher proportions of early-stage oocytes.
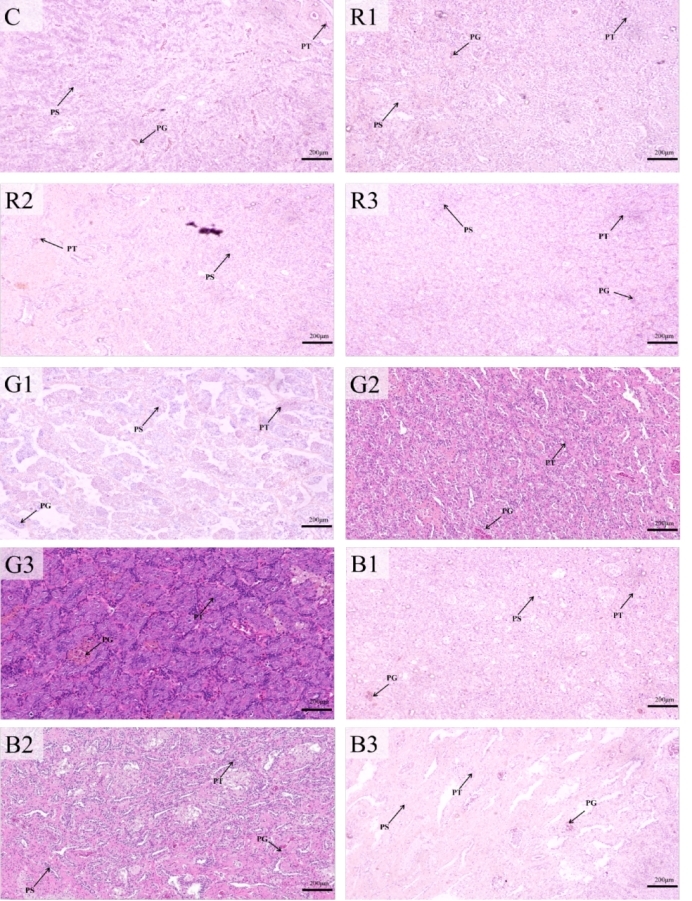
As shown in Fig. 2 and Fig. 3(b), a similar response was observed in testicular development. The highest proportions of stage III spermatogenic cells were observed under green light at 200 lx with a 24L:0D photoperiod and blue light at 200 lx with an 8L:16D photoperiod (G2 and B2, respectively), reaching approximately 25% and 27%. In contrast, red light at 3000 lx under 24L:0D (R3) produced the lowest proportion, at approximately 9%. Testes exposed to the two 200-lx green- and blue-light combinations contained higher proportions of advanced spermatogenic cells, whereas testes exposed to red light at 3000 lx under 24L:0D were dominated by earlier spermatogenic stages.
_and_spermatocytes_(b)_at_different_stages_in_differe.png)
2. ORTHOGONAL RANGE ANALYSIS OF GONADAL DEVELOPMENT
The orthogonal range-analysis results are shown in Tables 3 and 4. For ovarian development, the level mean (K) for the combined proportion of stage III and stage IV oocytes was highest under blue light (43.33), followed by green light (42.33) and red light (28.33). Among the illuminance levels, 200 lx produced the highest mean value (49.33), whereas 1500 lx produced the lowest value (29.00). For photoperiod, 24L:0D produced the highest mean value (40.33), followed by 12L:12D (37.00) and 8L:16D (36.67). Based on the range (R) values, the main-effect ranking was illuminance (20.33) > spectrum (15.00) > photoperiod (3.66). The range analysis therefore suggested a theoretical combination of blue light, 200 lx, and 24L:0D for ovarian development; this complete combination was not directly tested.
For testicular development, the level mean (K) for the combined proportion of stage II and stage III spermatogenic cells was highest under green light (69.33), followed by blue light (65.67) and red light (59.67). Among the illuminance levels, 200 lx produced the highest mean value (73.67), whereas 3000 lx produced the lowest value (51.33). For photoperiod, 8L:16D produced the highest mean value (69.00), followed by 12L:12D (63.33) and 24L:0D (62.33). Based on the range values, the main-effect ranking was illuminance (22.34) > spectrum (9.66) > photoperiod (6.67). The range analysis, therefore, suggested a theoretical combination of green light, 200 lx, and 8L:16D for testicular development; this complete combination was not directly tested.
3. PLASMA IMMUNE PARAMETERS
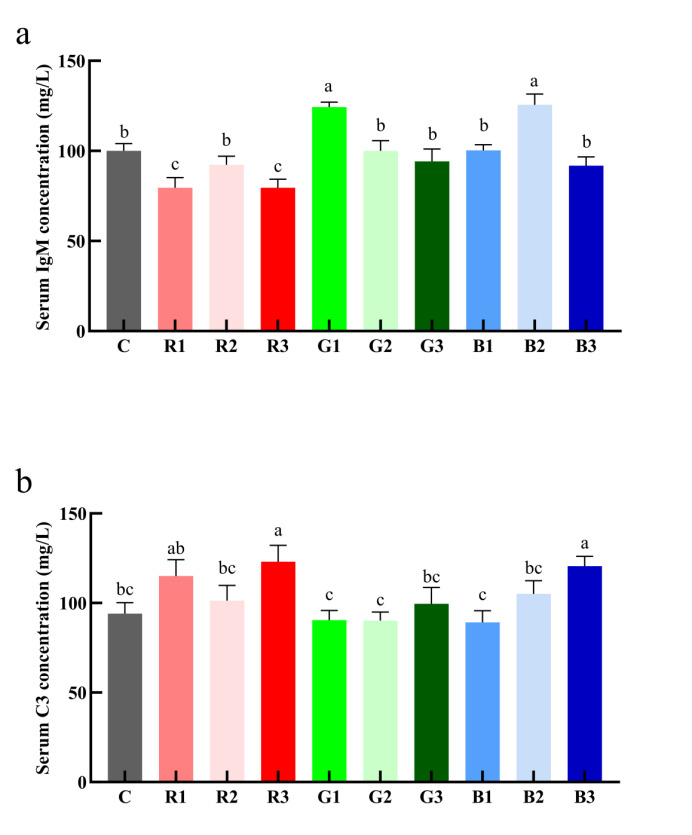
As shown in Fig. 4, plasma IgM and C3 concentrations differed among the light-treatment combinations. The highest IgM concentrations were observed under green light at 1500 lx with a 12L:12D photoperiod and blue light at 200 lx with an 8L:16D photoperiod (G1 and B2, respectively), and these values were significantly higher than those in the natural-light reference and most other combinations (P < 0.05). Lower IgM concentrations were observed under red light at 1500 lx with 8L:16D and red light at 3000 lx with 24L:0D (R1 and R3, respectively). The remaining combinations showed intermediate IgM concentrations, with no significant difference from the natural-light reference (P > 0.05).
_and_c3_(b)_in_the_blood_plasma_of_*h._otakii*_under_different_spect.png)
Plasma C3 showed a different response pattern. The highest C3 concentrations were observed under red light at 3000 lx with a 24L:0D photoperiod and blue light at 3000 lx with a 12L:12D photoperiod (R3 and B3, respectively). However, green light at the same illuminance level did not produce a comparable increase, indicating that the C3 response was associated with the complete treatment combination rather than illuminance alone. Lower C3 concentrations were observed under green light at 1500 lx with 12L:12D, green light at 200 lx with 24L:0D, and blue light at 1500 lx with 24L:0D (G1, G2, and B1, respectively). The natural-light reference and the remaining combinations showed intermediate values.
4. PLASMA SEX STEROID HORMONES
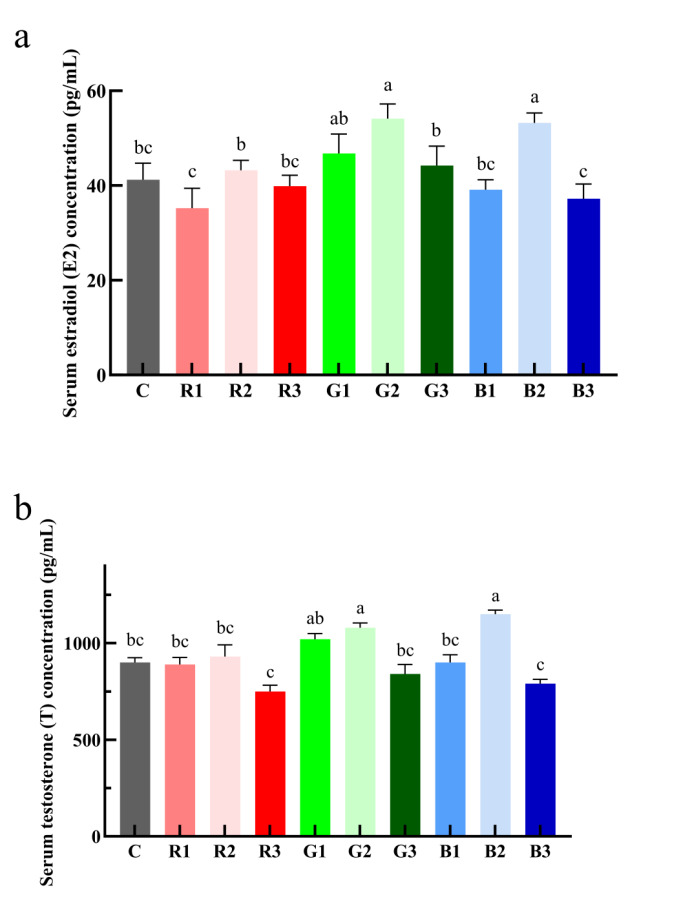
The highest plasma E2 concentrations were observed under green light at 200 lx with a 24L:0D photoperiod and blue light at 200 lx with an 8L:16D photoperiod (G2 and B2, respectively), reaching approximately 54 and 52 pg mL-1 (Fig. 5). These values were significantly higher than those in the natural-light reference and most other treatment combinations (P < 0.05). Green light at 1500 lx with a 12L:12D photoperiod (G1) also produced a relatively high E2 concentration, whereas several red-light and high-illuminance combinations showed lower values.
_and_t_(b)_in_the_blood_plasma_of_*h._otakii*_at_different_spectral__.png)
Plasma T showed a similar overall pattern (Fig. 5). The highest concentrations were observed under green light at 200 lx with a 24L:0D photoperiod and blue light at 200 lx with an 8L:16D photoperiod (G2 and B2, respectively), with both treatments exceeding 1100 pg mL-1 and being significantly higher than the natural-light reference and most other combinations (P < 0.05). Green light at 1500 lx with 12L:12D (G1) also maintained a relatively high T concentration. Lower T concentrations were recorded under red light at 3000 lx with 24L:0D and blue light at 3000 lx with 12L:12D (R3 and B3, respectively), whereas the remaining combinations showed intermediate values.
Discussion
The present study showed that the light environment was associated with gonadal development, sex-steroid secretion, and immune status in H. otakii. Blue light at 200 lx under 8L:16D and green light at 200 lx under 24L:0D produced higher proportions of advanced germ cells and higher plasma E2 and T concentrations than the natural-light reference. These two combinations differed in spectrum and photoperiod, and their estimated photon irradiances were not equivalent; therefore, their favorable performance cannot be attributed to a single factor without qualification. Their shared experimental feature was the 200-lx photometric setpoint. Several treatment combinations involving red light or the highest tested illuminance showed lower sex-steroid concentrations and less advanced gonadal development. Directionally similar spectrum-dependent changes in gonadal development and reproductive hormones have been reported in red spotted grouper.12 Differences in the magnitude of hormone responses among studies may reflect species-specific endocrine capacity, water temperature, reproductive stage, and sampling time.
Spectral effects on fish reproduction are species specific: red light promotes ovarian development in some species, whereas green or blue light is more effective in others.12–16,36–38 In the present study, the orthogonal range analysis suggested a blue-light-associated pattern for ovarian development and a green-light-associated pattern for testicular development under the tested photometric conditions. H. otakii is a demersal fish associated with rocky coastal and reef habitats in the northwestern Pacific.39 In coastal waters, red wavelengths attenuate rapidly, whereas blue-green wavelengths generally penetrate more effectively, although transmission varies with colored dissolved organic matter and suspended particles.40 This habitat may contribute to sensitivity to blue-green wavelengths. However, because photon irradiance was not matched across spectra, the observed spectral patterns cannot be completely separated from radiometric differences. Possible mechanisms include sex-related differences in retinal or deep-brain photoreceptor opsins and differences in neuroendocrine regulation of gonadotropin release,41,42 with additional modulation by sex-steroid feedback at the pituitary level.43 These mechanisms were not measured directly and should be regarded as hypotheses for future study.
Illuminance also contributed to the observed reproductive responses. Red light at 3000 lx under 24L:0D and blue light at 3000 lx under 12L:12D were associated with relatively low T concentrations and less advanced gonadal development. Because equal lux values across different spectra represent markedly different photon irradiances, these observations should be interpreted as responses to the tested lamp settings rather than to radiometrically equivalent light exposures. Excessive illumination could increase metabolic demand or oxidative stress and thereby impair steroidogenesis and gametogenesis19,38,44; however, oxidative markers were not measured, so this explanation remains hypothetical. Within the tested range, the orthogonal analysis identified 200 lx as the most favorable photometric setpoint for both ovarian and testicular development.
Photoperiod effects were conditional on the accompanying spectrum and illuminance. The orthogonal main-effect analysis produced different theoretical photoperiod optima for ovarian and testicular development, namely 24L:0D and 8L:16D, respectively. The two empirically favorable combinations also used different photoperiods: blue light at 200 lx was paired with 8L:16D, whereas green light at 200 lx was paired with 24L:0D. Their common feature was therefore the 200-lx photometric setpoint rather than a specific day length. The favorable response under green light at 200 lx with 24L:0D indicates that continuous illumination was not consistently inhibitory. Conversely, the relatively poor response under red light at 3000 lx with 24L:0D cannot be attributed solely to continuous illumination because spectrum and illuminance differed simultaneously.
Previous studies have likewise shown that prolonged or continuous illumination can alter reproductive development and endocrine activity in teleosts, but the direction and magnitude of the response vary among species, developmental stages, and environmental conditions.45–47 Photoperiodic regulation of fish reproduction is commonly associated with melatonin signaling and synchronization of the hypothalamic-pituitary-gonadal axis.48–50 Melatonin responses may themselves be modified by light intensity and spectral composition.51 However, plasma melatonin, circadian hormone profiles, and gonadotropin expression were not measured in the present study. The involvement of melatonin-mediated HPG-axis regulation, therefore, remains a plausible hypothesis rather than a mechanism demonstrated by the present data. A full-factorial experiment conducted under directly measured and matched photon irradiance is required to distinguish the independent and interactive effects of spectrum, illuminance, and photoperiod.
The immune responses were also associated with specific light combinations. Plasma IgM was highest under green light at 1500 lx with 12L:12D and blue light at 200 lx with 8L:16D, whereas C3 was highest under red light at 3000 lx with 24L:0D and blue light at 3000 lx with 12L:12D. Green light at 3000 lx did not produce a comparable C3 increase, indicating that the response was not a uniform effect of the highest illuminance. Increased IgM may indicate enhanced humoral immune capacity, whereas elevated C3 may reflect activation of innate complement pathways.26,28–30 Elevated C3 should not be interpreted automatically as improved immunity because it may also be associated with altered innate immune activity or light-related stress.19,44 Additional stress, inflammatory, and complement-activation markers are required to clarify the biological significance of these changes.
Taken together, the orthogonal range analysis suggested that illuminance had the largest main-effect range for gonadal development in H. otakii, followed by spectrum and photoperiod. The favorable responses under both the blue-light/200-lx/8L:16D and green-light/200-lx/24L:0D combinations support an association with the 200-lx photometric setpoint under the conditions of this study. Nevertheless, because photon irradiance differed markedly among the nominal spectra and factor interactions were not fully resolved, 200 lx should be regarded as the most favorable tested photometric condition rather than as a universally established optimum. The complete theoretical optimal combinations also require direct experimental validation.
The natural-light group represented a practical baseline for conventional H. otakii culture rather than a strictly controlled orthogonal reference. Its spectrum, intensity, and photoperiod varied simultaneously, limiting mechanistic comparisons with the artificial-light treatments. In addition, the spectral power distributions of the lamps and photon irradiance at the fish swimming depth were not measured directly. Averaging individual measurements within tanks avoided pseudoreplication, but using only three replicate tanks per treatment limited the statistical power for multi-group comparisons. Future studies should include a standardized white-light reference, direct radiometric measurements, complete factorial combinations, and a larger number of replicate tanks.
Conclusion
This study showed that light spectrum, photoperiod, and illuminance were jointly associated with gonadal development, sex-steroid secretion, and immune status in H. otakii. Within the tested range, 200 lx was the most favorable photometric setpoint, whereas estimated photoperiod main effects differed between ovarian and testicular development. The range analysis suggested different spectrum-associated patterns for ovarian and testicular maturation under the tested conditions. Responses to the highest illuminance and continuous illumination depended on the complete factor combination. Because photon irradiance varied across spectra and the theoretically optimal combinations were not directly tested, specific spectrum- and photoperiod-management recommendations require validation through controlled factorial experiments and direct measurements of spectral power distribution and photon irradiance.
Acknowledgments
This work was partially supported by the Liaoning Province Major Science and Technology Special Project (2024JH1/11700010) and Liaoning Province Key Research and Development Project under Grant (2024JH2/102400006).
Authors’ Contribution
Conceptualization: Yong Wang (Equal), Yan Chen (Equal). Methodology: Yong Wang (Lead). Software: Yong Wang (Lead). Formal Analysis: Yong Wang (Equal), Yi-Ke Li (Equal), Yan Chen (Equal). Data curation: Yong Wang (Equal), Yan Chen (Equal). Writing – original draft: Yong Wang (Lead). Visualization: Yong Wang (Equal), Yan Chen (Equal). Validation: Ji-Chuan Du (Equal), Bo-Min Niu (Equal), Ze-Xin Li (Equal). Investigation: Ke-Wei Wang (Equal), Rong-Zhen Sun (Equal), Ya-Ting Liu (Equal), Xue-Jie Li (Equal), Qian Sun (Equal). Resources: Wei Wang (Equal), Yan Chen (Equal). Writing – review & editing: Wei Wang (Equal), Yan Chen (Equal). Supervision: Wei Wang (Equal), Yan Chen (Equal). Project administration: Wei Wang (Equal), Yan Chen (Equal). Funding acquisition: Wei Wang (Lead).
Competing of Interest – COPE
No competing interests were disclosed.
Ethical Conduct Approval – IACUC
All animal experiments were approved by the Ethics Committee of Dalian Ocean University (Approval Code: DLOU2026061101; Approval Date: 7 June 2025). All animal procedures followed the “Guidelines for Ethical Treatment of Experimental Animals” prepared by the Ministry of Science and Technology of China.
Informed Consent Statement
All authors have confirmed this manuscript for publication.
Data Availability Statement
The data supporting the findings of this study are available from the corresponding authors upon reasonable request.