
Introduction
During early developmental stages, fish rely primarily on the innate immune system to resist invasion by endogenous and exogenous pathogens.1 The interferons (IFNs), as secreted cytokines, have the ability to effectively stimulate the innate immune response and play indispensable roles in antiviral defense, regulation of cell growth, and activation of the immune system.2 Upon binding to their respective receptors, IFNs activate the Janus kinase-signal transducer and activator of transcription signaling pathway (JAK/STAT), thereby inducing the expression of a multitude of interferon-stimulated genes (ISGs) that contribute to the elimination of various pathogens, including viruses.3 In previous investigations, a multitude of ISGs have been identified, and their antiviral functions have been explored.3,4 Nevertheless, the focus of researchers has mainly been on identifying individual antiviral ISG effectors and elucidating their mechanisms of action. Several critical aspects have garnered relatively scant attention: the quantity of ISGs necessary to safeguard cells against a specific virus; whether there exist ISGs with varying levels of antiviral “worth”; and whether ISGs function in concert with one another.5 To elucidate these issues, we initially chose a crucial interferon-stimulated gene (ISG56) as a representative to dissect its antiviral function. Subsequently, we analyzed the synergistic effects of eight typical ISGs in the context of antiviral activities.
ISG56 has been identified as an effector molecule possessing antiviral properties. It can effectively induce an antiviral state in infected cells and their surrounding cells.6 Notably, ISG56 has been reported in numerous fish species.7–10 The ISG56 demonstrates a high level of conservation across various evolutionary lineages, ranging from mammals to fish.11 The composition of this molecule is distinguished by the presence of multiple tetratricopeptide repeats (TPRs). These TPRs play a pivotal role in mediating protein-protein interactions. For instance, ISG56 has been shown to have the capacity to bind specific subunits of eukaryotic initiation Factor 3 (eIF3). This binding inhibits the initiation of viral protein translation.12 Nevertheless, the putative TPR motifs display variability among different species.7,13 However, it remained unclear if TPRs demonstrate greater efficacy compared to others, or if there are TPRs that are essential. Generally, in the absence of stimuli, ISG56 is expressed at low levels. It has been identified in various fish species, including yellow croaker10 and tongue sole.8 Interestingly, LPS can be recognized by TLR4 on the surface of cell membranes and is widely used to model bacterial stimuli,14,15 which can induce the expression of members of the IFIT family.16
Grass carp, Ctenopharyngodon idellus, belongs to the family Cyprinidae, order Cypriniformes, and is one of the most important farmed fish in the world due to its rapid growth and high commercial value.17 Nevertheless, in recent years, plenty of disease outbreaks have occurred in this cultured fish, causing massive economic losses. The present study identified and characterized the ISG56 gene from grass carp, as well as investigated its mRNA expression patterns in response to Poly (I:C) and LPS stimulation. Additionally, a synergistic effect of multiple typical ISGs was conducted. These findings provide crucial insights for further elucidating the antiviral mechanism of ISGs in fish species.
Materials and methods
Experimental fish and samples collection
Healthy grass carp with an average weight of approximately 50 ± 5 g were purchased from the experimental farm of Guizhou University, Guizhou, China, and were transported to an indoor culture system (300 L aquaria) for 2 weeks acclimation. The water temperature was maintained at approximately 25 ± 1 ℃ under natural light and dark conditions. The fish were fed a commercial diet (Haid group Co., Ltd, Guangdong, China. Fully formulated compound pellet feed featuring a protein content of ≥30%) at approximately 2% of body weight twice daily at 9:00 and 16:30. After acclimation, the three fish were anesthetized with tricaine methanesulfonate (MS-222, 100 mg/L) for sampling. Gill, liver, spleen, intestine, kidney, muscle, brain, heart, and thymus tissues from three healthy individuals were collected on ice and immediately frozen in liquid nitrogen for ORF clone and tissue-specific expression analysis.
Fish were randomly divided into three groups, namely, the Poly(I:C) group, the LPS group, and the Control group. Each group included three replicates (90 fish in total, 30 fish for each replicate). For the poly (I:C) group, 1 ml of Poly (I:C) solution (Sigma, USA) (0.5 mg/ml) was injected intraperitoneally into the abdomen of the experimental fish. In the LPS group, 1ml LPS solution (0.2 mg/ml) was injected intraperitoneally into the abdominen of the test fish. The Control group was injected with 1ml PBS into the abdomen of the test fish. After injection, three fish of each treatment were anesthetized with MS-222 as mentioned above, and then three selected tissues (liver, spleen, and kidney) were collected from each group at 0 h, 12 h, 24 h, 48 h, 96 h, 120 h and 168 h after post-injection. Throughout the course of the experiment, no abnormal mortalities were detected among the experimental fish. All procedures were carried out on an ice block using sterile scissors. Samples were also immediately stored in liquid nitrogen until further analysis. Fish were not fed during the treatment period. The experimental protocol on fish was conducted according to the guidelines approved by the Animal Ethics Committee of Guizhou University.
Gene cloning and sequence analysis
Based on the transcriptome sequence of grass carp (Accession number PRJNA759556), specific primers (Table 1) were designed for the amplification of full-length open reading frame (ORF) cDNA sequences corresponding to the CiISG56 gene. Total RNA was extracted using the Trizol reagent (Invitrogen, USA) according to the manufacturer’s instructions. The integrity and amount of the RNA were checked using an agarose gel (1%) and a spectrophotometer (Nanodrop 2000, Thermo Scientific, USA). First-strand cDNA was synthesized using MonScript RTIII Super Mix with dsDNase (Two-step method) (Monad, Suzhou, China), and the products were used as the templates for PCR. The PCR was performed as follows: an initial denaturation step at 94 ℃ for 2 min, followed by 35 cycles of a denaturing step at 94 ℃ for 30 s, an annealing step at 57 ℃ for 30 s, an extension step at 72 ℃ for 60 s, and a final extension step at 72 ℃ for 5 min. PCR products were purified using an AxyPrep™ gel extraction kit (Axygen, USA) and cloned into the pMD 19-T vector (Takara, China). Finally, positive cloned vectors were sent to Tsingke (Beijing, China) for sequencing.
The sequence of CiISG56 was analyzed using the BLAST program (http://www.ncbi.nlm. nih.gov/blast), and the conserved domains were predicted using the SMART program (http://smart.embl-heidelberg.de/). The ORF of CiISG56 was obtained using open reading frame finder (https://www.ncbi.nlm.nih.gov/orffinder/). Molecular weight and theoretical isoelectric point (pI) were calculated using the ExPASy compute pI/Mw tool (https://web.expasy.org/compute_pi/). The transmembrane region was predicted using the online TMHMM tool (https://services.healthtech.dtu.dk/service.php?TMHMM-2.0). Additionally, a neighbor-joining (NJ) phylogenetic tree was constructed using MEGA 4.1 software. The inferred phylogeny was validated through bootstrap sampling with 5000 replications. This was based on a local database of protein sequences that were downloaded from NCBI databases (Table 2). A putative TPR motif was identified using TPRpred (http://toolkit.tuebingen.mpg.de/tprpred/). Finally, Sigmaplot 11 software and Clustal 3.0 software were employed separately for analyzing gene expression in rabbits and generating heat maps.
Tissue expression properties of ISG56 and its response to immune stimuli
Total RNA extraction and initial cDNA synthesis were conducted following the aforementioned procedures. Quantitative real-time PCR was used to evaluate the mRNA transcription pattern of CiISG56 in different tissues (gill, liver, spleen, intestine, kidney, muscle, brain, heart and thymus) and the response of ISG56 in immune tissues after challenge by Poly(I:C) and LPS. The qPCR was conducted using the MonAmp™ ChemoHS qPCR Mix (Monad, China) in 96-well plates in a LineGene 9600 Plus (Bioer, China), and the final volume of each PCR was 20 μL. The amplification conditions were as follows: initial denaturation at 95℃ for 2 min, followed by 40 amplification cycles at 95℃ for 5 s and 60℃ for 15 s. A non-template control and melting curve were performed to verify that the target PCR product was amplified. The relative expression level of ISG56 was calculated using the comparative Ct method (2-ΔΔCt). The grass carp β-actin gene was used as an internal reference gene. All reactions were carried out in duplicate.
Statistical analysis
Data are shown as the mean ± standard deviation of three replicates in each experimental group. All data were compared using a one-way analysis of variance, followed by Duncan’s multiple-range test to determine significant differences between means. P < 0.05 was used to indicate a significant difference.
Results
Cloning and sequence analysis of CiISG56 cDNA
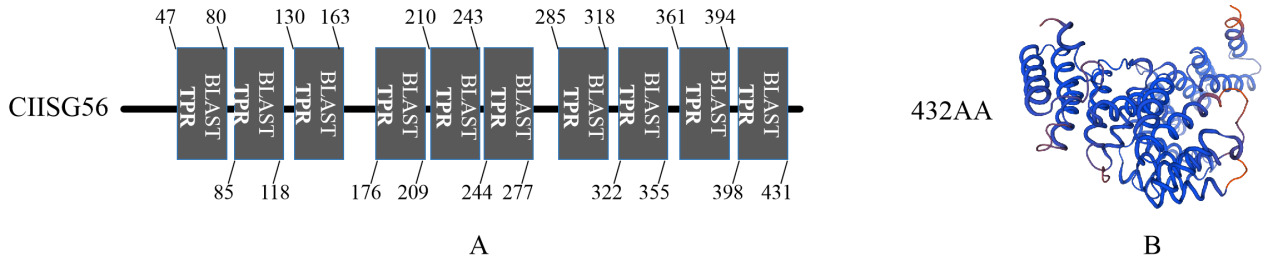
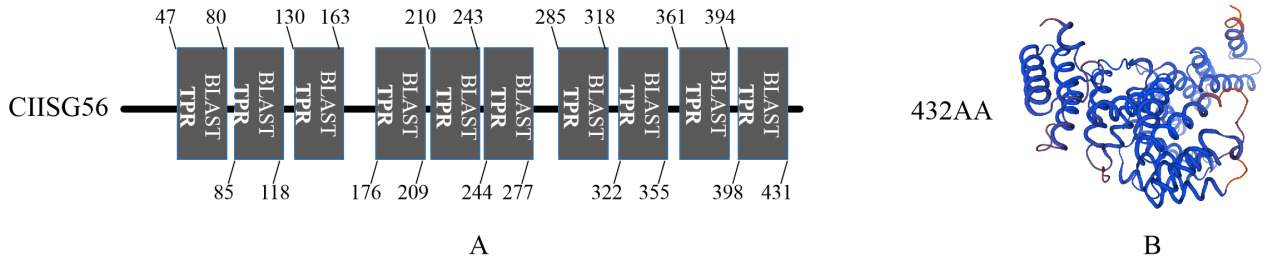
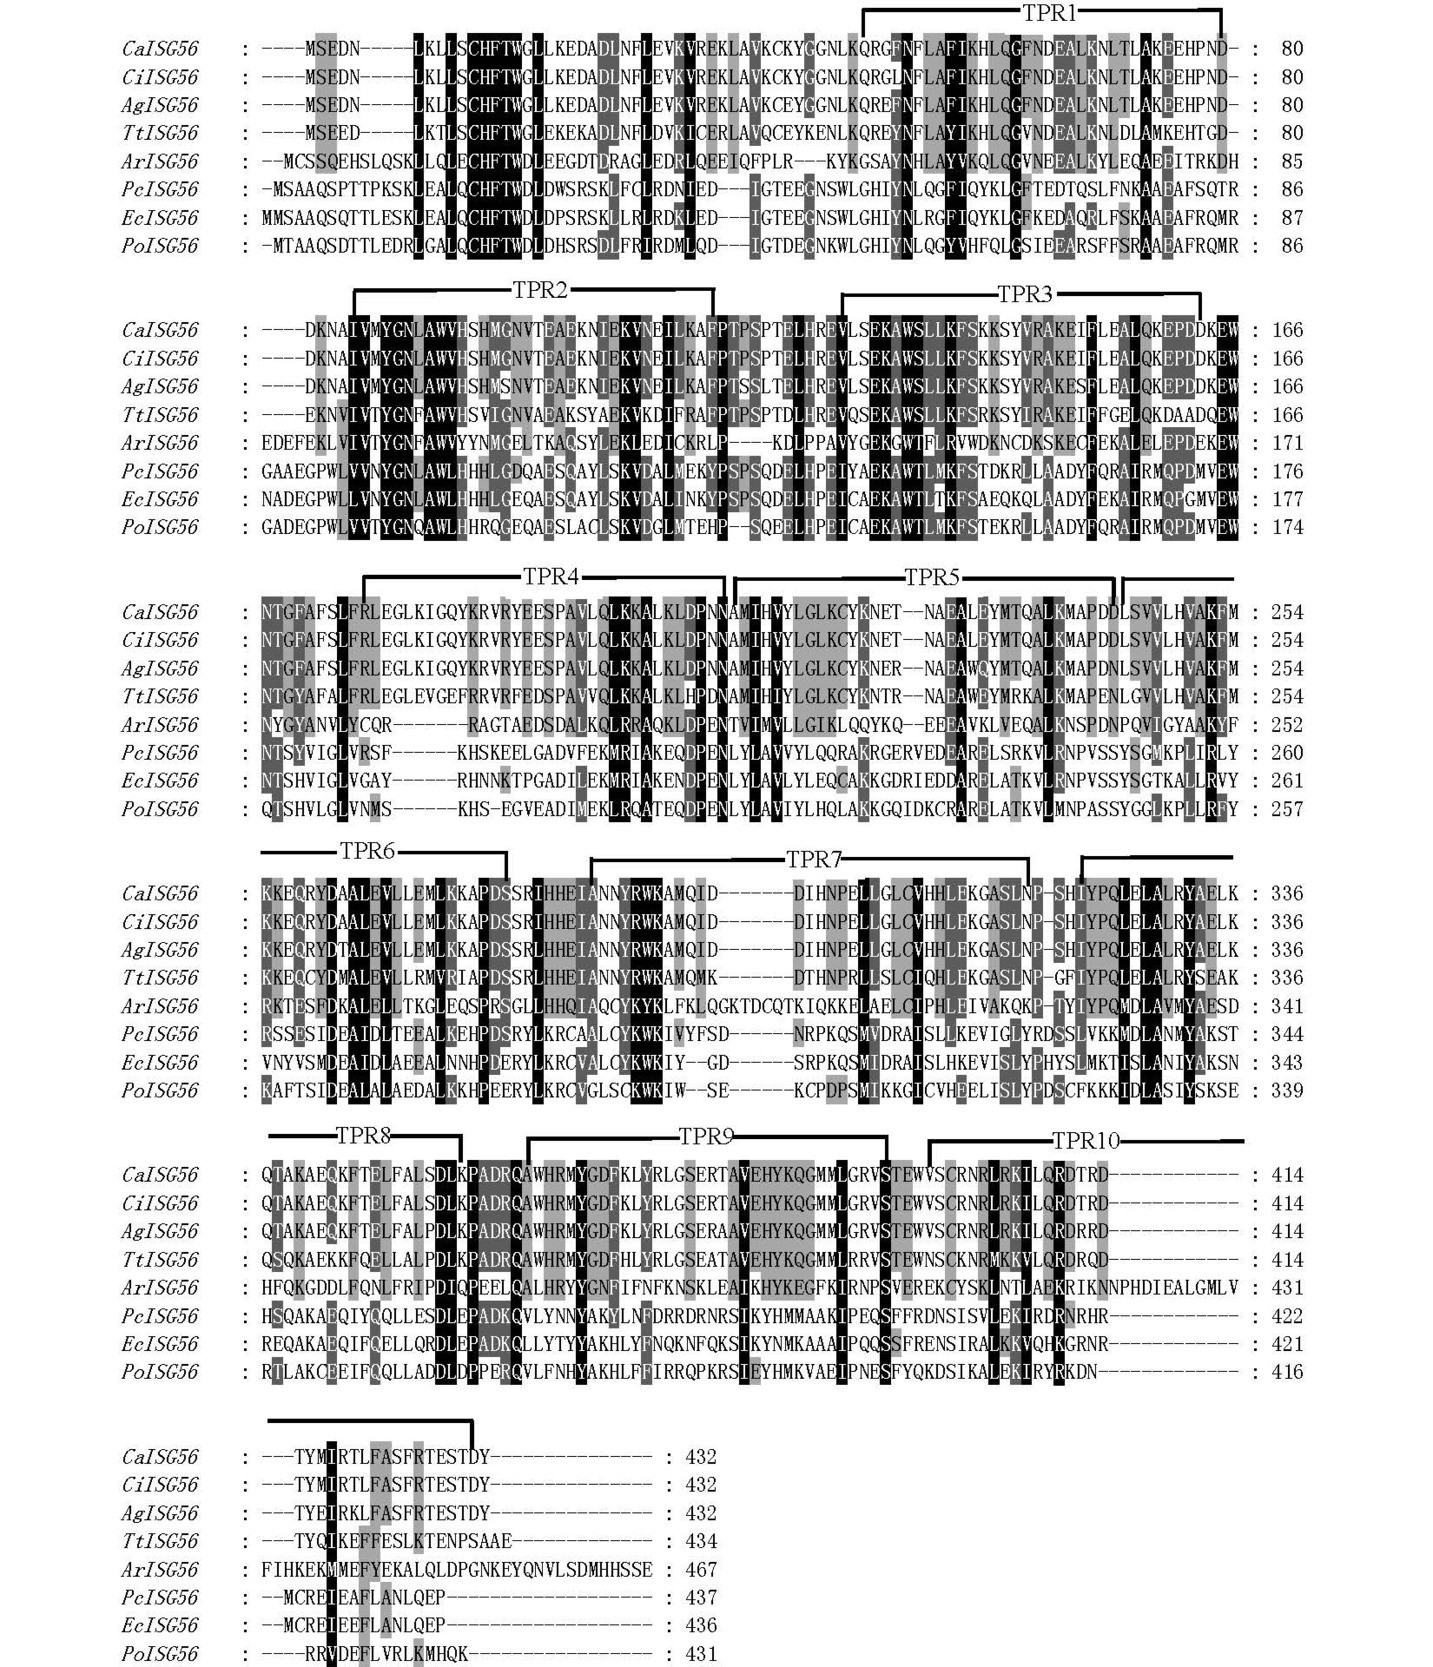
The sequence of CiISG56 was deposited in GenBank with the accession number MW884261. The cDNA of the CiISG56 ORF has a length of 1299 bp, ranging from the ATG start codon to the TAG stop codon. The inferred amino acid sequence of CiISG56 encompasses 432 amino acid residues with a putative molecular weight of 50.2 kDa. The presence of both the signal peptide and the transmembrane domain was not detected in the protein sequence of CiISG56 using SignalIP 5.0 server and TMHMM prediction software. In silico analysis identified ten TPR motifs formed by residues 47 to 80, 85 to 118, 130 to 163, 176 to 209, 210 to 243, 244 to 277, 285 to 318, 322 to 355, 361 to 394, and 398 to 431 (Fig. 1A). Furthermore, a 3D model prediction of CiISG56 (with the highest GMQE of 0.9) by SWISS-MODEL is presented, illustrating the helix-turn-helix folds formed by TPRs. The 3D structural prediction reveals that ISG56 bears the closest structural resemblance to Sinocyclocheilus anshuiensis ISG56 (Seq Identity 83.29%) (Fig. 1B).
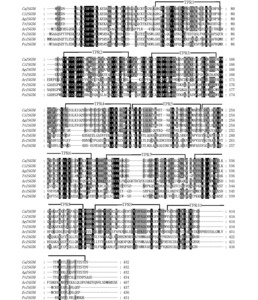
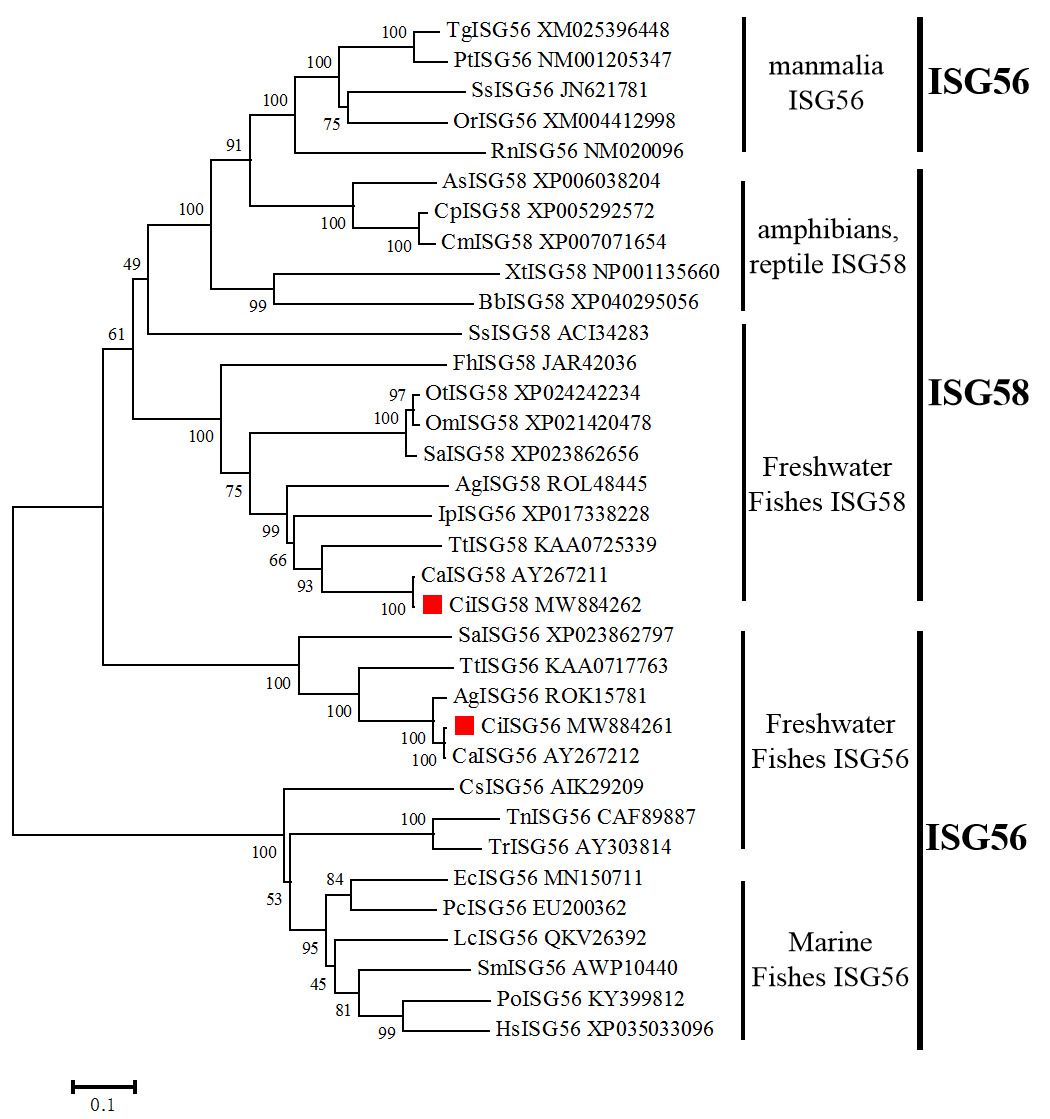
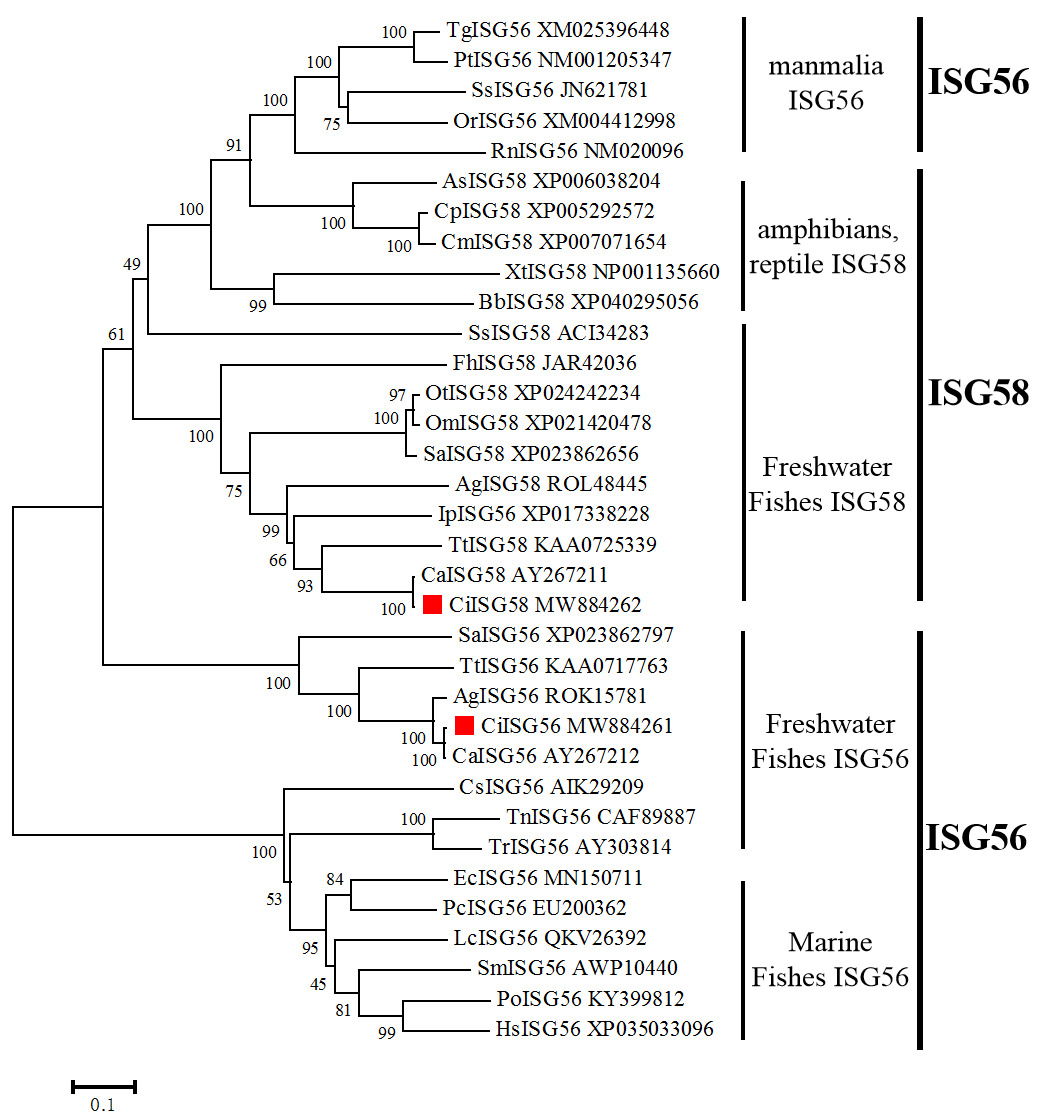
A comparison of CiISG56 with other fish indicated that CiISG56 shares 99.77%, 65.88%, 38.21%, 38.56% and 37.55% amino acid sequence identities with ISG56 of C. auratus (CaISG56, AY267212), A. grahami (AgISG56, ROK15781), P. crocea (PcISG56, EU200362), E. coioides (EcISG56, MN150711) and P. olivaceus (PoISG56, KY399812), respectively (Fig. 2). The results indicate that CiISG56 is less conservative. A phylogenetic tree was constructed to elucidate the evolutionary history of vertebrate CiISG56, based on the amino acid sequences of five mammalian ISG56, three reptilian ISG58, two amphibian ISG58, ten freshwater fish ISG58, eight freshwater fish ISG56, and six marine fish ISG56 (Table 2). The findings are depicted in four detailed figures (Fig. 3), as follows: (1) Evolutionary separation of ISG56 and ISG58 in fish indicates a relatively distant evolutionary relationship. (2) CiISG56 and CiISG58 exhibit the closest relationship to crucian carp ISG56 and ISG58, followed by kanglang fish and Triplophysa tibetana. (3) Mammalian ISG56 shows convergence with amphibian and reptilian ISG58, suggesting partial functional overlap between ISG56 and ISG58. (4) Freshwater fish ISG56 and marine fish ISG56 can be distinctly classified into two clades.
Tissue distribution and expression pattern of the ISG56 in response to Poly I:C challenge
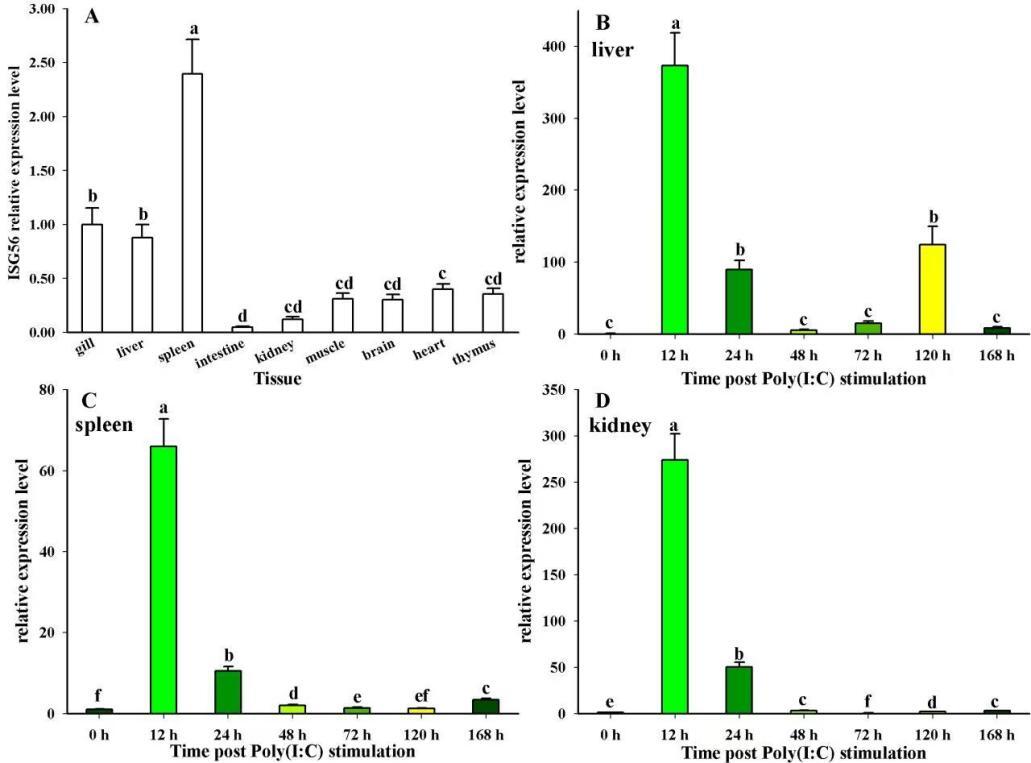
To investigate the tissue expression profile of the CiISG56 gene, qPCR was used to analyze its transcriptional levels in various tissues under normal physiological conditions. As depicted in Fig. 4A, CiISG56 mRNA was constitutively expressed in diverse tissues under examination, including gill, liver, spleen, intestine, kidney, brain, and thymus. Notably, higher mRNA levels were detected in the gill, liver, and spleen, while lower levels were found in the remaining tissues. This indicates that the CiISG56 gene was widely expressed in all the inspected tissues, although higher expression was observed in immune tissues.
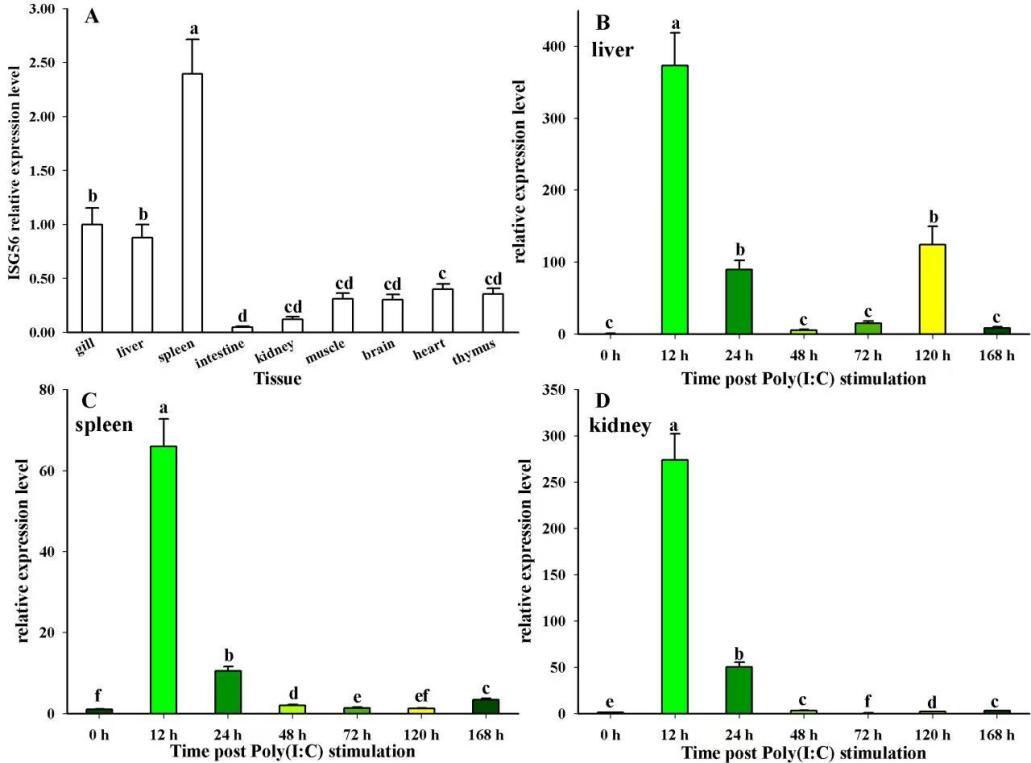
When the fish were stimulated with poly (I:C), CiISG56 gene expression was significantly up-regulated in the liver, spleen and kidney (Fig. 4B, 4C and 4D). Interestingly, in all three tissues, CiISG56 demonstrated better agreement at 12 h, reaching a peak and a sharp drop at 24 h (P < 0.05) and then remained at low levels, with the exception of CiISG56 in the liver, which had significantly elevated expression at 120 h. The mRNA expression strength of CiISG56 showed significant tissue differences. The intensity in increasing order was liver, kidney and spleen (372.6-, 274.1-, and 66.0-fold, respectively) at 12 h post-infection.
Inducible expression of CiISG56 by LPS
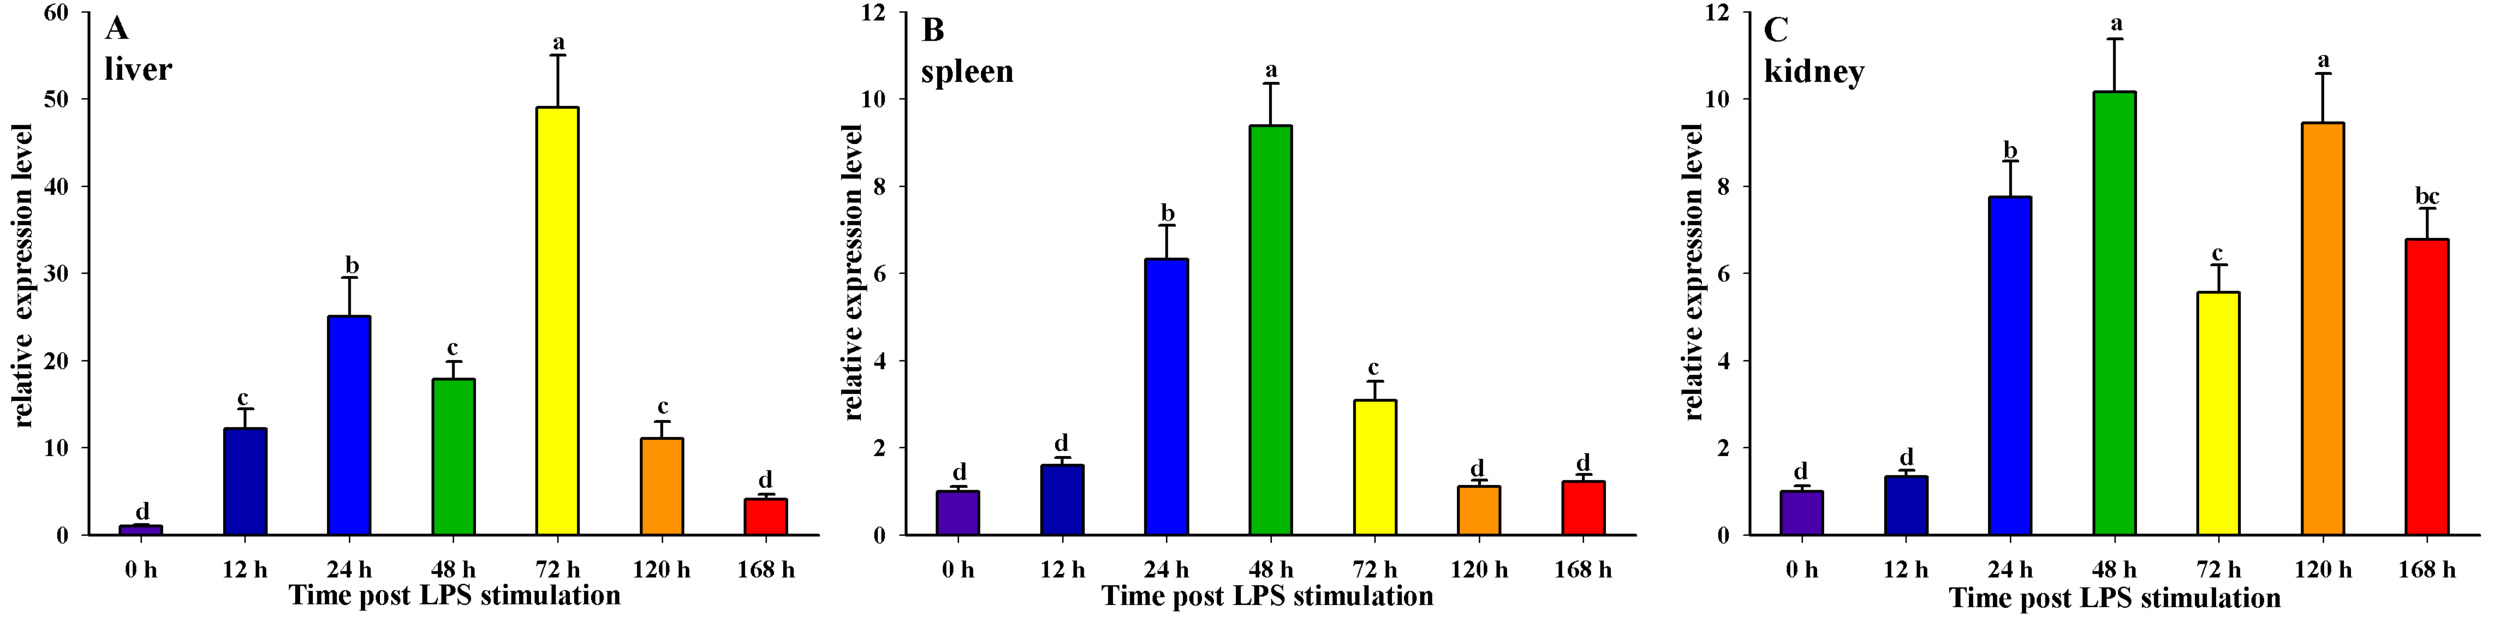
To assess the sensitivity of CiISG56 to bacterial infection, we conducted an analysis of its expression in three immune tissues (liver, spleen, and kidney) following stimulation with LPS. The results demonstrated a significant up-regulation in the transcription of CiISG56 in the three immune tissues following LPS injection, with increased expression levels of CiISG56 observed at 12-120 h, 24-120 h, and 24-168 h, respectively. The intensity of CiISG56 expression in the liver peaked at 49.0-fold at 72 h, while CiISG56 expression in the spleen ranged from 9.4- to 10.1-fold at 24-48 h and 9.5-fold at 120 h in the kidney (Fig. 5). In addition, two peaks of expression were detected in the kidney, with ISG56 exhibiting peaks at 48h and 120h, and ISG58 showing peaks at 48h and 168h respectively. The result suggests that CiISG56 may not only be sensitive to Poly (I:C) but may also occur following treatment by LPS.
__spleen_(b)__and_kidney_(c)_pos.png)
Synergistic subtraction effects of eight typical ISGs
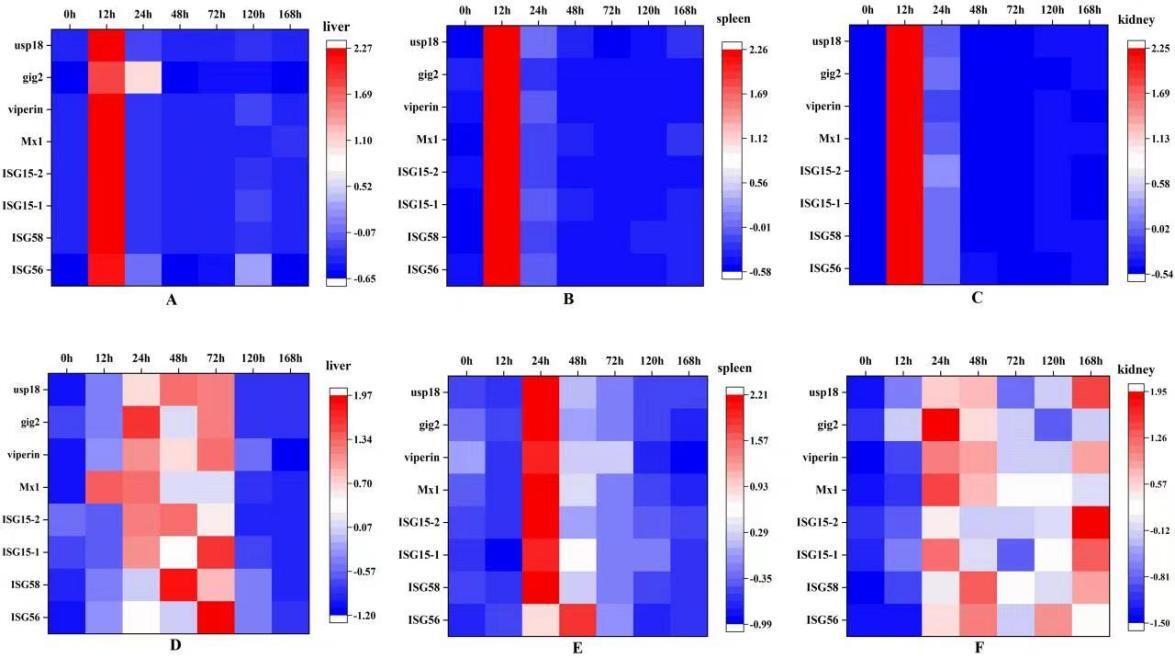
Eight typical ISGs (ISG56, ISG58, gig2 (interferon-induced GTP-binding protein 2), Mx1, ISG15-1, ISG15-2, viperin, and usp18) were specifically selected for analysis of the synergistic subtraction effect of poly(I:C) and LPS stimulation. The results are succinctly depicted below in six heatmaps illustrating the relative mRNA expression levels (Fig. 6, Table S1). The co-expression of eight ISGs exhibited a pronounced synergistic effect across all three tissues following poly (I:C) injection, with the simultaneous peak expression of these eight ISGs occurring at 12 hours and subsequently declining rapidly after 48 hours. The IFN response exhibited the highest level of activity in the liver, followed by the kidney and spleen. Among the eight ISGs, ISG58 demonstrated a significantly high level of gene expression, while Mx1 and viperin showed moderate expression, with the remaining genes being classified as low expressed (ISG56, ISG15-1, ISG15-2, gig2 and usp18). The ISG58 gene exhibited the highest level of expression at 12 h, with a 1,942-fold increase, in the liver. Meanwhile, the genes demonstrating the most intense expression at 12 h were ISG15-2, showing a 1,610-fold increase in the kidney and a 165-fold increase in the spleen. In addition to the significant down-regulation of the gig2 gene at 48-168 h post-infection, with expression levels below 1, seven genes exhibited sustained up-regulation. The aforementioned evidence demonstrates that the eight typical ISGs exhibited a robust response to poly(I:C) stimulation; However, the duration of the antiviral effect was relatively brief, primarily observed within 0-24 hours (Fig. 6A, 6B, and 6C).
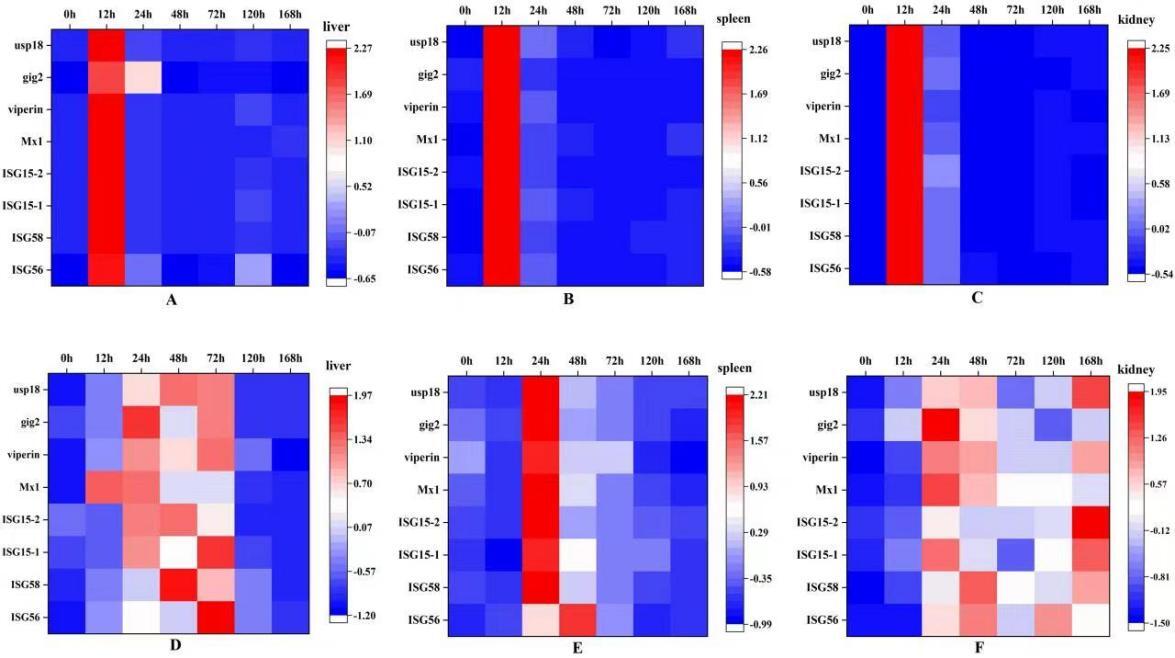
During LPS injection, the eight ISGs exhibited unique expression characteristics. In the liver, ISG56, ISG15-1, gig2 and viperin peaked simultaneously at 24 h and 72 h, respectively, whereas the other four ISGs show only a single expression peak. The antibacterial effects of ISG56, ISG58, viperin and usp18 were consistently observed throughout the entire duration (0-168 h), as were those of ISG15-1, ISG15-2, Mx1 and gig2 up to 120 h. Among the eight ISGs, ISG56 exhibited the highest expression levels, followed by Mx1 and ISG58. Conversely, ISG15-2 was identified as having the lowest expression levels and was predominantly located in the liver. In the spleen, the expression pattern of the seven ISGs showed good agreement, being suppressed at 12 h and then rapidly up-regulated, peaking at 24 h for all except ISG56. The expression of the seven ISGs showed continuous down-regulation from 24-168 h, with the exception of ISG56 which exhibited an initial up-regulation from 0-48 h followed by a subsequent peak. However, later on, ISG56 also displayed down-regulation similar to the other seven ISGs. The same was true in the liver, where ISG58 was the most highly expressed, and in the spleen, where the viperin expression was the lowest. In the kidney, eight ISGs showed significant up-regulation from 0-48 hours, with ISG15-1, Mx1, gig2 and viperin reaching their peak expression at 24 hours, while ISG56 and ISG58 peaked at 48 hours. Furthermore, ISG56, ISG15-1 and viperin demonstrated bimodal expression patterns with peaks observed in both the early (24 hours) and late stages (168 hours) (Table S2). As mentioned above, the expression of eight typical ISGs was upregulated following LPS treatment in the three mainly immune tissues of grass carp. However, there were variations in both the timing and magnitude of these responses among the three tissues. The onset time was dominated by 24-72 h in the liver (Fig. 6D), whereas the ISGs were continuously expressed from start to finish in the kidney (Fig. 6F). In addition, the expression of usp18 and 6 ISGs (ISG58, ISG15-1, ISG15-2, Mx1, gig2, and viperin) peaked at the same time (24 h) (Fig. 6E).
Discussion
Characterization of ISG56 in grass carp
Multiple studies have demonstrated the antiviral effect of ISG56 in teleosts, including crucian carp,13 yellow croaker,10 and olive flounder.7 In the present study, we have successfully obtained the complete ORF sequence of the ISG56 gene in grass carp. The CiISG56 gene encodes a 432-amino acid protein with a predicted molecular weight of 50.2 kDa, which is consistent with that found in other fish species such as olive flounder7 and yellow croaker.10 Meanwhile, the putative CiISG56 protein contains a typical feature, i.e. TPR motifs,11,18 which were highly homologous to those of other bone fishes. The TPR motif composed of 34 amino acid motif folds into a helix-turn-helix, and its function is known to mediate protein-protein interactions and recognize nucleic acids, peptides, and proteins.19 Interestingly, the number of TPRs domains was variable among the fish species, and the amount of TPRs in freshwater fish is more than that of marine fish. For instance, the representative freshwater fish species such as grass carp, kanglang fish and Triplophysa tibetana all contain the 10 TPR motif. Meanwhile, in marine fish, the number of TPR motifs in olive flounder, orange-spotted grouper, yellow croaker, and barramundi is 6, 6, 4, and 4, respectively. It has been reported that freshwater fish species are more exposed to a wide variety of pathogenic microorganisms, compared with marine fish species.20 The freshwater fish contain more TPR domains, which may aim to better respond to pathogen invasion.7
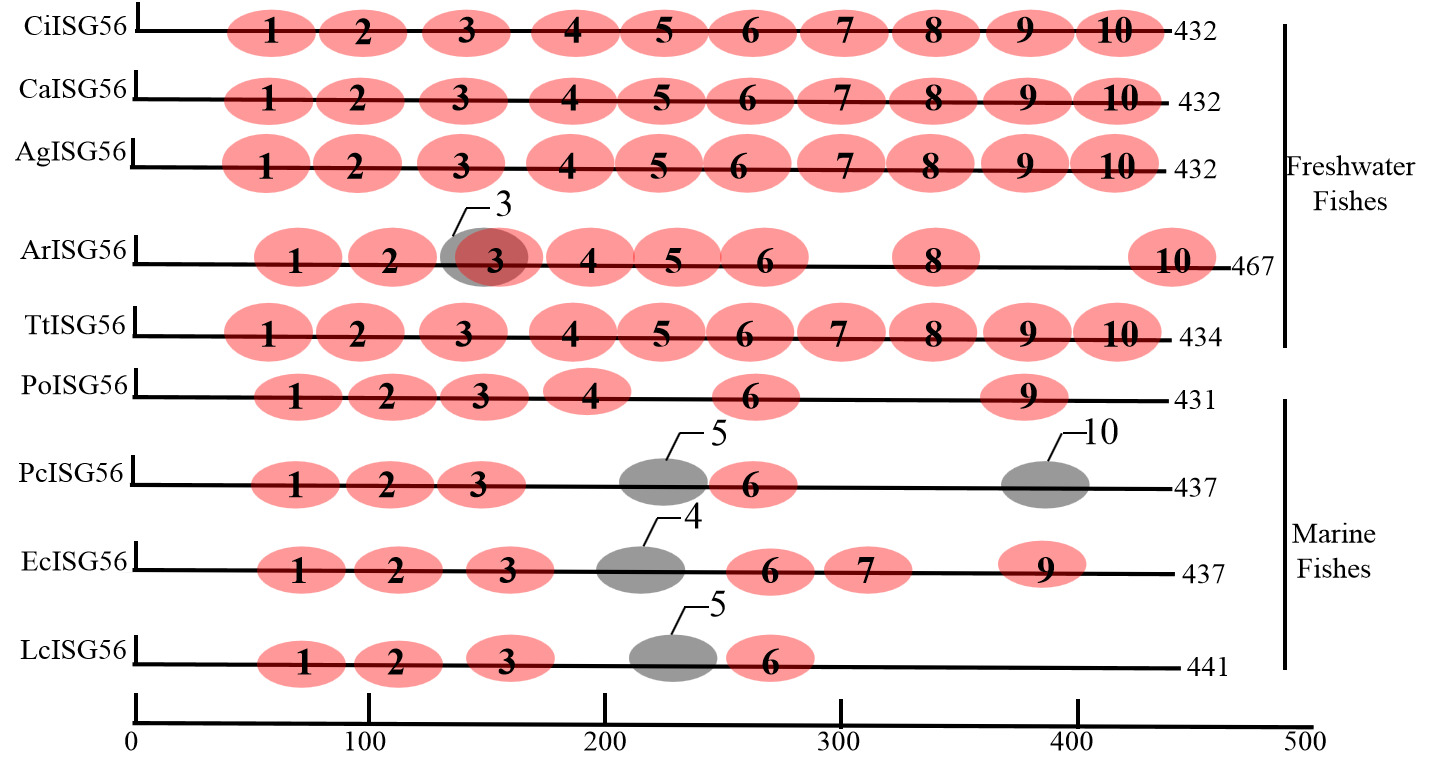
Furthermore, the positions of the TPR motifs were meticulously analyzed across nine representative fish species, encompassing five freshwater fish species and four marine fish species. The results indicated that TPR1, 2, 3, and 6 were detected in both freshwater and marine fish. This finding suggests that these four TPR domains could be the core sequence responsible for the antiviral function in fish. The research findings indicate that there are still certain disparities in the antiviral effect of the same ISG among different species. Nevertheless, additional in-depth investigations are necessary to verify this hypothesis. Whereas TPR5, 8, and 10 are only absent in marine fish species, suggesting that they are optional in marine fish.10 To verify this prediction, the incomplete TPR domains (SELs) were predicted by TPRpred software. We also found that two predicted SELs in PcISG56 are located at residues 213-248 and 336-401 of the amino acid sequence, corresponding to TPR5 and 10 in grass carp, respectively. A similar phenomenon was observed in other teleosts, for example, an SEL (196-231 AA) in orange-spotted grouper corresponded to TPR4, and an SEL (214-249 AA) in Lates Calcarifer corresponded to TPR5 was predicted, according to our hypothesis21 (Fig. 7).
_motifs_on_the_isg56_proteins_from_nine_fish.png)
Phylogenetic analysis of CiISG56 and CiISG58
To elucidate the evolutionary relationship of vertebrate ISG56, a phylogenetic tree was generated using protein sequences retrieved from local databases (Table 2). Previous studies have reported that fish ISG56 and ISG58 exhibit a relatively distant genetic relationship and that fish ISG56 is distant from mammalian ISG56.6,7 In the current study, mammalian ISG56 is clustered with amphibians and reptiles ISG58, suggesting a partial functional overlap between ISG56 and ISG58. However, in the study of CaISG56 and CaISG58, the ITIF family forms a distinct clade to the exclusion of mammalian IFIT proteins,13 which was different from our results. This may be due to the small number of ITIFs selected, such as crucian carp ISG56 and ISG58, rainbow trout ISG58, and puffer fish (Takifugu rubripes) ISG56. Of the 19 ISG56 and 15 ISG58, CiISG56 shows the closest relationship to CaISG56, followed by AgISG56 and TtISG56, as well as CiISG58.
ISG56 of grass carp response to two immune stimuli
It has been reported that ISG56 participates in the antiviral effects of IFNs against numerous viruses in mammals.6 In the current study, the expression of CiISG56 mRNA was constitutively expressed in all tissues collected, which is similar to the results in yellow croaker10 and orange spotted grouper.7 Differently, Zhang and Gui13 found that the transcript level of crucian carp ISG56 was not detected in crucian carp blastulae embryonic cells,13 which may be due to species and/or tissue-specific. The higher basal expression of CiISG56 in immune-related tissues (gill, liver, and spleen) (Fig. 4A) may be related to their roles as primary barriers against pathogens. The gill, as a major site of pathogen entry, showed high expression, suggesting its importance in the first line of defense. Interestingly, lower mRNA levels of CiISG56 were observed in the muscle, as well as in the tongue sole,8 yellow croaker10 and olive flounder,7 suggesting that ISG56 may not be involved in the protection of muscles against viral infection, which requires further investigation.
In a previous study, GCRV infection was shown to induce the expression of ISG56 in grass carp.4 In this study, we identified different expression patterns and showed that CiISG56 expression was obviously up-regulated after treatment with poly (I:C) and LPS, which is different from the study results of Hwang.7 In Hwang’s study, ISG56 of olive flounder could not be induced by LPS stimulation. After stimulation with poly (I:C), CiISG56 gene expression was obviously up-regulated in the liver, spleen, and kidney, and peaked at 12 h. Notably, the induction time of poly(I:C) is more rapid compared to that of other immune stimuli. Upon infection of the fish with GCRV, the expression of the CiISG56 gene reached its peak in the liver, spleen, and kidney at 48 h, 96 h, and 12 h, respectively. This peak expression pattern is relatively slow when compared to the response under poly(I:C) stimulation.4 Likewise, in CAB cells, Poly(I:C) (48 h) triggered the expression of viperin more promptly compared to GCRV (72 h).22 This is consistent with those of Chen et al.23 who reported that the expression of usp18 was more rapid by Poly (I:C) than by GCRV infection.23 Furthermore, the expression intensity, which was induced by Poly(I:C) was also higher than that induced by GCRV.4 Bacterial LPS is an important inducer of gene expression in members of the IFIT family.16 LPS-induced IFIT2 expression is dependent on the endogenous secretion of type I IFNs.24 After LPS infection, zebrafish type I IFN (IFN1) and type II IFN (IFN2 and IFN3) showed strong antiviral activity but only type I IFN was able to protect the fish against bacterial infection.25 Transfection of IRF9 up-regulated the expression of ISG15 in epithelioma papulosum cyprini cells (EPCs) upon LPS stimulation.26 In our study, the expression of ISG56 was significantly increased in the liver, spleen, and kidney after LPS stimulation. Similarly, the viruses induced stronger expression of ISG56 than bacteria in olive flounder.7 However, the expression intensity of ISG56 was significantly weaker in response to LPS than to Poly(I:C) induction. In addition, fibroblasts treated with poly(I:C) have much higher anti-HIV activity than those treated with LPS stimulation.27
Synergistic effects of eight ISGs on the establishment of antiviral status
“How many ISGs are necessary to inhibit a specific virus? Do ISGs function in a coordinated manner? This is an issue that merits significant attention”. In recent years, a growing number of interferon-stimulated genes (ISGs) have been identified.28 Nevertheless, researchers have primarily focused on identifying individual antiviral ISG effectors and elucidating their mechanisms of action. To preserve the organism’s homeostasis, it is advantageous for the host to trigger the production of several relatively less potent effector molecules. This approach potentially fosters a mild intracellular milieu, as opposed to up-regulating a group of highly potent interferon-stimulated genes (ISGs).29 Generally, the additive effect of two interferon-stimulated genes (ISGs) on antiviral efficacy is more potent than that of a single ISG, regardless of cell type and virus type. Conversely, the simultaneous knockout of ISG20 and ZAP proves to be more effective than the single knockout of either ZAP or ISG20 in facilitating the replication of sindbis virus.30
To validate this hypothesis, eight ISGs were selected for investigating their responses to two immune stimuli. The expression levels of eight ISGs all reached their peaks at 12 hours post poly (I:C) injection and subsequently declined rapidly, demonstrating a high degree of consistency and synergy. In the identical case, following LPS treatment, the expression levels of eight typical ISGs were upregulated in the three major immune tissues of grass carp. This phenomenon was likewise noted during GCRV infection.4 Similarly, a collectively formidable antiviral defense was identified at 24 hours post-IAV infection in humans. This defense is based on a set of genes including IFIT2, IFIT1, ISG15, MX1, and so on.31 Furthermore, upon the hosts’ infection with African swine fever virus (ASFV), a series of ISGs, such as IFIT1, IFITM1, MX1, OASL, ISG15, etc., were significantly enriched within the immune system.32 Rezapour et al.33 demonstrated a consistent activation of ISGs (such as IFIT1, IFIT2, IFIT3, and OAS1) across all viruses by utilizing the MAS and RMAS algorithms. This finding proved that the ISGs function in a coordinated manner.33 Above evidence presented herein indicates that in response to the stimulation of immune stimulants, the eight typical ISGs exhibit a coordinated pattern. On the other hand, the expression intensity in the poly(I:C) treatment was significantly higher than that observed in GCRV infection4 and LPS stimulation (in the present study). This phenomenon may be caused by plenty of synthetic dsRNAs from Poly(I:C) compared with GCRV.34 Indeed, the innate immune responses to Poly(I:C) and viruses differ. IFN-α is produced by virus-produced dsRNA stimulation in human plasmacytoid dendritic cells but not by poly (I:C).35
When comparing the expression levels of interferon-stimulated genes (ISGs) in the three immune tissues, ISG56 was among the highly expressed genes upon lipopolysaccharide (LPS) stimulation. Conversely, it exhibited the lowest expression level under Poly (I:C) stimulation. Our data proposes a refined model of the antiviral interferon response. In this model, a small subset of “dominant” interferon-stimulated genes (ISGs) may account for the majority of the inhibition of a given immune stimulus.5 However, these ISGs display varying response intensities and strategies when confronted with different immune stimuli. Likewise, the expression of the same interferon-stimulated gene (ISG) exhibits notable disparities across different tissues. For instance, upon stimulation with LPS, the expression level of Mx1 is relatively low in the kidneys and spleen, yet it is highly expressed in the liver. Similarly, when stimulated with Poly (I:C), Mx1 demonstrates a comparable expression pattern. Upon comprehensive analysis, a high-intensity expression of ISGs was detected in the liver. Analogous phenomena have also been observed in mice injected with IFN-β via the caudal intravenous (IV) route,36 and in juvenile zebrafish following injection with IFN-α1.37 Pathogens are known to accumulate in the liver preferentially, and the antiviral response induced by interferon contributes to the control of large-scale infections, suggesting that maintaining a mildly antiviral state in the liver may be beneficial to the host.4
Conclusion
In summary, we obtained the ORF sequence of CiISG56 with 10 TPR motifs. The number of TPRs in freshwater fish is greater than that in marine fish. Based on the position of the TPR motifs in grass carp, TPR1, 2, 3, and 6 are the core sequences for antiviral function in fish. The expression of CiISG56 was found to be constitutive in various tissues examined, with higher levels in immune tissues. Upon stimulation with poly (I:C) or LPS, a high degree of consistency and synergy of expression of eight ISGs was observed with poly (I:C) or LPS stimulation. The results indicated that in response to the stimulation by immune stimulants, the eight typical interferon-stimulated genes (ISGs) displayed a coordinated pattern. ISG56 was among the genes that exhibited high expression levels upon LPS stimulation. Additionally, ISG56 showed the lowest expression level under Poly (I:C) stimulation. These data suggest a refined model in which a small subset of “dominant” interferon-stimulated genes (ISGs) may account for the majority of the inhibitory effects on a given immune response triggered by immune-stimulating substances. These findings may contribute to the development of novel immunostimulants for disease control in aquaculture.
Acknowledgments
This study was supported by the Project of the Basic Research Plan (Natural Science) of Guizhou (MS[2025]009)
Authors’ Contribution
Formal Analysis: Xiaodong Wang (Lead). Funding acquisition: Xiaodong Wang (Lead). Investigation: Xiaodong Wang (Lead). Supervision: Xiaodong Wang (Lead). Writing – original draft: Xiaodong Wang (Lead). Software: Hong Yuan (Lead). Visualization: Hong Yuan (Lead). Data curation: Yifang Chen (Lead). Methodology: Yifang Chen (Lead). Conceptualization: Dunxue Chen (Lead). Project administration: Dunxue Chen (Lead). Resources: Dunxue Chen (Lead). Validation: Dunxue Chen (Lead). Writing – review & editing: Dunxue Chen (Lead).
Competing of Interest – COPE
The authors declare that they have no known competing financial interests or personal relationships that could have appeared to influence the work reported in this paper.
Ethical Conduct Approval – IACUC
The experimental protocol on fish was conducted according to the guidelines approved by the Animal Ethics Committee of Guizhou University (No:EAE-GZU-2024-T130)
Informed Consent Statement
All authors and institutions have confirmed this manuscript for publication.
Data Availability Statement
All are available upon reasonable request.